The first mistake in evaluating AI in warehousing is treating it as one budget line. A warehouse can spend on AMRs, computer vision inventory counting, predictive maintenance, slotting optimization, demand forecasting, or a visibility tower and still call every one of them “AI.” Finance will not experience them that way. Some reduce picker travel next quarter. Some depend on clean maintenance history that may not exist. Some create a better dashboard but leave the physical bottleneck untouched.
That distinction matters because the ROI spread is wide. AMR deployments can show payback under 24 months in favorable conditions, with some reported models claiming ROI above 250%, while broader integrated automation programs can require a three-to-five-year capital horizon depending on scope and facility change [1]. Computer vision inventory counting is comparatively mature. Physical AI and humanoid-style warehouse labor remain much earlier. A useful business case starts by asking which operational constraint is expensive enough to justify the technology.
| Use case | Warehouse pain point addressed | Maturity | Representative ROI indicators | Evidence strength | Implementation risk |
|---|---|---|---|---|---|
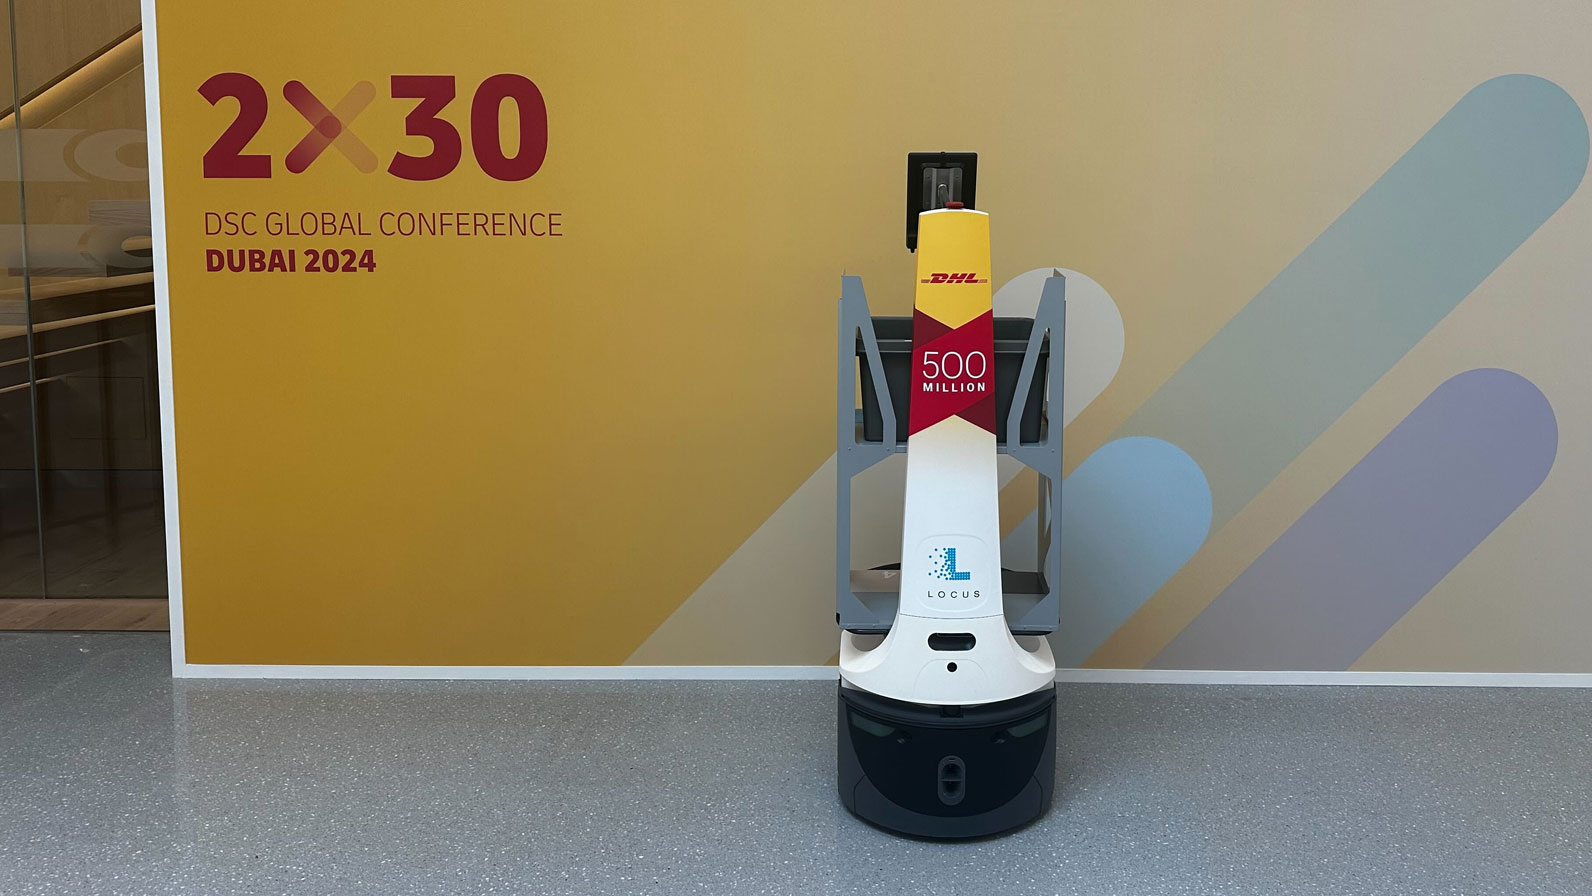
| AMR-based order picking and sorting | Picker travel, labor productivity, mispicks, sortation congestion | Production-proven in large deployments | 70–85% productivity gains reported; AMR payback under 24 months and ROI above 250% cited via Persistence Market Research; DHL/Locus surpassed 500M picks across 35 global sites, with the most recent 100M picks in 154 days [1][2] | Strongest operational evidence among the six, though several figures are from secondary aggregators | Medium: workflow redesign, WMS/WES integration, change management, robot fleet orchestration |
| Computer vision inventory counting | Cycle-count labor, inventory accuracy, stock location errors | Mature relative to other AI warehouse use cases | Inventory-counting accuracy improvement from 95% to 99.99% reported; inventory management is about 30% of the AI warehousing market [3][1] | Moderate to strong for maturity; accuracy claim needs source-specific caution | Medium: lighting, labeling, exception handling, master-data quality, reconciliation workflow |
| Predictive maintenance | Unplanned downtime, equipment life, repair scheduling | Established concept, uneven warehouse-specific proof | 30–40% downtime reduction and 20–40% equipment lifespan extension attributed to McKinsey through secondary sources [1][2] | Moderate but weaker independently; source chain matters | Medium to high: sensor coverage, maintenance history quality, CMMS integration |
| Dynamic slotting and layout optimization | Long pick paths, poor SKU placement, replenishment friction | Practical and increasingly accessible | Pick path reduction up to 60%; explainable AI slotting case reported 23% average order-picking-time reduction [4] | Moderate; mechanism is clear, case evidence is narrower | Medium: SKU velocity volatility, labor standards, WMS slotting rules, operational discipline |
| Demand forecasting for warehouse operations | Labor planning, replenishment timing, dock and storage pressure | Mature analytics, ROI depends on execution link | No warehouse-specific payback figure in the sources reviewed here; value is indirect through better planning | Limited for warehouse-only ROI in this source set | Medium: forecast adoption, upstream demand signal quality, planning process ownership |
| Visibility and control towers | Exception management, cross-node coordination, delayed decisions | Useful for complex networks, less direct inside one facility | No pain-point-specific warehouse ROI figure in the sources reviewed here | Limited for facility-level ROI | Medium to high: data latency, partner integration, alert fatigue, unclear decision rights |
The table is not a ranking of fashionable warehouse technologies. It is a way to keep the payback conversation tied to the work actually being removed, shortened, or made less error-prone. If the pain is picker travel, a visibility tower is probably not the first investment to defend. If the pain is inventory drift, AMRs may make picking faster while still sending workers to the wrong bin.
Market-size numbers need the same discipline. GM Insights puts the AI-in-warehousing market at $8.3 billion with 26.8% CAGR, but that is an AI-specific software, hardware, and services estimate [3]. Synkrato cites a $31.21 billion warehouse automation market, which is broader and includes traditional automation such as conveyance and AS/RS [1]. Mixing those two numbers makes the category look bigger, but it does not make any individual warehouse project easier to pay back.
Start with the constraint, not the AI label
The useful question is not “Which AI should we deploy?” It is “Which operating cost, service failure, or capacity limit is large enough that a measurable improvement would survive a capital review?” In a warehouse, that usually means one of a few measurable constraints: picking labor, travel time, inventory accuracy, downtime, slotting inefficiency, labor planning, or exception response.
| If the recurring pain is… | Prioritize first | Why it moves the P&L | What to verify before funding |
|---|---|---|---|
| High pick labor cost and excessive walking | AMRs or slotting optimization | Reduces non-value-added travel and can increase picks per labor hour | Baseline travel share, order profile, aisle constraints, WMS task logic |
| Mispicks, returns, and customer-service leakage | AMR-guided picking, vision checks, or process controls | Reduces error cost and rework; mispicks can cost up to $100 each in returns, reshipments, and service handling [2] | Current error rate, error causes, SKU similarity, verification points |
| Inventory accuracy problems and cycle-count labor | Computer vision inventory counting | Automates counting and creates more frequent location verification | Item visibility, label consistency, exception workflow, ERP/WMS reconciliation |
| Unplanned downtime on conveyors, sorters, forklifts, or automation assets | Predictive maintenance | Shifts maintenance from reactive repair to earlier intervention | Sensor coverage, failure history, maintenance codes, CMMS data quality |
| Congestion, slow waves, poor SKU placement | Dynamic slotting and layout optimization | Shortens pick paths and reduces touches without necessarily buying mobile robots | SKU velocity stability, replenishment frequency, labor rules, layout constraints |
| Late decisions across multiple sites or partners | Visibility/control tower | Improves exception handling and coordination, especially across a network | Data latency, decision ownership, alert thresholds, integration coverage |
For definitions of the major technology terms, the broader glossary on AI in warehouse management is useful. The rest of this guide stays closer to the funding question: what changes operationally, and how strong is the evidence?
AMR picking has the cleanest cost logic
AMRs are not automatically the best warehouse AI investment, but they are the easiest to explain when picking labor and travel dominate the cost base. The mechanism is visible on the floor: a worker spends less time walking empty distance, receives directed tasks, scans or confirms picks, and hands the travel burden to a robot fleet. When the order profile fits, the improvement shows up in picks per hour, overtime, temporary labor, and sometimes in error rates.
The reason this use case gets more trust than many AI warehouse claims is that the scale signal is real. DHL and Locus Robotics surpassed 500 million picks across 35 global sites, with the most recent 100 million picks completed in 154 days, as reported by secondary warehouse-automation aggregators [1][2]. That does not prove every AMR project will pay back quickly. It does prove that the model is past the demo stage in high-volume operations.

The supporting cost data is also directionally coherent. Order picking can account for up to 55% of warehouse operating costs, and more than half of picking time can be spent on travel, according to ScienceDirect data cited by Synkrato [1]. If that describes the facility, AMRs attack a large and familiar expense. If it does not—say the operation is already goods-to-person, highly automated, or constrained by replenishment rather than travel—the same robots may produce a thinner return.
Reported AMR productivity gains of 70–85% and payback under 24 months are useful screening numbers, not universal benchmarks [1][2]. A director should translate them into site-specific variables: current lines per labor hour, travel distance per order, wage and overtime rate, seasonal peaks, retention pressure, and the value of avoiding a building expansion. The investment gets easier to defend when the robot fleet either removes a labor constraint or defers a larger capital project.
Error reduction can add a second payback stream. Synkrato cites Opex data showing error rates moving from roughly 4% in manual operations to 0.04% in automated workflows, while SellersCommerce cites mispick cost up to $100 including returns, reshipments, and customer service [1][2]. The two figures should not be pasted into a business case without checking the warehouse’s own error profile. A facility with low current error rates and high travel time has a different AMR case than one losing margin to mispicks.
The failure mode is usually not that robots cannot move. It is that the facility is not ready to feed them clean work. WMS task release, pick sequencing, aisle congestion, charging strategy, tote flow, exception handling, and labor standards all affect whether the robot fleet converts motion into throughput. That is why AMRs deserve serious attention but not blind priority.
When AMRs should move to the top of the list
- Picking is a large share of operating cost, and travel is a large share of picking time.
- The warehouse uses labor-intensive each picking, batch picking, or cart-based processes.
- Seasonal peaks require expensive temporary labor or overtime.
- Mispicks are measurable and costly enough to justify guided workflows.
- The WMS can reliably release, sequence, and confirm tasks without excessive manual workaround.
Computer vision inventory counting is mature, but the accuracy claim needs inspection
Inventory counting is one of the cleaner AI-in-warehousing use cases because the work is specific: identify items, locations, labels, counts, or pallet positions and reconcile exceptions against the system of record. It does not need to promise a fully autonomous warehouse. It needs to reduce cycle-count labor, shrink the lag between a physical discrepancy and a system correction, and improve confidence in what is actually on the shelf.

GM Insights identifies inventory management as about 30% of the AI warehousing market, making it the largest segment in that estimate [3]. Synkrato also reports a computer-vision inventory-counting accuracy improvement from 95% to 99.99% and cites PepsiCo/KoiReader and Gather AI deployments [1]. That 95%-to-99.99% movement is attention-grabbing, but it needs careful handling: the business case should ask what was counted, how error was defined, what exceptions were excluded, and whether the environment resembled the facility under review.
In practical terms, vision-based counting pays when inventory inaccuracy causes real downstream cost: short shipments, expedites, production interruptions, failed replenishment, labor wasted searching for product, or unnecessary safety stock. If inventory accuracy is already high and cycle counting is a small labor line, the technology may still be useful for compliance or service quality, but the ROI will be harder to defend.
The implementation risk sits in the physical and data environment. Poor label placement, mixed pallets, damaged packaging, inconsistent lighting, blocked camera angles, duplicate locations, and weak item-master data can turn a clean vision demo into a long exception queue. DHL Supply Chain research cited by Encord points to data pipeline quality, rather than the algorithm itself, as the common deployment bottleneck in computer vision warehouse automation [5]. That matches what operations teams usually feel: the model may detect something, but the warehouse still has to decide what system record changes, who approves it, and how the exception is closed.
Where computer vision counting fits best
- High-SKU warehouses where manual cycle counting consumes recurring labor.
- Facilities where location accuracy directly affects service levels or production continuity.
- Operations with disciplined barcode, label, location, and item-master practices.
- Sites that can define a clear exception workflow instead of leaving discrepancies in a report queue.
Predictive maintenance is attractive, but the warehouse evidence is thinner
Predictive maintenance has an obvious operational appeal. A warehouse that depends on conveyors, sorters, automated storage equipment, forklifts, lifts, dock equipment, refrigeration, or packaging lines knows what unplanned downtime costs. The value mechanism is not abstract: detect abnormal vibration, temperature, run-time behavior, or failure patterns early enough to schedule maintenance before the asset stops production.
The headline figures are strong but should be labeled carefully. Deposco and SellersCommerce cite McKinsey-attributed estimates of 30–40% downtime reduction and 20–40% equipment lifespan extension [1][2]. In the source set reviewed here, the original McKinsey page was not directly accessible and the figures come through secondary sources. That does not make them useless; it makes them inappropriate as a guaranteed warehouse benchmark.
A stricter predictive-maintenance business case should start with the facility’s own downtime ledger. Which assets stop throughput? How many hours were lost? Was the cause predictable from sensor data or maintenance history? Did the outage create overtime, missed carrier windows, SLA penalties, spoiled inventory, or manual workarounds? If the answer is vague, the project is still a monitoring initiative, not yet an ROI-backed AI investment.
Data readiness is the divider. Predictive models need enough failure history, sensor coverage, maintenance codes, run hours, load context, and technician feedback to learn useful patterns. Many warehouses have maintenance knowledge in people’s heads, work orders with inconsistent codes, and assets that were never instrumented for prediction. In that environment, the first funded step may be telemetry and maintenance-data cleanup rather than advanced modeling.
Slotting optimization can pay without adding robots
Slotting and layout optimization are sometimes less exciting in a boardroom than robots moving through aisles, but the cost logic is similar: reduce wasted travel, touches, congestion, and replenishment friction. If fast-moving SKUs are buried in poor locations or order affinity is ignored, pickers and AMRs both spend time compensating for a bad layout.
Artech Digital cites pick path reduction up to 60% and an explainable AI slotting case with a 23% average order-picking-time reduction [4]. Those numbers should be treated as case-linked indicators, not a blanket promise. The mechanism, however, is practical. A slotting engine can use order history, SKU velocity, cube, weight, co-pick patterns, replenishment frequency, handling constraints, and congestion signals to recommend better locations.
Slotting deserves early consideration when the warehouse has a travel problem but is not ready for AMRs, or when AMRs would automate an inefficient layout. It can also be a lower-capital precursor to robotics: clean up SKU placement, measure the remaining travel burden, then decide whether mobile automation still has enough work to justify the fleet.
The risk is operational follow-through. A recommendation that is never executed does not reduce pick time. Reslotting requires labor windows, replenishment coordination, location discipline, and rules for when the optimizer can override legacy habits. Highly volatile SKU velocity can also erode the value of a static layout if the operation does not refresh recommendations frequently enough.
Demand forecasting helps the warehouse only when it changes labor, space, or inventory decisions
Demand forecasting is already familiar in supply chain planning, but its warehouse ROI is easy to overstate if the forecast never changes execution. A more accurate forecast has facility-level value when it improves labor scheduling, dock planning, replenishment timing, inventory positioning, wave planning, or temporary storage decisions.
The sources reviewed here do not include a warehouse-specific payback figure for demand forecasting. That means it should not be sold internally as if it has the same direct evidence base as AMR picking or computer vision counting. It may still be valuable, especially in operations with promotions, seasonality, volatile ecommerce demand, or frequent labor mismatch, but the business case must tie forecast improvement to a controllable warehouse decision.
For broader context on how predictive analytics compares with newer generative AI claims, see Generative AI in Warehouse Management. In a facility-level ROI review, though, the question remains basic: did the forecast reduce overtime, prevent congestion, improve fill performance, or lower avoidable handling?
Visibility and control towers are strongest when the decision problem spans sites
A visibility or control-tower layer can be useful when warehouses, carriers, suppliers, stores, plants, and customer commitments all interact. It can surface exceptions, prioritize late orders, coordinate recovery actions, and give leaders a common operating picture. Inside one building, however, a better dashboard does not automatically remove a bottleneck.
This is where AI language often gets ahead of the operating case. A control tower may use machine learning for ETA prediction, anomaly detection, risk scoring, or exception prioritization. The ROI still depends on whether someone can act sooner and whether the action changes cost or service. If alerts arrive after the decision window has closed, or if no team owns the response, the system becomes reporting overhead.
Based on the sources reviewed here, there is not enough pain-point-specific warehouse ROI evidence to rank control towers ahead of AMRs, computer vision counting, or slotting in a single-site warehouse. They move up the priority list when the problem is network coordination rather than aisle productivity: multi-site allocation, late inbound visibility, carrier disruption, store replenishment, or customer-order exception management.
Implementation risk: where the business case usually breaks
The most common failure point in warehouse AI is not a lack of impressive software. It is the gap between a controlled demo and the messy operating system it has to join: item masters, location data, labor standards, WMS rules, maintenance records, exception ownership, and supervisor adoption. Artech Digital cites an 85% AI project failure-to-meet-goals rate from unnamed industry research, a figure that should be treated as a cautionary secondary attribution rather than a precise warehouse benchmark [4]. Synkrato, citing Zebra Technologies’ 2024 Vision Study, reports that only 35% of companies have a clear starting strategy [1].
That planning gap matters because each use case fails differently.
| Use case | Main data dependency | Main integration dependency | Failure mode to watch |
|---|---|---|---|
| AMR picking | Clean task, SKU, location, and order data | WMS/WES task release and confirmation | Robots move efficiently but wait for work, create congestion, or expose weak process discipline |
| Computer vision inventory counting | Labels, item master, location hierarchy, image quality | WMS/ERP reconciliation and exception workflow | Accurate detections do not become trusted inventory corrections |
| Predictive maintenance | Sensor streams, failure history, maintenance codes | CMMS, asset control systems, technician workflow | The model flags anomalies but maintenance cannot act before downtime |
| Slotting optimization | Order history, SKU velocity, cube, weight, affinity | WMS slotting rules and replenishment execution | Recommendations are analytically sound but operationally ignored |
| Demand forecasting | Historical demand, promotions, calendar, upstream signals | Labor planning, replenishment, wave planning | Forecast accuracy improves but no warehouse decision changes |
| Control tower | Cross-system event data and timestamps | Carrier, supplier, WMS, TMS, OMS integrations | Alerts multiply without clear decision rights |
For a deeper treatment of why deployments underperform after promising pilots, see Why Most AI Warehouse Deployments Underdeliver. The short version for capital planning is simple: do not fund a model without funding the workflow that makes its output usable.
A practical prioritization sequence
A first-pass prioritization does not require a 40-page transformation roadmap. It requires enough operating truth to avoid buying a technology for the wrong constraint.
- Quantify the pain in operational units first: labor hours, travel time, mispicks, cycle-count hours, downtime hours, expedite cost, missed waves, or delayed shipments.
- Match the pain to the use case with the most direct mechanism. Travel-heavy picking points toward AMRs or slotting. Inventory drift points toward vision counting. Uptime loss points toward predictive maintenance.
- Discount the evidence by source quality. Production scale earns more weight than a vendor demo. Secondary aggregator data can guide screening, but it should not be treated as a guaranteed benchmark.
- Check the data and integration prerequisites before comparing vendor features. Bad location data can damage an AMR project; poor maintenance codes can damage predictive maintenance; weak exception ownership can damage vision counting.
- Build the business case around the metric the operation already owns. A picking project should defend picks per labor hour, travel reduction, and error cost. A maintenance project should defend downtime and asset-life economics.
If picking cost and travel dominate, AMRs and slotting optimization deserve the first serious comparison. If inventory accuracy repeatedly breaks fulfillment or replenishment, computer vision counting becomes more defensible. If downtime is the expensive constraint, predictive maintenance may be attractive, but it needs a stricter evidence test and a sober look at sensor and maintenance-data readiness. If the pain is broader network coordination, a control tower can be valuable, but it should not be forced into a single-site productivity business case.
The next step is not to pick the flashiest AI label. It is to pressure-test the ROI assumptions. The warehouse-specific ROI reality check is the right place to stress-test payback ranges, the platform-by-platform comparison helps once vendors enter the discussion, and the guide to building a business case for AI in warehouse management is where the operating assumptions should become finance-ready.
References
- Warehouse Automation Statistics, Synkrato.
- Warehouse Automation Statistics, SellersCommerce.
- AI in Warehousing Market Size & Share, Statistics Report 2032, GM Insights.
- AI in Order Picking Case Studies, Artech Digital.
- Computer Vision in Warehouse Automation, Encord.
Comments
Join the discussion with an anonymous comment.