The Financial Case for AI in Warehouse Management Is Now Proven
For years, the question around AI in warehouse management was whether the technology could deliver returns that justified the upfront investment. That question has been settled. A joint study by Mecalux and MIT, published in December 2025 and surveying more than 2,000 warehouse and supply chain leaders across 21 countries, found that the typical AI payback period now stands at two to three years — significantly faster than earlier generations of automation. McKinsey research, cited by Deposco, reports that 67% of companies have already seen revenue increases from AI in supply chain and inventory management.
These are not outlier results from early adopters with unlimited budgets. The Mecalux/MIT study found that more than 90% of warehouses now use some form of AI or advanced automation, and roughly 60% operate at advanced maturity levels. The data shows that the financial case has moved from theoretical to operational. The challenge for supply chain leaders and CFOs is no longer whether AI works in warehouses — it is how to model the investment correctly, account for the full cost structure, and avoid the common failure modes that prevent organizations from capturing the returns their peers are already realizing.
Market Context: Why Now Is the Time to Invest
The competitive window for warehouse AI investment is narrowing. According to Synkrato and The Network Installers, nearly 80% of warehouses globally remain non-automated. That means the majority of the market is still operating with manual processes, paper-based picking, and error rates that directly erode margins. The global warehouse automation market, valued at $31.21 billion in 2025, is projected to reach $36.24 billion in 2026, per Synkrato. The AI in warehousing segment alone was estimated at $11.22 billion in 2024 and is expected to grow at a CAGR of 26.1% through 2030, according to Grand View Research data cited by Appinventiv.
Several converging signals reinforce the urgency:
- 87% of companies plan to increase AI budgets, and 92% have new AI projects underway, according to the Mecalux/MIT study.
- 74% of supply chain leaders are ramping up technology investments, with 90% planning to spend over $1 million in this area over the next year, per the MHI Annual Industry Report cited by Mecalux.
- 2.1 million warehousing jobs could go unfilled by 2030, per The Network Installers, making labor productivity improvements not just a cost-saving measure but an operational necessity.
- Only 25% of warehouses worldwide have implemented any form of automation, meaning early movers still have a significant competitive advantage.
For a deeper look at the adoption landscape, see the MHI 2024 Annual Industry Report: Warehouse Robotics & AI Adoption Survey Data and the Supply Chain AI Vendor Funding & M&A: Market Signals Q2 2026 analysis.

Total Cost Breakdown: What AI Warehouse Automation Actually Costs
Building a credible business case requires a transparent view of the full cost structure. Vendor quotes often highlight software licensing and hardware, but the total investment extends well beyond those line items. Below is an itemized breakdown based on data from multiple sources, presented as ranges because facility size, existing infrastructure, and deployment scope create significant variation.
| Cost Category | Typical Range | Notes |
|---|---|---|
| Hardware (AMRs, AS/RS, sensors, cameras) | $50,000 – $2M+ per facility | AMRs are the lowest-cost entry point; AS/RS requires higher capital but saves up to 85% of storage space (The Network Installers) |
| Software (WMS AI modules, platform licenses) | $20,000 – $500,000 annually | Unified AI platforms (WMS + AI) typically cost more upfront but deliver faster payback (Deposco) |
| Integration (ERP/WMS connectivity, middleware) | $30,000 – $200,000 | Depends on number of legacy systems and data quality requirements |
| Network infrastructure upgrades | $30,000 – $150,000 per facility | The most commonly overlooked cost; rarely included in automation vendor quotes (The Network Installers) |
| Training and change management | $10,000 – $80,000 | 77% of companies view worker augmentation as the preferred entry point (Synkrato), making training a critical investment |
| Annual maintenance (15–20% of equipment cost) | 15–20% of initial hardware cost | Ongoing cost that must be factored into multi-year ROI models (The Network Installers) |
Small warehouses may spend tens of thousands of dollars on a focused AI deployment, while large distribution centers can invest millions. Codiant's analysis confirms this wide range, noting that implementation costs vary significantly by facility size and scope. The key is not to fixate on a single number but to model your specific facility's baseline and project the incremental investment required.
The Four Primary ROI Drivers and Their Quantified Impact
AI in warehouse management generates returns through four primary mechanisms. Each has been quantified by multiple sources, allowing you to build a defensible financial model rather than relying on vendor promises.
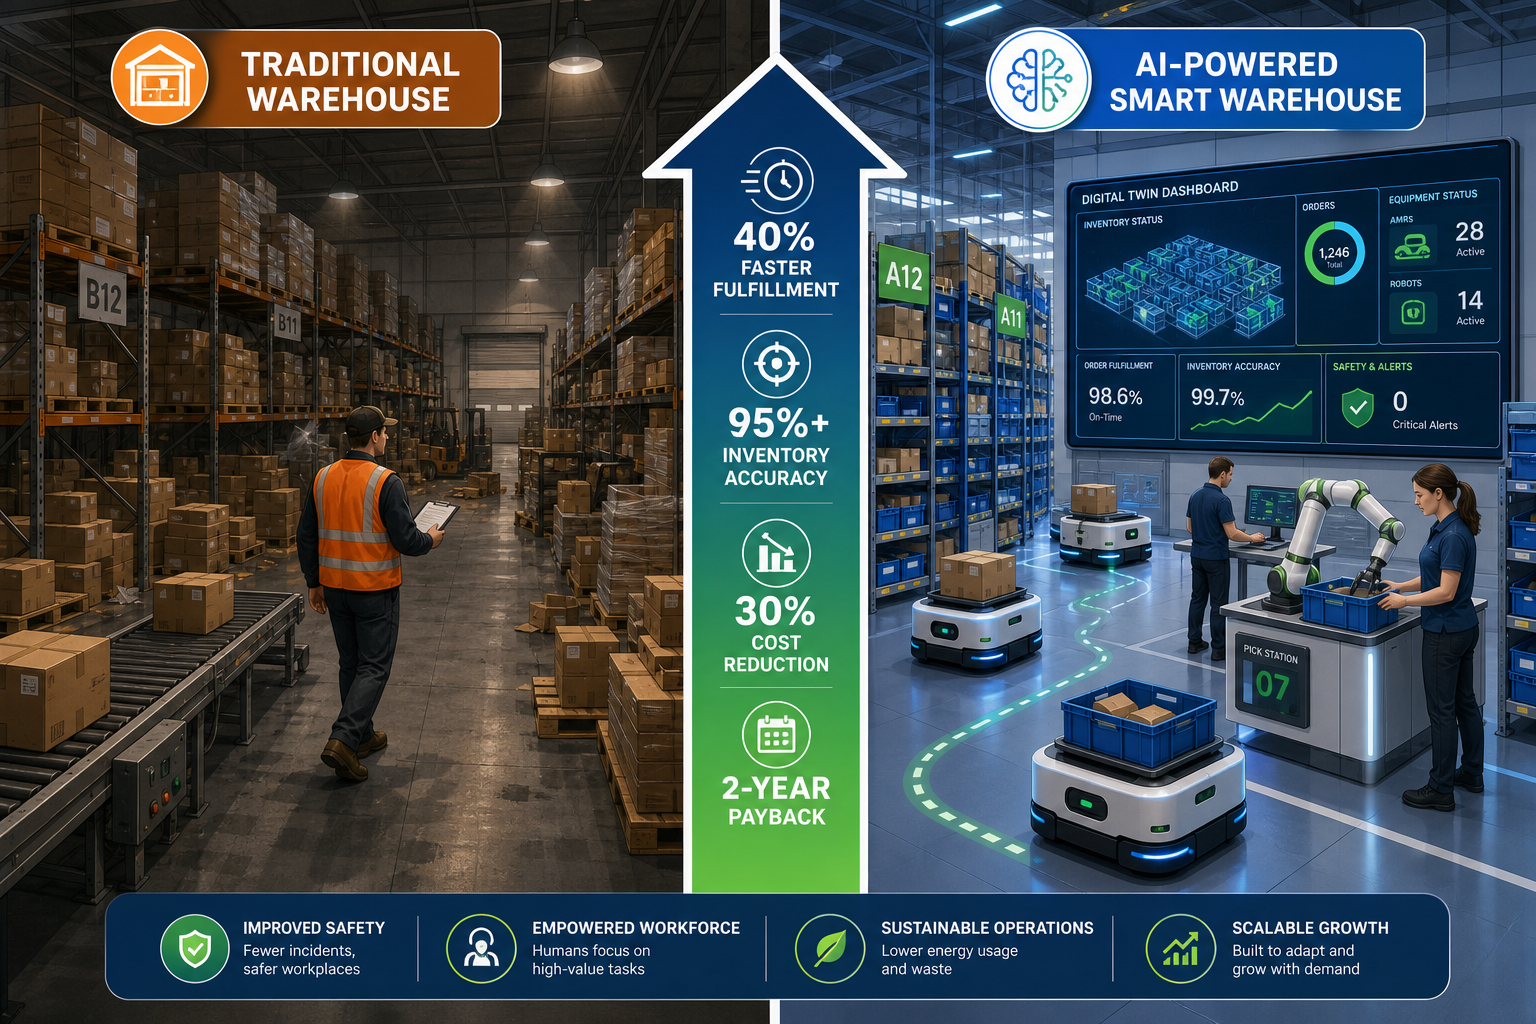
1. Labor Productivity Gains (30–50%)
Labor costs account for 50–70% of total warehousing budgets, according to The Network Installers. This makes labor productivity the single highest-ROI target for AI investment. Deposco reports that AI-driven planning and allocation can deliver labor productivity gains of 30–50%. Synkrato's clients report efficiency increases of over 25% without new capital equipment, a 50% decrease in travel time through optimized pick-paths and slotting, and orders processed up to 60% faster through streamlined wave planning. The Network Installers add that automated picking systems can improve order fulfillment speeds by up to 300%.
These gains compound. When AI optimizes slotting, reduces travel time, and sequences picks intelligently, the same workforce handles significantly more volume. For facilities facing labor shortages — and with 2.1 million warehousing jobs projected to go unfilled by 2030 — this is not just a cost-saving lever but a capacity-enabling one.
2. Accuracy Improvement (Manual 4% Error → Automated 0.04%)
Manual warehouse operations typically experience error rates of up to 4% in picking, according to Synkrato. AI-powered systems reduce that to 0.04% or lower — a 100x improvement. Automated systems achieve 99.96% to 99.99% picking accuracy, and AI-powered warehouses maintain 95%+ inventory accuracy continuously, per Deposco.
The financial impact of error reduction extends beyond the cost of returns. Each picking error triggers a cascade of downstream costs: customer service time, reverse logistics, restocking, and potential lost customer lifetime value. For high-volume operations, even a 1% reduction in error rate can translate to hundreds of thousands of dollars in annual savings.
3. Throughput Increases (40%+)
AI-driven intelligent routing, wave planning, and dynamic slotting directly increase throughput. Deposco reports a 40% improvement in order fulfillment speed through intelligent routing. Synkrato's data shows that streamlined wave planning helps facilities process orders up to 60% faster, and improved slotting and multi-warehouse orchestration leads to an average 29% reduction in transfer costs.
Throughput gains are particularly valuable during peak seasons when facilities are capacity-constrained. Rather than adding temporary labor or building new capacity, AI enables existing facilities to handle higher volumes with the same footprint.
4. Predictive Maintenance (30–50% Downtime Reduction)
Unplanned equipment downtime is one of the most disruptive and costly events in warehouse operations. AI-powered predictive maintenance can achieve a 30–50% reduction in unplanned downtime, according to both The Network Installers and Appinventiv. Appinventiv further notes 15–25% savings in maintenance costs. Deposco reports a 30% reduction in operational costs through predictive maintenance.
The mechanism is straightforward: AI models analyze real-time sensor data from conveyors, sorters, robots, and other equipment to detect anomalies before they cause failures. Instead of following fixed maintenance schedules — which either over-maintain or miss emerging issues — facilities shift to condition-based maintenance that maximizes equipment uptime and lifespan.
Payback Period Benchmarks by Technology Type
Not all AI warehouse technologies have the same payback profile. The choice between AMRs, unified AI platforms, and AS/RS depends on your facility's size, throughput requirements, and capital allocation timeline. The table below summarizes payback benchmarks from multiple sources.
| Technology | Typical Payback Period | Reported ROI | Deployment Complexity | Best For |
|---|---|---|---|---|
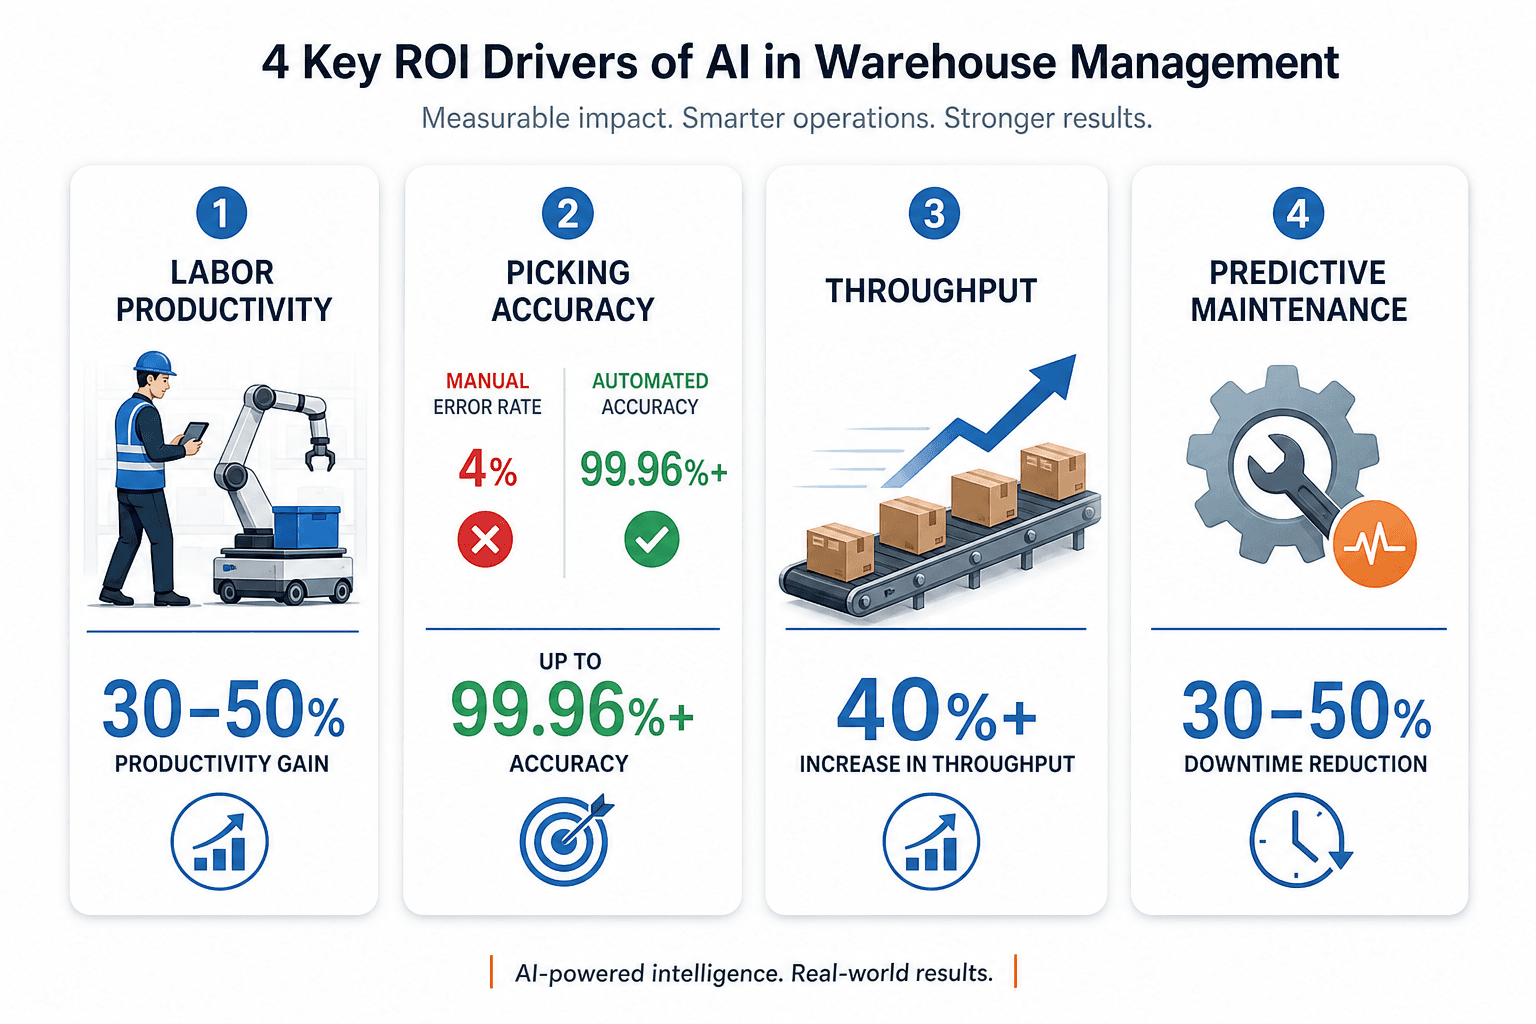
| Autonomous Mobile Robots (AMRs) | Under 24 months | 250%+ ROI in supported deployments | Low to medium; weeks to months with RaaS models | Facilities starting automation journey; flexible, scalable entry point |
| Unified AI Platforms (WMS + AI modules) | 6–18 months | Returns in under 6 months for leading solutions | Medium; requires data integration and process alignment | Facilities with existing WMS seeking rapid ROI through software optimization |
| Automated Storage & Retrieval Systems (AS/RS) | 2–3 years | Saves up to 85% of storage space; cuts manual labor by two-thirds | High; significant capital and facility modification required | High-density storage needs; facilities with stable, high-volume SKU profiles |
The Mecalux/MIT study's finding of a 2–3 year typical AI payback period is the most broadly applicable benchmark, as it aggregates across technology types and facility sizes. However, the study also notes that unified AI platforms — which combine WMS functionality with AI optimization — tend to deliver faster returns because they require less physical infrastructure investment. Deposco's data supports this, with unified platforms delivering payback in 6–18 months and leading solutions often achieving returns in under six months.
Building the Financial Model: A Framework for Your Business Case
The benchmarks above are reference points, not guarantees. A defensible business case requires a custom financial model built on your facility's specific baseline data. Here is a structured approach to building that model.
Step 1: Establish Your Baseline
Before projecting AI-driven improvements, you need to quantify your current state. Gather data on the following metrics for at least the past 12 months:
- Total labor costs (wages, overtime, temporary labor, benefits) — remember that labor is 50–70% of warehouse budgets
- Picking error rate and cost per error (including returns processing, customer service, and lost sales)
- Order fulfillment throughput (orders per hour, lines per hour)
- Unplanned downtime hours and associated costs (lost throughput, idle labor, expedited shipping)
- Inventory accuracy percentage and cost of inventory discrepancies
- Storage utilization rate and real estate cost per square foot
Step 2: Project AI-Driven Improvements
Apply the benchmarks from this article to your baseline, but use conservative estimates. For example:
- If your labor costs are $5M annually, a conservative 20% productivity gain (below the 30–50% range) yields $1M in annual savings
- If your error rate is 3% and each error costs $25, moving to 0.1% saves $725,000 per 100,000 orders
- If unplanned downtime costs $200,000 annually, a 30% reduction saves $60,000
Step 3: Calculate Net Present Value (NPV) and Payback Period
Map the total investment (from the cost breakdown table above) against projected annual savings over a 5-year horizon. Discount future cash flows at your organization's weighted average cost of capital (WACC). The payback period is the point at which cumulative savings equal the initial investment. For most AI warehouse investments, the data suggests payback within 18–36 months.
Step 4: Run Sensitivity Analysis
The most credible business cases include sensitivity analysis on key variables. Test your model under three scenarios:
- Conservative: 50% of the lower-end benchmark for each ROI driver
- Expected: Mid-range benchmarks as applied to your baseline
- Optimistic: Upper-end benchmarks, achievable with strong execution and supportive infrastructure
If the business case holds even under the conservative scenario, you have a strong foundation for investment approval. If it only works under optimistic assumptions, you need to address the risks before proceeding.
Risk Factors, Common Failure Modes, and How to Mitigate Them
The gap between AI investment intent and successful execution is well-documented. Gartner's research, cited in our analysis of The Gartner AI Strategy Paradox, found that while 94% of organizations intend to invest in AI, only 23% have a defined strategy. The result is that only 4% of leaders succeed in operationalizing AI at scale, as documented in Why Most Supply Chain AI Initiatives Fail. Understanding these failure modes is essential to building a business case that accounts for execution risk.
Risk 1: Data Quality and Integration Complexity
AI models require clean, consistent, and sufficiently granular data. Many warehouses operate with fragmented systems — a WMS from one vendor, an ERP from another, and manual spreadsheets filling the gaps. Synkrato notes that while 93% of logistics professionals use WMS systems, reliance on paper-based picking only dropped to 44% in 2025. Integration costs can run $30,000–$200,000, and poor data quality can render AI models unreliable.
Mitigation: Conduct a data readiness audit before selecting a vendor. Identify the systems that will feed the AI model, assess data completeness and accuracy, and budget for data cleansing and integration as part of the project plan.
Risk 2: Underestimating Infrastructure Requirements
Network infrastructure upgrades — costing $30,000–$150,000 per facility — are the most commonly overlooked cost in automation projects, according to The Network Installers. AMRs and IoT sensors require reliable, high-bandwidth wireless coverage across the entire facility. Facilities built before the IoT era often lack the network density to support real-time AI operations.
Mitigation: Include a network assessment in your pre-investment phase. Factor infrastructure costs into the total investment, not as a separate IT budget item. Consider phased deployment starting with a pilot zone that can be fully networked at lower cost.
Risk 3: Change Management Resistance
Synkrato reports that 77% of companies view worker augmentation as the preferred entry point for warehouse AI, but only 35% have a clear starting strategy. The gap between aspiration and execution often stems from organizational resistance — workers and managers who fear displacement or lack the skills to work alongside AI systems.
Mitigation: Frame AI investments as augmentation, not replacement. Invest in training programs early. Intellias notes that human-machine collaboration powered by machine learning is projected to boost productivity by up to 30%. Involve warehouse managers in the vendor selection and pilot design process to build ownership.
Risk 4: Vendor Lock-In and Platform Dependency
The warehouse AI market is consolidating rapidly. Choosing a platform that tightly couples hardware, software, and AI models can create dependency that makes future switching costly or impossible. This is particularly relevant for AMR and AS/RS investments where hardware replacement is capital-intensive.
Mitigation: Prioritize vendors with open APIs and demonstrated integration with your existing WMS and ERP. Include exit costs and data portability provisions in contracts. For AMR investments, consider Robotics as a Service (RaaS) models, which Intellias notes can be up and running in weeks to months with lower upfront commitment.
Conclusion: The Window for Competitive Advantage Is Narrowing
The data is clear: AI in warehouse management now delivers proven, quantifiable ROI with payback periods that justify investment. The Mecalux/MIT study's finding of a 2–3 year typical payback, combined with the 67% of companies reporting revenue increases from AI (McKinsey), provides a strong empirical foundation for building a business case.
But the window for competitive advantage is narrowing. With 80% of warehouses still non-automated and 87% of companies planning to increase AI budgets, the early-mover advantage will erode as adoption becomes the norm rather than the exception. The 2.1 million warehousing jobs projected to go unfilled by 2030 will make labor productivity improvements a necessity, not a competitive differentiator.
Your next step is to build the financial model. Start with the CSCO's Data Readiness Checklist for Supply Chain AI Implementation to assess your infrastructure readiness. Then apply the cost breakdown, ROI driver benchmarks, and payback period data from this article to your facility's baseline. Run the sensitivity analysis. If the numbers hold under conservative assumptions, you have the foundation for an investment decision that your CFO can support.
The technology works. The data is available. The question is whether your organization will act while the window for competitive advantage remains open.
Comments
Join the discussion with an anonymous comment.