
What Is Predictive Analytics in Logistics? A Maturity Framework
Predictive analytics in logistics uses historical data, statistical algorithms, and machine learning models to forecast future events — shipment delays, demand spikes, equipment failures, carrier performance — before they happen. It sits in the middle of the analytics maturity spectrum: descriptive analytics tells you what happened, predictive analytics tells you what will likely happen, and prescriptive analytics recommends what to do about it.
Most logistics organizations today operate at the descriptive level: dashboards showing last week's on-time delivery rate, last month's cost per mile, or the current inventory position. Moving to predictive means answering questions like "Which shipments are at risk of missing their delivery window tomorrow?" or "Which lanes will see capacity constraints next quarter?" The leap is not primarily about technology — it is about data readiness, process maturity, and organizational willingness to act on forecasts rather than react to outcomes.
This article covers seven distinct predictive analytics use cases in logistics, each with documented deployment patterns and measurable outcomes. It also includes a prioritization framework to help you decide where to start based on your organization's data readiness and business impact profile. This is a logistics-specific library, not a cross-functional survey — for the broader picture across planning, procurement, and warehouse operations, see our AI Use Case Library: The 10 Highest-Impact AI Applications in Supply Chain Management.

Use Case 1: Demand Forecasting and Inventory Optimization
Demand forecasting is the most mature predictive analytics application in logistics, and for good reason: getting the demand signal right cascades into every downstream decision — inventory positioning, warehouse capacity planning, carrier contracting, and last-mile routing.
Traditional forecasting methods (moving averages, exponential smoothing, or simple regression) struggle with the volatility that characterizes modern logistics: promotional spikes, seasonal shifts, supply disruptions, and changing consumer behavior. Machine learning models handle these complexities by incorporating dozens or hundreds of external variables — weather data, economic indicators, social media sentiment, competitor pricing — alongside internal sales history.
The documented outcomes are substantial. Dell uses predictive analytics to understand customer demand and order parts in advance, cutting inventory costs by 30%. Walmart's AI-powered inventory optimization achieved up to a 25% reduction in inventory holding costs. A national grocery chain reduced waste on fresh produce by 15% over a year using SAP Integrated Business Planning for perishable demand forecasting. A mid-size apparel retailer cut out-of-stock incidents by 20% and improved online order fulfillment after nine months using Microsoft Azure Machine Learning.
Key data inputs for this use case include:
- Historical sales and order data (minimum 2–3 years for seasonality patterns)
- Promotional calendar and marketing spend data
- External signals: weather, economic indicators, competitor activity
- Inventory position and lead time data from WMS and ERP systems
- Carrier capacity and transit time history from TMS
Use Case 2: Route Optimization and ETA Prediction
Route optimization is where predictive analytics meets one of the logistics industry's most persistent inefficiencies: empty miles. According to industry data, 35% of heavy truck miles in the United States are driven empty. For a fleet the size of UPS — roughly 96,000 vehicles — eliminating just one mile per driver per day saves approximately $50 million annually.
UPS's ORION (On-Road Integrated Optimization and Navigation) system is the most cited example. The system uses predictive algorithms to optimize delivery routes dynamically, accounting for traffic patterns, delivery windows, package volumes, and driver preferences. UPS reports that ORION saves the company between $100 million and $200 million annually. The company's newer UPS Network Planning Tools are expected to bring additional annual savings of up to $200 million.
Beyond mileage reduction, predictive ETA models improve customer experience and operational planning. By analyzing historical transit times, traffic patterns, weather conditions, and driver behavior, these models provide accurate arrival windows that allow warehouses to schedule labor, cross-dock operations, and customer notifications more efficiently.
For readers evaluating route optimization tools, our AI Route Optimization Buyer's Guide covers free trials, POC frameworks, and vendor evaluation criteria.
Use Case 3: Predictive Maintenance for Fleet and Assets
Unplanned equipment downtime is one of the most expensive events in logistics. A vessel that breaks down at sea, a truck that fails mid-route, or a warehouse conveyor that stops during peak processing hours creates cascading delays that ripple through the entire network. Predictive maintenance uses sensor data and machine learning models to forecast equipment failures before they occur, enabling maintenance to be scheduled during planned downtime rather than emergency repairs.
Maersk provides the most prominent example in ocean freight. The company applied predictive analytics to ship engine failure prevention and schedule optimization, cutting vessel downtime by 30% and generating over $300 million in annual savings. Maersk also noted that the cost of transporting empty containers alone reaches a billion dollars per year — a problem that predictive maintenance intersects with, since vessel reliability directly affects container repositioning schedules.
The data infrastructure for predictive maintenance typically includes:
- IoT sensors on engines, transmissions, brakes, and tires
- Telematics data: speed, RPM, fuel consumption, temperature
- Historical maintenance records and failure logs
- Environmental data: terrain, weather, road conditions
- Usage patterns: route types, load weights, driver behavior
Use Case 4: Carrier Performance Forecasting
Shippers typically evaluate carriers based on historical performance — on-time delivery rates, damage claims, and cost. But historical metrics are backward-looking. A carrier that performed well last quarter may be degrading due to driver turnover, equipment age, or route changes that are not yet visible in aggregate statistics.
Carrier performance forecasting applies predictive models to forward-looking indicators: driver retention rates, equipment maintenance schedules, lane-specific transit time variability, and capacity utilization trends. The models produce a forward-looking reliability score for each carrier on each lane, updated in near real-time as new data arrives.
UPS Capital's DeliveryDefense™ Address Confidence system illustrates the approach in a different context: it assigns confidence scores to delivery locations by analyzing real-time data streams against historical delivery outcomes, predicting which addresses are likely to cause delivery failures. The same pattern applies to carrier evaluation — scoring carriers not on what they did last month, but on what the data suggests they will do next week.
Typical data sources for carrier performance forecasting include:
- TMS data: tender acceptance rates, transit time variance, on-time delivery by lane
- Carrier-provided data: driver turnover, fleet age, safety scores
- External data: fuel price trends, regional capacity indices, weather forecasts
- Contract data: rate commitments, volume guarantees, service level agreements
Use Case 5: Supply Chain Risk Management
Logistics risk management has traditionally been reactive: a port closes, a hurricane hits, a supplier declares bankruptcy, and the response team scrambles to find alternatives. Predictive analytics shifts the timeline forward by identifying risk signals before they materialize into disruptions.
Predictive risk models ingest data from multiple sources — weather forecasts, geopolitical news feeds, port congestion indices, supplier financial health scores, and social media sentiment — and produce risk scores for specific lanes, regions, or time windows. When a risk score crosses a threshold, the system can trigger automated actions: reroute shipments, increase safety stock, or activate alternative carriers.
Walmart's AI-powered inventory optimization, which achieved up to a 25% reduction in inventory holding costs, is partly a risk management application. By predicting demand more accurately, Walmart reduced the safety stock buffer needed to protect against demand variability — effectively using predictive analytics to absorb risk that previously required physical inventory.
Key risk categories that predictive models address in logistics:
- Weather-related disruptions: hurricanes, floods, winter storms affecting specific corridors
- Geopolitical risks: port strikes, trade policy changes, customs delays
- Carrier capacity risk: predicting capacity crunches before peak seasons
- Supplier risk: financial distress signals from suppliers that could disrupt inbound logistics
- Infrastructure risk: port congestion, rail bottlenecks, highway construction projects
Use Case 6: Last-Mile Delivery Optimization
Last-mile delivery accounts for 53% of total shipping costs, making it the most expensive segment of the logistics chain and the one with the highest customer-facing impact. Predictive analytics in last-mile operations focuses on three areas: delivery window accuracy, dynamic rerouting, and customer preference prediction.
Delivery window accuracy is the most visible to customers. Predictive models that account for traffic patterns, driver behavior, package characteristics, and building access conditions can narrow delivery windows from four-hour blocks to one-hour or even 30-minute windows. This reduces failed delivery attempts (which cost an average of $17 per reattempt) and improves customer satisfaction.
Dynamic rerouting during the last mile differs from the route optimization use case described earlier. While route optimization focuses on planning the most efficient sequence of stops before drivers leave the depot, last-mile dynamic rerouting adjusts routes in real-time as new orders arrive, traffic conditions change, or customers request delivery time changes. This requires a different class of predictive models — ones that can re-optimize a route in seconds rather than hours.
Customer preference prediction uses historical delivery data to forecast which delivery options a customer is likely to choose — time of day, delivery location (front door vs. locker vs. neighbor), and signature requirements. By anticipating preferences, logistics providers can pre-position inventory and optimize route sequences before the customer even places an order.
Use Case 7: Empty Container and Asset Repositioning
Empty container management is one of the most costly operational challenges in ocean freight and intermodal logistics. Containers must be repositioned to locations where they are needed for export loads, but predicting where and when demand will arise — and balancing that against storage costs, repositioning transportation costs, and container availability — is a complex optimization problem.
NileDutch, a West Africa-focused ocean carrier, applied predictive analytics to this problem and achieved a 12%+ reduction in empty container management costs. The system predicted where empty containers would be needed based on historical trade patterns, seasonal demand shifts, and vessel schedules, enabling the company to reduce its overall container fleet size while maintaining service levels.
The same predictive approach applies to other reusable assets: pallets, totes, railcars, and chassis. Any asset that must be repositioned to match demand patterns is a candidate for predictive repositioning models.
Implementation Prerequisites and Risk Factors
Deploying predictive analytics in logistics requires more than buying software. The following table summarizes the key prerequisites across four dimensions, along with common failure modes that organizations encounter.
| Dimension | Prerequisite | Common Failure Mode |
|---|---|---|
| Data Quality | Clean, consistent historical data spanning at least 12–24 months; integrated TMS, WMS, and ERP data | Garbage-in-garbage-out: models trained on incomplete or inconsistent data produce unreliable forecasts |
| Data Integration | Real-time or near-real-time data pipelines connecting operational systems to the analytics platform | Batch processing delays mean predictions arrive too late to influence operational decisions |
| Organizational Readiness | Clear ownership of forecast-driven decisions; willingness to override intuition with model outputs | Planners ignore model recommendations because they don't trust the "black box" or because incentives reward reactive behavior |
| Model Governance | Process for monitoring model accuracy, detecting drift, and retraining on new data | Models degrade over time as operational patterns change, and no one notices until predictions are consistently wrong |
Most organizations see initial results within 6 to 12 months when they have clear goals, committed leadership, and dedicated project teams. The organizations that fail are typically those that treat predictive analytics as a technology project rather than an operational transformation — they buy the software, connect the data, and then discover that no one in the operations team is empowered to act on the predictions.
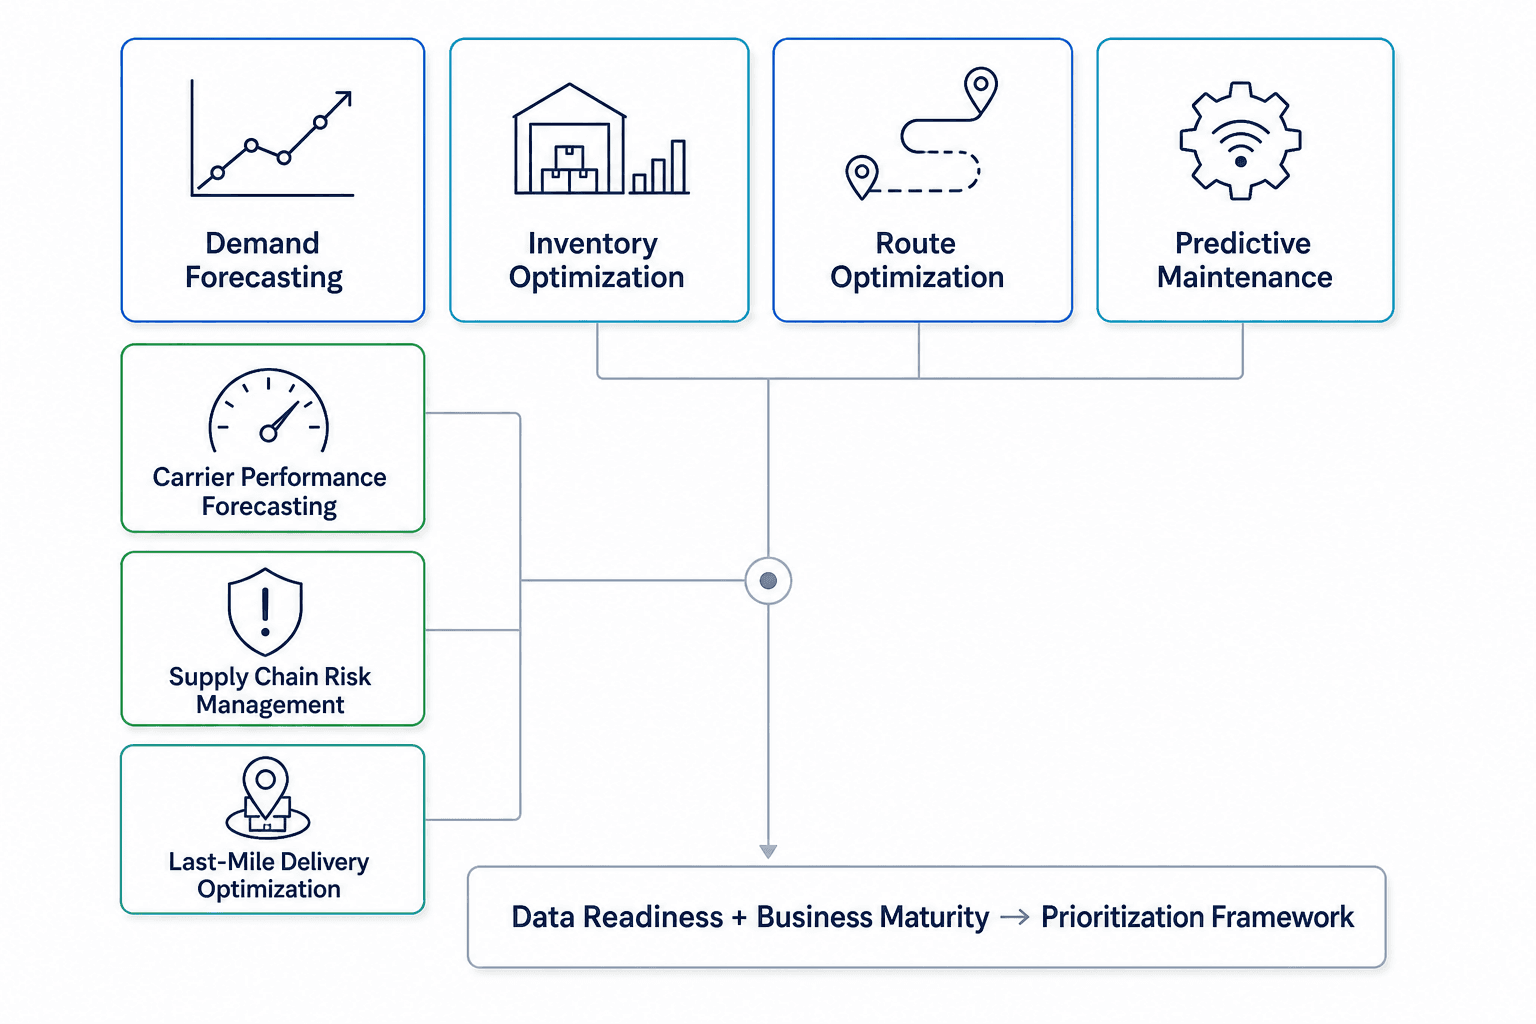
How to Prioritize Which Use Case to Adopt First
Not all seven use cases are equally accessible or impactful for every organization. The right starting point depends on two factors: data readiness (how clean, accessible, and integrated your data is) and business impact (how much value a successful deployment would generate in your specific operational context).
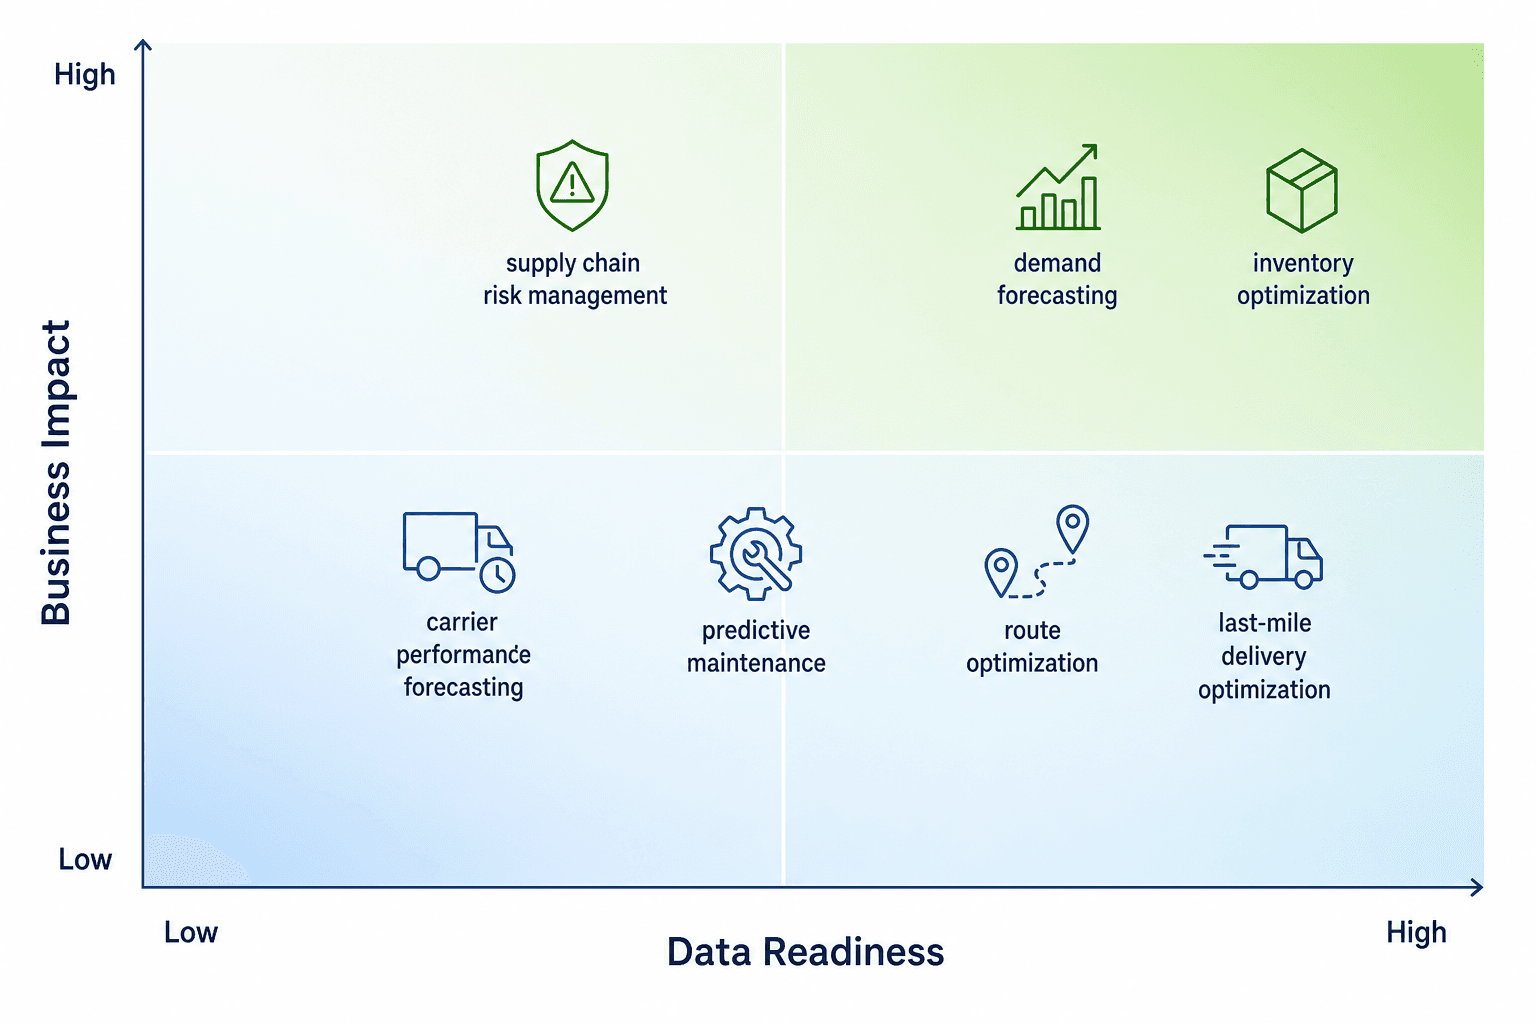
The following table maps each use case to typical data readiness requirements and business impact profiles, helping you identify where your organization is likely to see the fastest return.
| Use Case | Data Readiness Required | Typical Business Impact | Recommended Starting Point |
|---|---|---|---|
| Demand Forecasting & Inventory Optimization | High: 2+ years of clean sales data, ERP integration | 10–20% forecast accuracy improvement; 5–10% inventory reduction | Best for organizations with mature ERP and demand data |
| Route Optimization & ETA Prediction | Medium: TMS data, GPS/telematics feeds | $100–200M annual savings at UPS scale; 10–15% mileage reduction | Best for fleets with existing telematics and TMS |
| Predictive Maintenance | Medium-High: IoT sensor data, maintenance logs | 30% reduction in unplanned downtime (Maersk scale) | Best for asset-intensive operations with sensor infrastructure |
| Carrier Performance Forecasting | Low-Medium: TMS data, carrier scorecards | Improved carrier selection, reduced service failures | Good starting point for organizations with basic TMS data |
| Supply Chain Risk Management | Medium: External data feeds, risk intelligence sources | Reduced disruption impact, lower safety stock requirements | Best for organizations with existing risk monitoring processes |
| Last-Mile Delivery Optimization | Medium: Route data, customer preference history | 53% of shipping costs; improved delivery window accuracy | Best for high-volume last-mile operations |
| Empty Container Repositioning | High: Container tracking data, trade pattern history | 12%+ reduction in empty container costs (NileDutch scale) | Best for ocean carriers and large intermodal operators |
A practical approach for most organizations: start with the use case that has the highest data readiness score and a clear, measurable business outcome. For many, that is demand forecasting and inventory optimization, because the data is typically already available in ERP systems and the ROI metrics (forecast accuracy, inventory turns, stockout rates) are well understood. From there, expand into adjacent use cases as data infrastructure and organizational capability mature.
For readers building a formal business case, our article The ROI of Predictive Analytics in Logistics: What the Numbers Actually Say provides a deeper ROI analysis for each use case, including payback timelines, implementation cost ranges, and risk-adjusted return estimates. For readers who want the ML technique breakdown rather than the use-case perspective, see Machine Learning in Logistics: A Use-Case-by-Use-Case ROI Breakdown.
Comments
Join the discussion with an anonymous comment.