Why Demand Forecasting ROI Deserves Its Own Business Case
Demand forecasting is not a generic AI use case. It is the planning function that directly determines inventory levels, production schedules, procurement commitments, and service reliability across the entire supply chain. When a forecast is wrong, the cost propagates: excess inventory ties up working capital, stockouts erode revenue, and expedited logistics erode margins. That is why the ROI of AI in demand forecasting is both measurable and compound — but it is also why the payback timeline is longer than many executives expect.
This article is scoped exclusively to demand forecasting. It does not cover logistics routing, warehouse robotics, or procurement automation — those functions have their own ROI profiles covered elsewhere on this site. The thesis here is specific: AI-driven demand forecasting delivers well-documented, repeatable improvements in accuracy, inventory efficiency, and revenue protection, but the path to satisfactory returns typically spans two to four years. Organizations that plan for compound returns across that window will capture a competitive advantage; those expecting quick payback in under twelve months will likely be disappointed.
The Accuracy Improvement Range: What AI Actually Delivers
Forecast accuracy is the primary lever for all downstream ROI. When a demand forecast is more precise, every decision that depends on it — inventory positioning, production scheduling, supplier commitments — improves proportionally. The question is not whether AI improves accuracy, but by how much, and under what conditions.
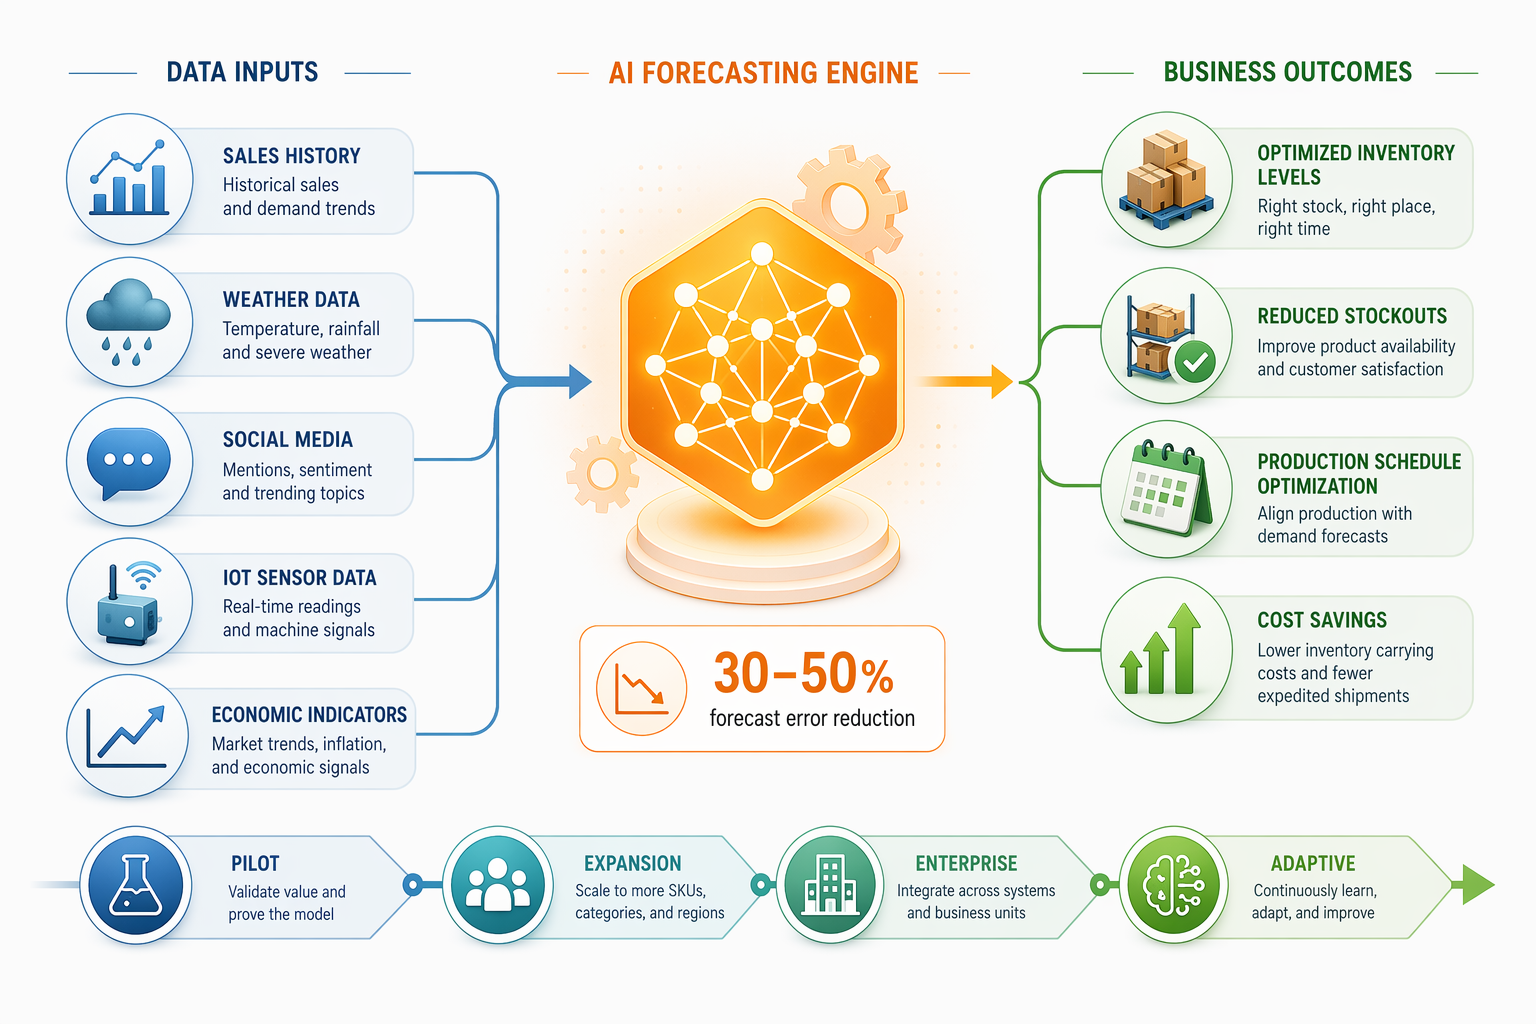
Multiple independent sources converge on a consistent range. McKinsey estimates that organizations implementing AI-driven demand forecasting can reduce forecast errors by 30% to 50%. The World Journal of Advanced Engineering Technology and Sciences reports that AI lowers Weighted Absolute Percentage Error (WAPE) by 40% to 75% and reduces forecast bias by 30% to 70%. A study in the International Journal on Science and Technology found that AI-driven systems bring forecast error rates down to 10% to 16%, compared to 25% to 40% for traditional statistical methods. IBM reports that AI can reduce forecasting errors by as much as 50%.
| Source | Metric | Improvement Range | Methodology Note |
|---|---|---|---|
| McKinsey (via ToolsGroup) | Forecast error reduction | 30–50% | Modeling estimates; widely cited in industry |
| WJAETS (via GroupBWT) | WAPE reduction | 40–75% | Peer-reviewed journal; specific to FMCG context |
| Intl. Journal on Science & Technology | Error rate (AI vs. traditional) | 10–16% vs. 25–40% | Academic study; compares ML to time-series baselines |
| IBM | Forecast error reduction | Up to 50% | Vendor-reported; cites client case studies |
| Blue Ridge | Improvement over traditional methods | 20%+ | Vendor-reported; more conservative than McKinsey |
The practical implication is that an organization currently running at a 30% forecast error rate can expect to move into the 15–21% range with AI, and a best-in-class deployment can push below 10%. That shift directly unlocks the inventory and cost benefits discussed in the next section.
Inventory and Cost Impact: From Safety Stock to Working Capital
Better forecasts mean less safety stock. This is the most direct second-order ROI driver because inventory carrying costs — warehousing, insurance, obsolescence, and capital cost — typically represent 20% to 30% of inventory value annually. Reducing excess inventory by even a modest percentage translates directly to working capital release.
McKinsey's research on AI-enabled distribution networks reports 20% to 30% inventory reduction, 5% to 20% logistics cost reduction, and 5% to 15% procurement spend reduction. These figures come from a broad distribution study and apply across industries, though the magnitude varies by starting maturity and data quality.
Real-world deployments confirm these ranges. IBM reports that Novolex, a packaging manufacturer, reduced excess inventory by 16% and cut planning cycles from weeks to days after implementing AI-driven forecasting. Idaho Forest Group reduced forecasting time from more than 80 hours to under 15 hours per cycle — a productivity gain that frees planners for higher-value analysis rather than spreadsheet manipulation.
- Inventory reduction: 20–30% (McKinsey); 16% documented at Novolex (IBM)
- Logistics cost reduction: 5–20% from fewer expedited shipments and optimized deployment (McKinsey)
- Procurement spend reduction: 5–15% through better demand visibility and fewer rush orders (McKinsey)
- Planning cycle time: Idaho Forest Group compressed from 80+ hours to under 15 hours per cycle (IBM)
Revenue Impact: Reducing Lost Sales and Stockouts
The revenue side of the ROI equation is often harder to quantify than the cost side, but the potential impact is larger. Stockouts do not just defer revenue — they permanently lose it when customers switch to competitors. McKinsey estimates that AI-driven demand forecasting can reduce lost sales due to stockouts by up to 65%. For a company with $1 billion in revenue and a 5% stockout rate, that represents up to $32.5 million in recovered revenue.
The Lennox Residential case provides a concrete example. Using machine learning and cluster analysis, Lennox improved service levels by 16% and increased inventory turns by 25% across more than 200 micro-climates. The service level improvement means fewer stockouts for HVAC distributors and contractors; the inventory turn increase means less capital tied up in finished goods. Both metrics move in the same direction when forecast accuracy improves.
For retailers and CPG companies operating at the SKU-store level, the revenue impact is amplified by substitution effects. When a specific SKU is out of stock, AI forecasting that incorporates substitution patterns can recommend alternative inventory positions that minimize total lost sales. This is a capability that traditional time-series forecasting cannot replicate. For a deeper exploration of how AI handles these complex retail demand signals, see our article on AI demand forecasting in retail and CPG at the SKU-store level.
The Profitability Differential: AI-Mature Supply Chains vs. the Rest
The individual ROI metrics — accuracy, inventory, revenue — are necessary for building a business case, but the strategic argument for AI investment comes from a broader finding. Accenture analyzed 1,148 companies across 10 industries and found that organizations with AI-mature supply chains are 23% more profitable than their peers. This is not a marginal improvement — it is a structural competitive advantage that compounds over time.
The profitability differential is driven by the cumulative effect of multiple AI applications across the supply chain, but demand forecasting is the foundational layer. Without accurate forecasts, inventory optimization, procurement automation, and production scheduling all operate with degraded inputs. An AI-mature demand forecasting capability is the prerequisite for the broader supply chain AI transformation that drives the 23% profitability gap.
The Realistic ROI Timeline: Why 2–4 Years Is the Norm
This is the most important and most frequently misunderstood aspect of AI demand forecasting ROI. The metrics above — 30–50% error reduction, 20–30% inventory reduction, up to 65% fewer lost sales — are real and achievable, but they are not immediate. Deloitte's research on AI investment outcomes found that 85% of organizations increased AI investment, but only 6% saw ROI in under a year. The majority of organizations that achieve satisfactory returns do so within a 2 to 4 year timeframe.
The reasons for this timeline are structural, not a reflection of the technology's capability:
- Data readiness: Most organizations need 6–12 months to clean, normalize, and integrate the historical data required for model training. Without this foundation, even the best AI models will produce unreliable forecasts.
- Model calibration: AI forecasting models require multiple seasonal cycles to learn patterns, especially for businesses with strong seasonality or promotional cadences. A model trained on one year of data will underperform a model trained on three years.
- Organizational adoption: Planners and decision-makers need time to build trust in AI-generated forecasts. The transition from "AI as a reference" to "AI as the primary forecast" typically takes 12–18 months of parallel running and validation.
- Integration complexity: Connecting AI forecasting outputs to ERP, S&OP, and inventory optimization systems requires IT effort that is often underestimated in initial planning.
| Phase | Typical Investment | Timeline | Expected ROI |
|---|---|---|---|
| Pilot & Learn | $100K–$500K | 0–12 months | Negative to breakeven; learning and data preparation |
| Expand & Optimize | $500K–$2M | 12–24 months | Modest positive ROI; accuracy improvements begin to compound |
| Enterprise Scale | $2M–$10M+ | 24–48 months | Strong positive ROI; inventory and revenue benefits materialize |
| Adaptive Intelligence | $10M+ | 48+ months | Sustained competitive advantage; continuous improvement |
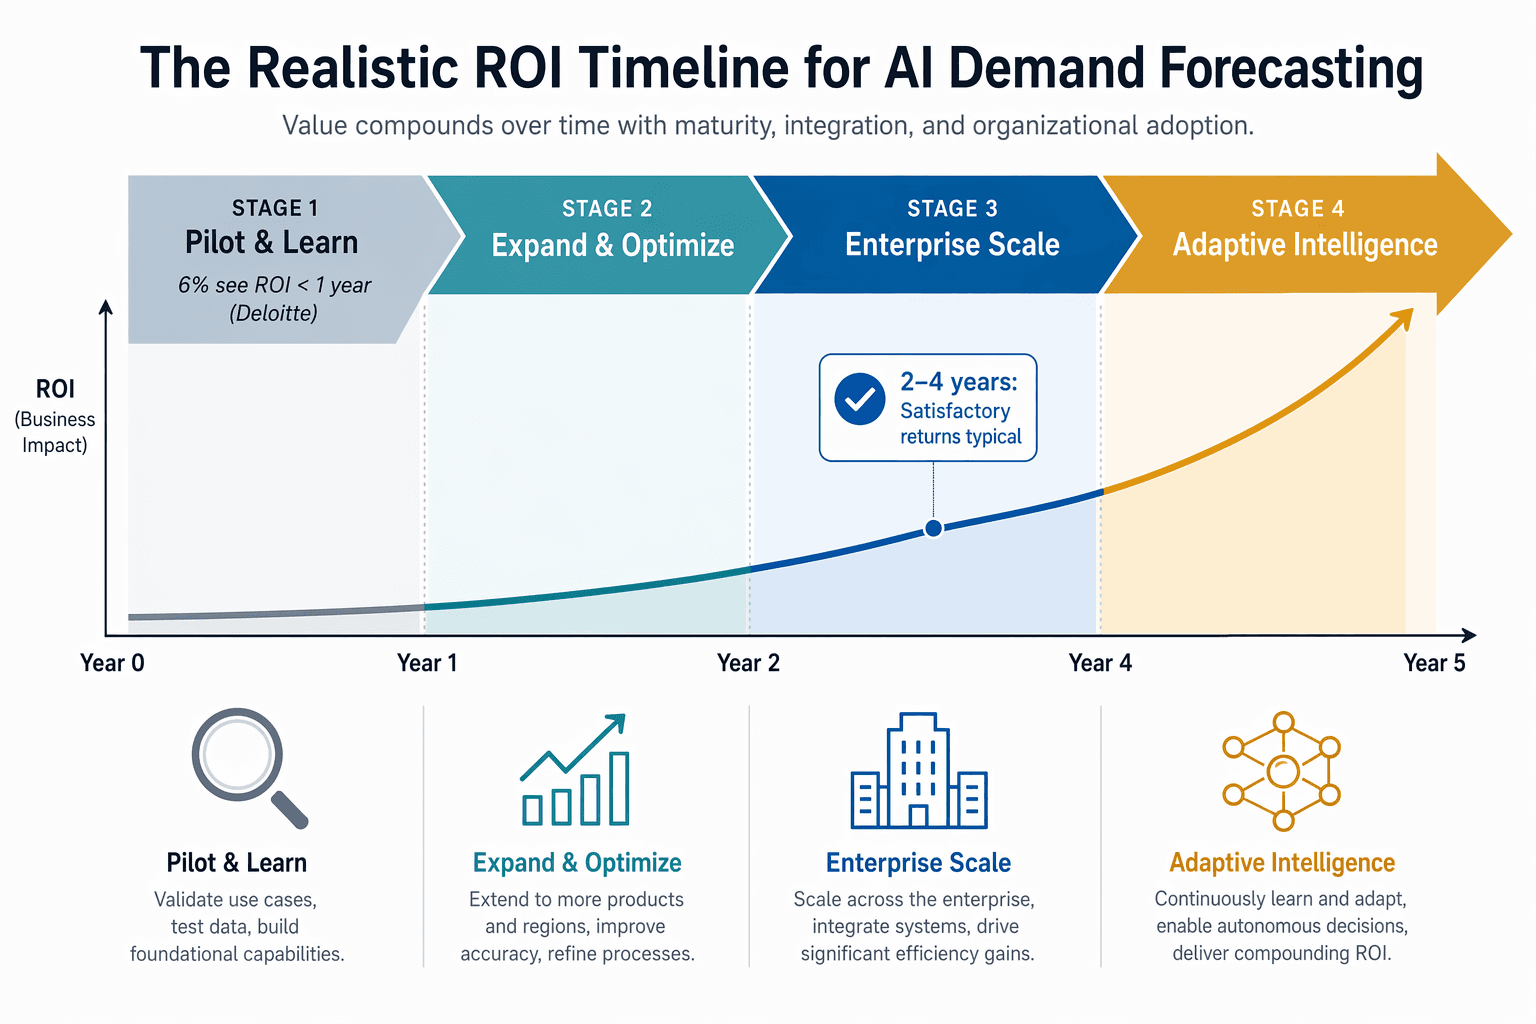
The Adoption Maturity Roadmap: From Pilot to Adaptive Intelligence
Organizations that succeed with AI demand forecasting do not attempt a big-bang deployment. They progress through distinct maturity stages, each with its own investment level, capability set, and expected return profile. Understanding this roadmap is essential for setting realistic expectations with executive stakeholders.
| Stage | Capabilities | Typical Duration | Key Metrics |
|---|---|---|---|
| Pilot & Learn | Single product category or region; parallel run with existing forecast; basic ML model (gradient boosting or LSTM) | 6–12 months | Forecast accuracy vs. baseline; planner trust score; data quality assessment |
| Expand & Optimize | Multiple categories or regions; model ensemble; feature engineering (promotions, weather, economic indicators); initial integration with S&OP | 12–18 months | Inventory reduction %; stockout reduction %; planning cycle time reduction |
| Enterprise Scale | Full product portfolio; probabilistic forecasting; automated model retraining; integration with inventory optimization and procurement systems | 12–24 months | Working capital release; lost sales recovery; procurement spend reduction |
| Adaptive Intelligence | Self-tuning models; real-time demand sensing; autonomous replenishment recommendations; continuous learning from execution feedback | Ongoing | Profitability differential vs. peers; forecast accuracy stability across disruptions |
The Pilot & Learn stage is where most organizations fail — not because the technology does not work, but because they skip the data readiness work and organizational change management required to move to the Expand stage. For a practical, step-by-step guide to progressing through these stages, see our touchless forecasting implementation blueprint, which covers the specific data, technology, and organizational prerequisites for each stage.
Building Your Business Case: Key Metrics and Next Steps
A successful business case for AI demand forecasting must address two audiences simultaneously: the CFO, who needs concrete financial projections with realistic timelines, and the supply chain leadership team, who needs to understand the operational prerequisites and organizational change required.
The following metrics, all sourced from the research cited in this article, form the core of a defensible business case:
- Forecast error reduction: 30–50% (McKinsey); target 10–16% error rate (Intl. Journal on Science & Technology)
- Inventory reduction: 20–30% (McKinsey); validated by Novolex at 16% (IBM)
- Lost sales reduction: up to 65% (McKinsey via ToolsGroup)
- Logistics cost reduction: 5–20% (McKinsey)
- Procurement spend reduction: 5–15% (McKinsey)
- Profitability differential: 23% higher for AI-mature supply chains (Accenture, 1,148 companies)
- ROI timeline: 2–4 years for satisfactory returns (Deloitte); pilot budgets $100K–$500K; enterprise scale $10M+ (GroupBWT)
Before presenting these numbers to your board or investment committee, complete the following readiness checks:
- Data quality audit: Do you have at least 2–3 years of clean, granular historical sales data? Are promotion, pricing, and external factor data available and structured?
- Integration assessment: Can your ERP, S&OP, and inventory systems consume API-based forecast outputs, or will custom middleware be required?
- Organizational readiness: Do your demand planners have the skills and willingness to work with AI-generated forecasts, or will significant change management be needed?
- Vendor evaluation: Have you shortlisted platforms that match your industry, scale, and integration requirements? Our
- vendor comparison matrices can help with this step.
The ROI of AI in demand forecasting is real, measurable, and well-documented. The organizations that capture it will be those that plan for the 2–4 year timeline, invest in data readiness and organizational change, and progress methodically through the adoption maturity stages. The window of competitive advantage is open now — but it will not remain open indefinitely.
Comments
Join the discussion with an anonymous comment.