Supply chain directors and VPs of planning evaluating AI demand planning investments face a persistent problem: the data they need to build a defensible business case is scattered across analyst reports, academic papers, vendor white papers, and press releases. Accuracy benchmarks live in one document, ROI timelines in another, inventory impact figures in a third. The result is a fragmented evidence base that makes it difficult to set realistic expectations with finance stakeholders or to calibrate the timeline for value realization.
This article assembles the full evidence chain — accuracy improvements, inventory and cost impact, ROI timelines, and adoption data — into a single source-attributed narrative. The goal is not to argue that AI demand planning always delivers, but to show what the research actually says, where the numbers come from, and how to use them to build a credible business case.
Accuracy Improvements: What the Research Actually Shows
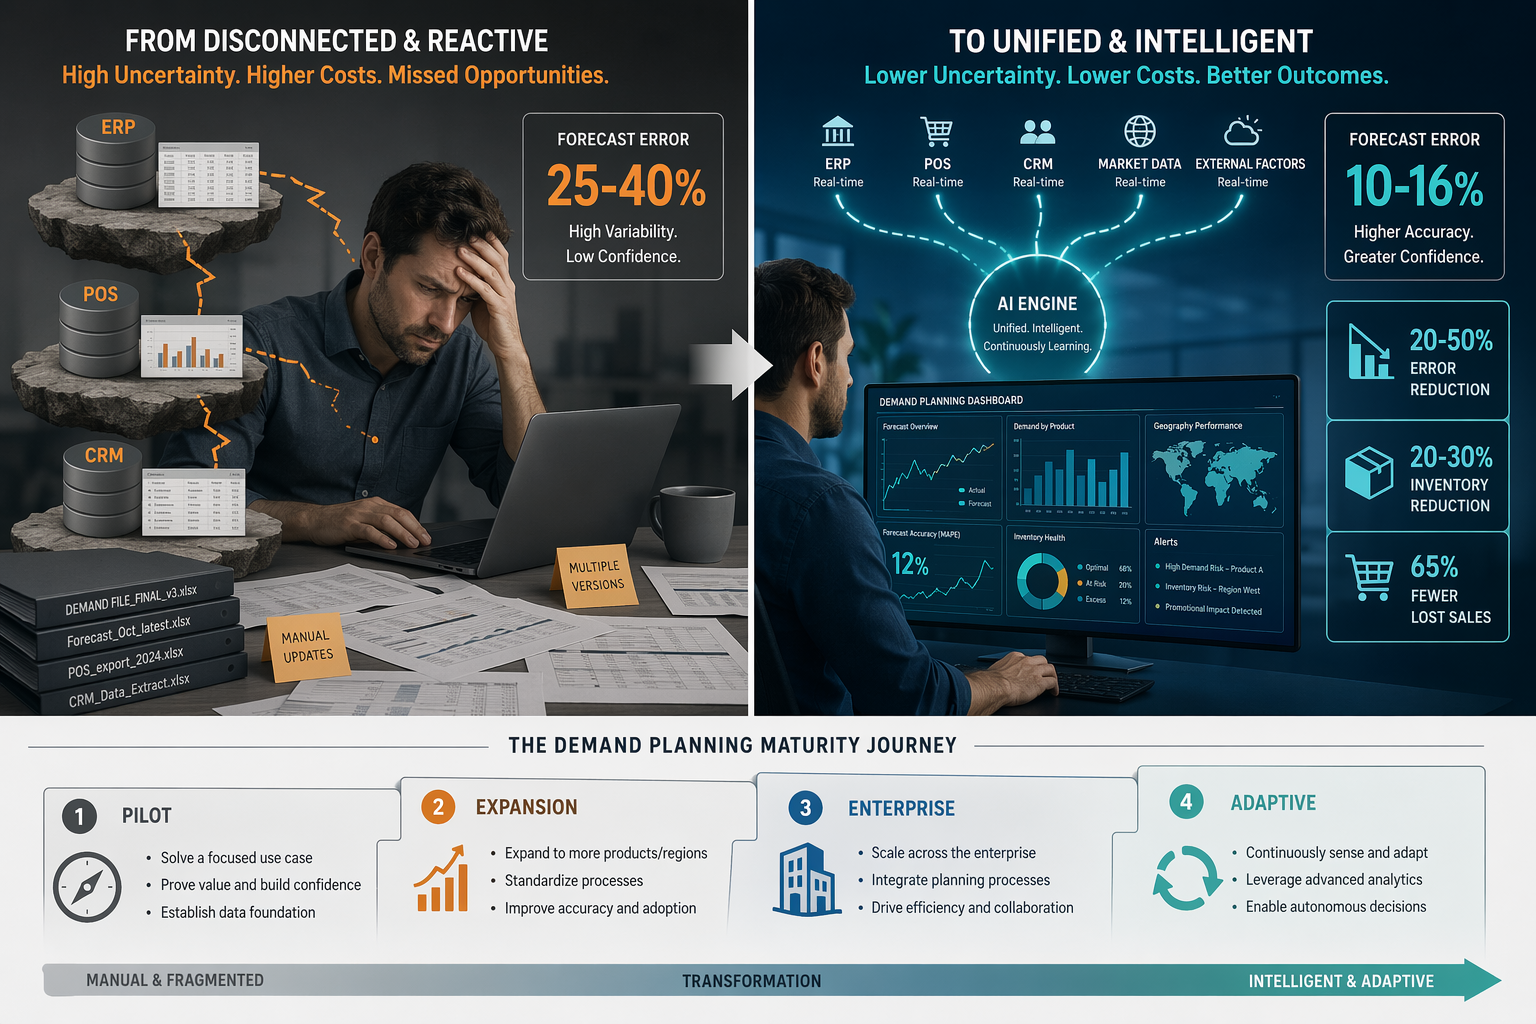
The most frequently cited accuracy claim in the AI demand planning space — that machine learning models reduce forecast error by 20–50% — originates from McKinsey research. The same analysis reports that AI-driven forecasting can reduce lost sales by up to 65%. These figures have been widely referenced across the industry, and they remain the most commonly used benchmark for building a preliminary business case.
More granular academic evidence comes from an IJSAT 2025 study, which documented traditional forecasting methods producing error rates between 25% and 40%, while AI-based approaches reduced those rates to a range of 10% to 16%. That represents a 60% improvement at the high end — consistent with the upper bound of the McKinsey range.
Papers published in WJAETS add further specificity. Their findings show weighted absolute percentage error (WAPE) reductions of 40% to 75% and forecast bias reductions of 30% to 70% when organizations transition from traditional statistical methods to machine learning models. The wide range in these outcomes reflects differences in data quality, product complexity, and the maturity of the implementation — a point we will return to later.
| Source | Metric | Improvement Range | Year |
|---|---|---|---|
| McKinsey | Supply chain forecast error reduction | 20–50% | 2024 |
| McKinsey | Lost sales reduction | Up to 65% | 2024 |
| IJSAT | Forecast error rate (traditional → AI) | 25–40% → 10–16% | 2025 |
| WJAETS | WAPE reduction | 40–75% | 2025 |
| WJAETS | Forecast bias reduction | 30–70% | 2025 |

Inventory and Cost Impact: Beyond Forecast Error
Forecast accuracy improvements are not an end in themselves. Their value lies in the operational and financial outcomes they enable. McKinsey's research quantifies two primary downstream effects: a 20–30% reduction in inventory levels and a 5–20% reduction in logistics costs.
The inventory reduction mechanism is straightforward. More accurate forecasts reduce the uncertainty that drives safety stock calculations. When a demand planning system produces a tighter prediction interval, the statistical safety stock formula — which multiplies demand variability by a z-score based on desired service level — generates a lower buffer. For a company carrying $500 million in inventory, a 20% reduction frees $100 million in working capital.
Logistics cost reductions follow a similar logic. Better demand visibility allows carriers and warehouses to consolidate shipments, reduce expedited freight, and optimize network capacity. The 5–20% range reflects the variance across industries: high-volume, stable-demand categories (e.g., packaged goods) tend toward the lower end, while volatile, seasonal categories (e.g., fashion, electronics) see larger gains.
- Inventory reduction of 20–30% through tighter safety stock requirements
- Logistics cost reduction of 5–20% through improved shipment consolidation and reduced expediting
- Working capital release proportional to total inventory value — material at enterprise scale
- Service level improvements from reduced stockouts, though this metric is less consistently reported
The ROI Timeline Reality: 2–4 Years, Not Months
Vendor case studies frequently highlight rapid ROI — six months, twelve months, sometimes less. The independent research tells a different story. Deloitte's analysis of AI deployments in supply chain found that only 6% of organizations achieve satisfactory ROI within the first 12 months. The majority of organizations realize returns within a 2-to-4-year window.
This timeline is not a failure signal. It reflects the reality that AI demand planning is not a plug-and-play software installation. The first year typically involves data preparation — cleaning historical records, reconciling disparate sources, establishing consistent taxonomies. The second year focuses on model training, validation, and parallel runs alongside existing forecasting processes. Only in year three do most organizations begin to reduce manual intervention and realize the operational efficiencies that drive ROI.
| Phase | Typical Duration | Primary Activities | ROI Realization |
|---|---|---|---|
| Data preparation and integration | 6–12 months | Data cleaning, source reconciliation, taxonomy standardization | None — investment phase |
| Model training and validation | 6–12 months | Parallel runs, accuracy benchmarking, model tuning | Partial — early accuracy gains visible |
| Operational adoption | 6–12 months | Reduced manual intervention, workflow integration | Growing — labor savings and efficiency gains |
| Full optimization | 6–12 months | Continuous learning, automated exception handling | Full — inventory and logistics cost impact realized |

The Adoption Gap: High Intent, Low Strategy
The disconnect between intent and execution in AI demand planning is stark. Gartner projects that 70% of large-scale organizations will adopt AI-based supply chain forecasting by 2030. ABI Research, in a 2025 survey of 490 supply chain professionals across the US, Mexico, Germany, and Malaysia, found that 94% of organizations plan to deploy AI within two years.
Yet Gartner's same research shows that only 23% of supply chain organizations have a formal AI strategy in place. That gap — 94% intent versus 23% strategy — represents both a risk and an opportunity. Organizations that build a strategy now, while the majority are still in the intent phase, have a window to establish data foundations, integration architectures, and change management processes before competitive pressure forces rushed deployments.
For a deeper analysis of why this intent-to-execution gap persists and how to bridge it, see our related article: The Gartner AI Strategy Paradox: 94% Intent, 23% Strategy — Why Supply Chain Leaders Struggle to Operationalize AI.

What Drives ROI Variance: Data Quality, Integration Maturity, and Change Management
The wide ranges in every benchmark cited above — 20–50% error reduction, 20–30% inventory reduction, 2–4 year ROI timelines — are not noise. They reflect three structural factors that consistently separate high-performing AI demand planning deployments from underperformers.
- Data quality and completeness: AI models are only as good as the data they train on. Organizations with fragmented ERP systems, inconsistent product hierarchies, or limited historical data see accuracy gains at the lower end of the range. Those with clean, unified data sources approach the upper bounds.
- ERP and data platform integration maturity: The accuracy of an AI demand forecast depends on its ability to ingest real-time data from sales, inventory, procurement, and logistics systems. Organizations with modern data platforms (Snowflake, Databricks) or well-integrated ERP ecosystems (SAP, Oracle) can achieve faster model convergence and higher accuracy than those relying on manual data extracts.
- Organizational change management: The most technically accurate forecast delivers zero value if planners override it, ignore it, or lack the authority to act on it. Organizations that invest in training, workflow redesign, and governance structures see faster ROI than those that treat AI demand planning as a pure technology deployment.
These three factors explain why two organizations deploying the same AI platform can experience dramatically different outcomes. They also explain why the 2–4 year ROI timeline is not a fixed constraint — organizations that invest upfront in data readiness and change management can compress that timeline significantly.
For a comprehensive analysis of the failure modes that can derail AI demand forecasting deployments, see our companion article: AI Demand Forecasting Implementation: The Risks Vendors Don't Emphasize.
Building Your Business Case: A Calibrated Expectations Framework
The evidence assembled above supports a calibrated, phase-based approach to building an AI demand planning business case. Rather than promising a single ROI number or a fixed timeline, organizations should present a phased framework that aligns investment stages with expected outcomes and organizational prerequisites.
| Phase | Typical Timeline | Expected Accuracy Improvement | Inventory Impact | Organizational Prerequisites |
|---|---|---|---|---|
| Pilot | 6–12 months | 10–20% error reduction | Minimal — single category or region | Clean data for one product group; executive sponsor; dedicated data engineer |
| Expansion | 12–24 months | 20–35% error reduction | 5–10% inventory reduction in pilot categories | Data platform integration; cross-functional planning team; basic change management |
| Enterprise | 24–36 months | 35–50% error reduction | 15–25% inventory reduction across portfolio | Unified data architecture; full ERP integration; dedicated AI operations team |
| Adaptive | 36–48 months | 40–50%+ error reduction with continuous learning | 20–30% inventory reduction; logistics cost reduction | Automated model retraining; exception-based planning; organizational trust in AI outputs |
This framework serves two purposes. First, it gives finance stakeholders a realistic view of when capital will be deployed and when returns will materialize. Second, it creates a governance structure that ties investment approval to demonstrated progress — no organization should commit to enterprise-wide deployment before validating accuracy gains in a pilot.
For readers who need broader ROI context across procurement and supply chain functions beyond demand planning, see our related analysis: From Pilot to Profit: The Real ROI of AI in Procurement and Supply Chain.
Comments
Join the discussion with an anonymous comment.