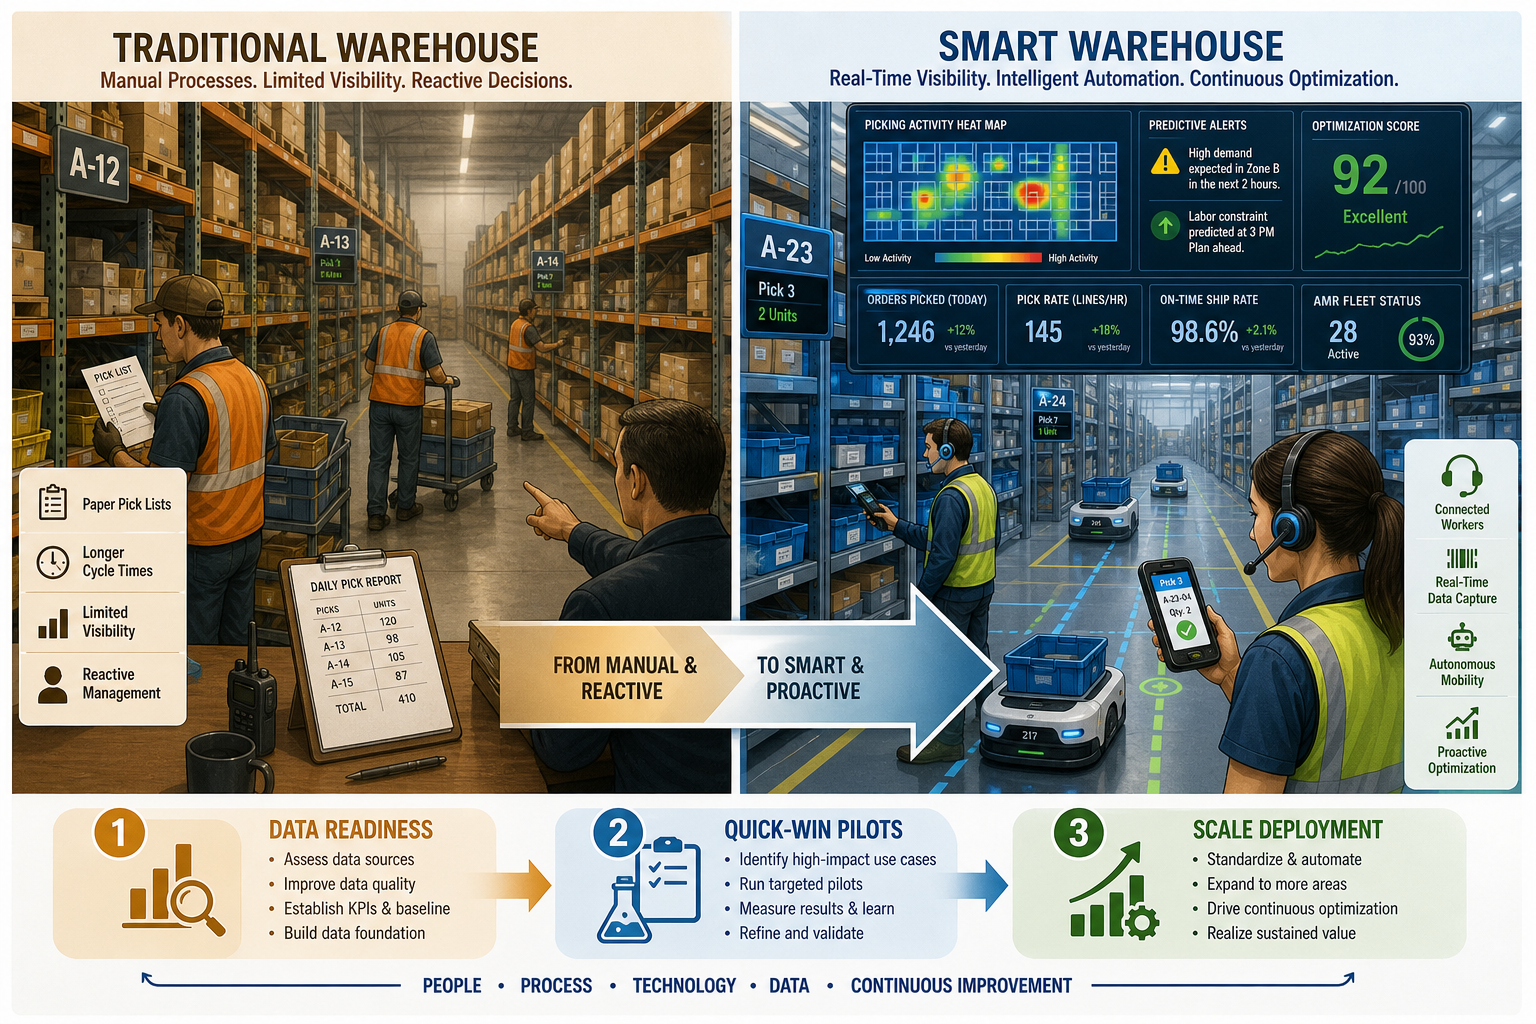
The ML-in-Warehouse Imperative: Closing the 94%–23% Execution Gap
The numbers are hard to reconcile. According to an ABI Research survey of 490 supply chain professionals, 94% of companies plan to deploy AI or generative AI for decision support within two years. Yet a separate Gartner survey of 120 supply chain leaders who have already deployed AI found that only 23% have a formal AI strategy. That 71-point gap between intent and structured execution is the central problem this guide addresses.
The cost of inaction is measurable. Accenture's analysis of 1,148 companies across 10 industries in 15 countries found that organizations with AI-mature supply chains are 23% more profitable than their peers and six times as likely to use AI widely. McKinsey estimates that AI-enabled distribution operations deliver a 5–20% reduction in logistics costs and a 20–30% reduction in inventory. These are not speculative futures — they are outcomes already being realized by the minority of companies that have moved past the planning stage.
This guide is not a generic five-step process. It is a phased implementation roadmap built around the execution gap, designed for supply chain directors, VPs of operations, and warehouse managers who need to convert intent into operational reality. Each phase addresses a specific barrier — data readiness, organizational momentum, core deployment, and advanced orchestration — with concrete timelines, investment ranges, and risk-mitigation tactics drawn from published benchmarks and documented deployments.
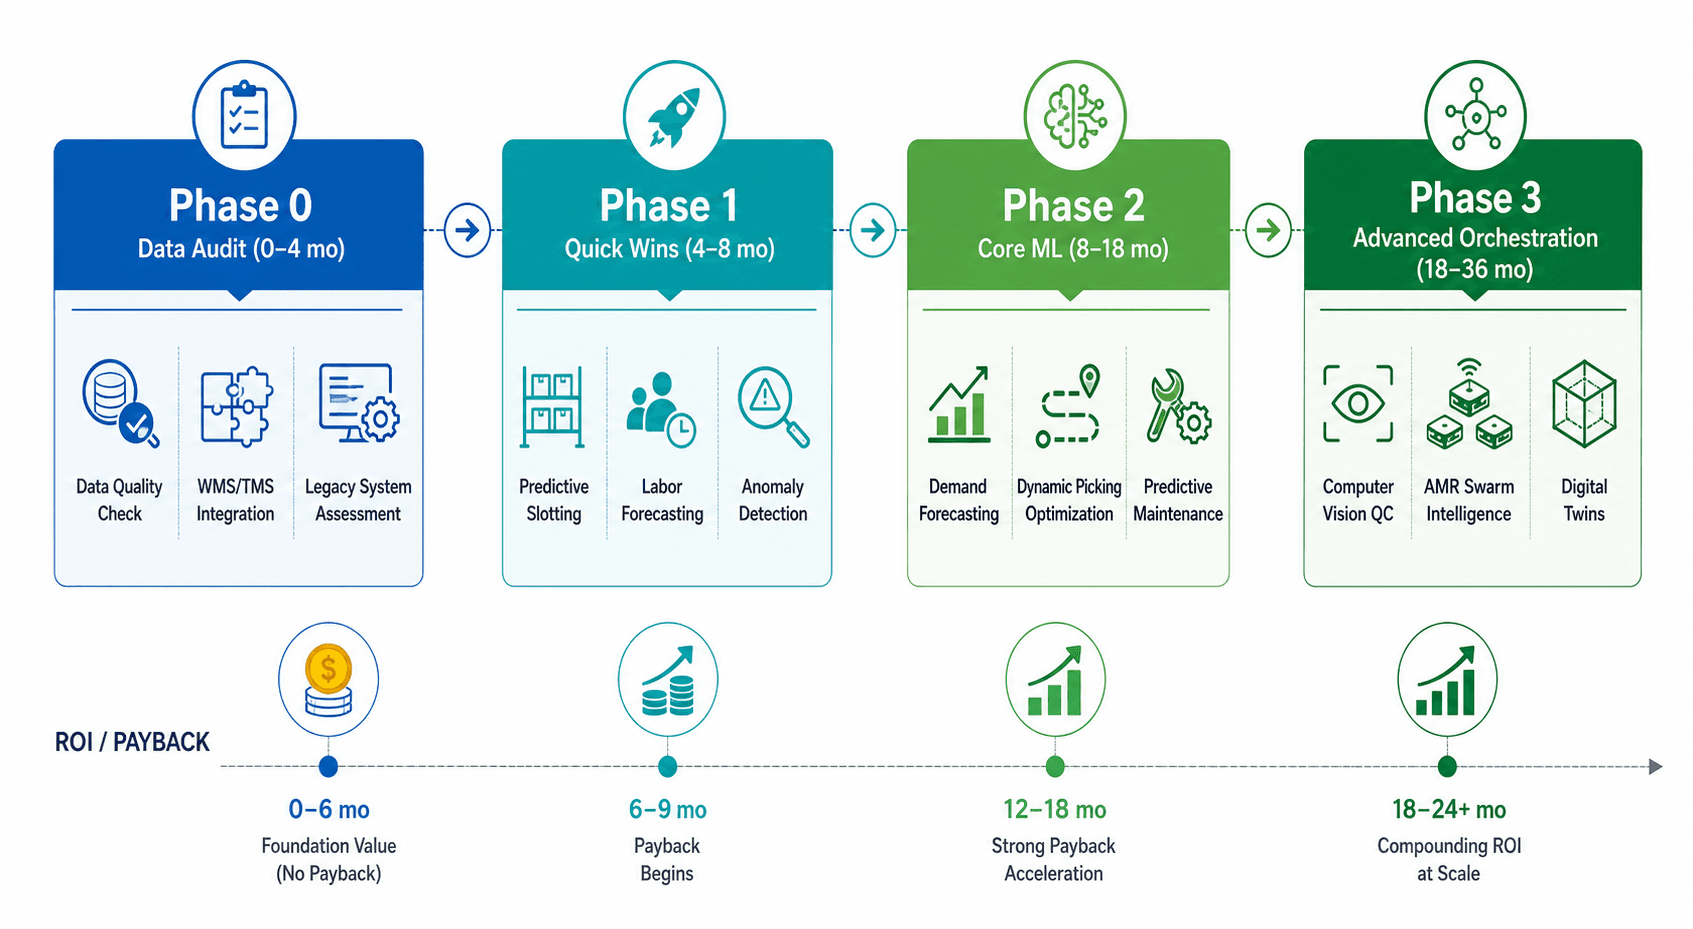
Phase 0: Data Infrastructure Audit and WMS/TMS Integration
Every implementation guide mentions data quality. Few treat it as the make-or-break prerequisite it actually is. KNAPP, the Austrian warehouse automation and logistics company, stated plainly in its 2026 trends analysis that "only consistent master and transaction data allows AI to reach its full potential" and that "data quality becomes an essential factor for improvement" in 2026. This is not a nice-to-have — it is the single most common reason ML projects stall or fail.
The data readiness audit should cover four dimensions:
- WMS/TMS data quality: Are item master records complete and standardized? Are inventory transaction logs accurate and time-stamped? Do pick, pack, and ship records contain the granularity needed for ML training — for example, individual picker travel times rather than shift-level averages?
- Integration points: Which systems hold the data your ML models will consume — WMS, TMS, ERP, labor management systems, conveyor control systems? Map the data flows and identify whether existing APIs support the required throughput.
- Batch vs. real-time pipeline needs: Not every use case requires sub-second data. Predictive maintenance on conveyor motors can operate on hourly batches. Dynamic picking optimization, by contrast, needs near-real-time order and location data. Assess each use case's latency requirements before designing the pipeline.
- Historical data depth: Most supervised ML models require at least 12–24 months of historical data to produce reliable predictions. If your warehouse operations data only goes back six months, plan for a data accumulation period before model training can begin.
The cost of this phase is not trivial. The Thinking Company estimates that data integration with legacy TMS/WMS systems consumes 30–40% of total AI project cost. For a mid-market warehouse operation spending EUR 500,000 on an ML initiative, that means EUR 150,000–200,000 allocated to data plumbing before a single model is trained.
For a practical assessment tool, refer to the CSCO's Data Readiness Checklist for Supply Chain AI Implementation on ChainSignal, which provides a line-item audit framework. For organizations still running batch-oriented data pipelines, the guide on closing the batch-to-real-time pipeline gap covers the architectural transition in detail.
Phase 1: Quick-Win Pilots for Organizational Momentum
Phase 1 is about building credibility. The goal is not to maximize ROI in the first six months — it is to demonstrate that ML works in your specific operational context, with your data, and that the organization can absorb the change. Choose use cases that are high-impact, low-complexity, and visible to both warehouse floor staff and executive stakeholders.
Three use cases consistently meet these criteria:
| Use Case | Typical Investment (EUR) | Annual Savings (EUR) | Payback Period | 3-Year ROI Range |
|---|---|---|---|---|
| Predictive slotting (AI-directed picking) | 50,000–100,000 | 200,000–500,000 | 4–8 months | 250–400% |
| Labor forecasting / workload balancing | 40,000–80,000 | 100,000–250,000 | 5–10 months | 150–250% |
| Anomaly detection (inventory discrepancies, order exceptions) | 40,000–80,000 | 100,000–250,000 | 5–10 months | 150–250% |
Predictive slotting deserves special attention. Multiple sources report that picker travel accounts for up to 55% of operating costs and over 50% of picking time is spent traveling between locations. ML-driven slotting — which analyzes order patterns, item velocity, and correlation to dynamically assign storage locations — can reduce picker travel distance by 30–40%. This is not a theoretical improvement; it is documented across multiple warehouse deployments and is one of the fastest-payback ML applications in the warehouse.
Pilot design principles for Phase 1:
- Bound the scope to a single warehouse zone, shift, or product category. Do not attempt to cover the entire facility.
- Define success metrics before deployment — picker travel time reduction, error rate change, or labor hour variance — and establish a baseline measurement period of at least four weeks.
- Integrate change management from day one. Involve shift supervisors and experienced pickers in the pilot design. Their operational knowledge will surface edge cases that the ML model cannot learn from historical data alone.
- Plan for a 4–8 month pilot-to-decision timeline. If the pilot has not demonstrated clear value within eight months, the use case, the data, or the organizational readiness likely needs re-evaluation.
Phase 2: Core ML Deployment — Demand Forecasting, Dynamic Picking, and Predictive Maintenance
Months 8 through 18 represent the scale-up phase. The quick-win pilots have established organizational confidence, the data pipeline is operational, and the team has experience with model training, validation, and deployment. Phase 2 moves ML from a pilot project to an embedded operational capability.
Three core use cases anchor this phase:
| Use Case | Operational Impact | Key Data Requirements | Typical Timeline to Value |
|---|---|---|---|
| Demand forecasting for inventory positioning | 20–30% inventory reduction (McKinsey 2024); improved service levels | 12–24 months of historical order data, promotional calendar, external demand signals | 4–6 months from model training to stable predictions |
| Dynamic picking optimization | 5–20% logistics cost reduction (McKinsey 2024); 30–40% travel reduction | Real-time order stream, item location data, picker performance history, order wave plan | 2–4 months from integration to measurable improvement |
| Predictive maintenance for material handling equipment | Reduced unplanned downtime; extended equipment life; lower maintenance spend | Sensor data from conveyors, sorters, and AS/RS; maintenance logs; equipment age and model data | 3–6 months to train failure prediction models |
Demand forecasting at the warehouse level differs from enterprise-level demand planning. Warehouse-level forecasting must account for local inventory positions, inbound shipment variability, and order profiles that may not match national or regional demand patterns. ML models trained on warehouse-specific data can predict order volumes at the SKU-location-day level, enabling proactive inventory positioning that reduces both stockouts and excess carrying costs.
Dynamic picking optimization goes beyond the slotting improvements of Phase 1. Where Phase 1 optimized where items are stored, Phase 2 optimizes how and when they are picked — dynamically assigning orders to pickers based on real-time location, order priority, picker skill level, and equipment availability. This is where ML begins to function as an operational co-pilot within the WMS, continuously adjusting assignments rather than following static rules.
A critical but often overlooked cost in Phase 2 is workforce transition. The Thinking Company estimates EUR 500–1,500 per affected worker for retraining, process redesign, and productivity dips during the transition period. For a warehouse with 200 pickers, that is EUR 100,000–300,000 in transition costs that must be budgeted alongside the technology investment.
Phase 3: Advanced Orchestration — Computer Vision, AMR Swarm Intelligence, and Digital Twins
Months 18 through 36 represent the advanced stage where multiple ML systems begin to interoperate. This is not a single deployment but an orchestration challenge: predictive models, computer vision systems, autonomous mobile robot (AMR) fleets, and digital twin simulations must share data and coordinate decisions in real time.
Three technology areas define this phase:
- Computer vision for zero-touch quality control: Cameras at goods-in and returns processing points can inspect items for damage, verify SKU accuracy, and flag discrepancies without human intervention. KNAPP identifies this as a key 2026 trend, noting that computer vision systems can handle the high variability of returned goods — a task that has historically required manual inspection. Vendor-published data from OPEX (cited by Synkrato) claims automated picking systems reduce error rates from approximately 4% manual to 0.04% or lower, representing 99.96% accuracy.
- Swarm intelligence for AMR fleet deployment: Rather than programming individual robot paths, swarm intelligence algorithms coordinate the entire fleet — preventing traffic congestion, learning from bottleneck patterns, and dynamically reassigning robots as order profiles change. KNAPP emphasizes that interoperability between AMR fleets from different vendors is a prerequisite for this capability.
- Digital twins for what-if scenario simulation: A digital twin — a real-time virtual replica of the warehouse — allows operations teams to simulate the impact of changes before implementing them. What happens to throughput if we add a third shift? How does a 20% order volume spike affect picker utilization? Digital twins answer these questions without disrupting live operations.
The portfolio ROI effect becomes significant in Phase 3. The Thinking Company reports that when multiple use cases share a common data infrastructure, the combined portfolio ROI is typically 40–60% higher than the sum of individual use case ROIs. A demand forecasting model and a dynamic picking optimization model that draw from the same data pipeline, for example, produce compounding benefits that neither could achieve in isolation.
Measuring and Compounding ROI Across the Roadmap
ROI measurement in ML warehouse projects is not a single calculation performed at the end of deployment. It is a continuous process that must adapt as the scope and maturity of ML capabilities expand. Deloitte's 2025 survey found that while 85% of organizations increased AI investment in the past year, only 6% saw ROI in under 12 months; most achieve satisfactory ROI within 2–4 years. This timeline aligns with the phased roadmap: Phase 1 pilots should show positive returns within 4–12 months, while the full portfolio of Phase 2 and Phase 3 capabilities compounds over the 2–4 year horizon.
Representative ROI ranges by use case category, based on The Thinking Company's European-market analysis:
| Use Case Category | Typical Investment (EUR) | Annual Savings / Value Created (EUR) | Payback Period | 3-Year ROI |
|---|---|---|---|---|
| Route optimization (500-vehicle fleet) | 80,000–150,000 | 1,500,000–3,000,000 | 2–4 months | 800–1,200% |
| AI-directed picking / warehouse automation | 50,000–100,000 | 200,000–500,000 | 4–8 months | 250–400% |
| Computer vision sorting | 100,000–200,000 | 300,000–700,000 | 6–12 months | 200–350% |
| Demand sensing / inventory positioning | 60,000–120,000 | 200,000–500,000 | 5–9 months | 200–350% |
| Labor forecasting / workload balancing | 40,000–80,000 | 100,000–250,000 | 5–10 months | 150–250% |
The portfolio business case approach — where multiple use cases are funded as a single program rather than individually — is the recommended framework for Phase 2 and Phase 3. It accounts for shared data infrastructure costs, avoids double-counting savings, and captures the 40–60% portfolio uplift that comes from integrated ML capabilities.
For a detailed cost-modeling framework, including labor cost assumptions, depreciation schedules, and risk-adjusted payback calculations, see the business case guide for AI in warehouse management on ChainSignal.
Common Failure Modes and How to Avoid Them
Every ML warehouse implementation encounters obstacles. The difference between a stalled project and a successful one is not the absence of problems but the presence of planned mitigations. Based on documented deployment patterns and the experience of practitioners, five failure modes recur with enough frequency to warrant specific attention.
- Underestimating data integration costs: As noted in Phase 0, data integration with legacy WMS/TMS systems consumes 30–40% of total project cost. Organizations that budget only for model development and deployment — treating data plumbing as an afterthought — run out of budget before the first model is trained. Mitigation: Complete the data readiness audit before committing to a vendor or a timeline. Build a data infrastructure budget that is separate from the ML software budget.
- Projecting full-fleet savings from single-region pilots: A pilot that achieves 30% travel reduction in one zone of one warehouse does not guarantee 30% reduction across the entire network. Warehouse layouts, product mixes, order profiles, and workforce demographics vary. Mitigation: Run pilots in at least two facilities with different operational characteristics before extrapolating network-wide ROI.
- Omitting workforce transition costs: The EUR 500–1,500 per affected worker estimate covers retraining, process redesign, and productivity dips. Organizations that ignore this line item face budget overruns and workforce resistance when the transition begins. Mitigation: Include a workforce transition line item in the business case. Budget for a dedicated change management resource during Phase 1 and Phase 2.
- Black-box AI trust issues: Warehouse operators and shift supervisors will not trust recommendations they cannot understand. If an ML model recommends moving 200 SKUs to new locations, the operations team needs to know why — and needs a way to challenge the recommendation. Mitigation: Prioritize vendors that offer explainability features — feature importance scores, counterfactual explanations, or rule extraction. Establish a human-in-the-loop review process for model outputs that affect worker assignments or inventory decisions.
- Change management resistance: The most technically successful ML deployment will fail if the workforce does not adopt it. This is not a training problem — it is a trust and incentive problem. Mitigation: Involve warehouse supervisors in the pilot design phase. Tie a portion of shift supervisor bonuses to adoption metrics, not just operational outcomes. Celebrate early wins publicly and attribute them to the combination of ML tools and operator expertise.
For a deeper treatment of hidden costs and contract pitfalls, see the failure modes and hidden costs analysis on ChainSignal, which covers vendor contract terms, data ownership clauses, and exit strategy planning in detail.

Vendor Evaluation Framework for Warehouse ML Platforms
Vendor selection should be phase-aware. A vendor that excels at quick-win pilots — with pre-built models for slotting and labor forecasting, rapid deployment templates, and low data requirements — may not be the right partner for Phase 3 advanced orchestration involving computer vision, AMR swarm intelligence, and digital twins. Conversely, a platform designed for enterprise-scale orchestration may be overkill — and overpriced — for a Phase 1 pilot.
The following evaluation criteria apply across all phases:
| Evaluation Criterion | What to Look For | Why It Matters |
|---|---|---|
| Security certifications | SOC 2 Type II, ISO 27001, or equivalent | Warehouse data — inventory levels, customer orders, labor records — is commercially sensitive. Certifications demonstrate baseline security practices. |
| AI transparency / explainability | Feature importance scores, counterfactual explanations, model cards | Operations teams need to understand and trust model recommendations. Black-box models create adoption resistance. |
| WMS/TMS integration capabilities | Pre-built connectors for your WMS platform; documented API throughput limits | Integration cost consumes 30–40% of total project budget. Pre-built connectors reduce this cost and accelerate timelines. |
| Implementation timeline expectations | Phase 1 pilot in 4–8 weeks; Phase 2 scale-up in 4–6 months per use case | Vendors that promise full deployment in under 60 days are likely underestimating data integration complexity. |
| Total cost of ownership modeling | Software licensing + data infrastructure + workforce transition + ongoing model maintenance | Many organizations only budget for software licensing. A complete TCO model prevents budget overruns in Phase 2 and Phase 3. |
| Model governance and monitoring | Model drift detection, automated retraining pipelines, audit logging | ML models degrade over time as operational patterns change. Without monitoring, prediction accuracy erodes silently. |
A practical approach: shortlist vendors based on Phase 1 requirements, but include a contractual option to expand to Phase 2 and Phase 3 capabilities without re-procurement. This avoids the common trap of selecting a pilot-phase vendor that cannot scale, while also avoiding the opposite trap of selecting an enterprise platform that is too complex and expensive for the initial deployment.
The organizational readiness dimension — covered in the AI readiness paradox analysis on ChainSignal — is as important as the technical evaluation. A vendor with the best technology will fail if the organization lacks the data culture, executive sponsorship, or change management capacity to absorb it.
Comments
Join the discussion with an anonymous comment.