
The Three Archetypes of AI Logistics Companies
The AI logistics market has matured past the point where a single label — "AI logistics company" — tells a buyer anything useful. A 2025 survey of 490 supply chain professionals by ABI Research found that 64% of leaders now rate AI capabilities as important or very important when evaluating new technology solutions. Yet the vendors behind those capabilities differ fundamentally in architecture, data requirements, and deployment risk.
Our research identifies three distinct archetypes operating in the market today:
- AI-native startups — companies built from the ground up on modern data architectures, typically offering a single, deeply focused capability (real-time visibility, autonomous warehousing, digital freight matching). Examples include FourKites, Project44, Nimble, and Altana.
- Embedded-AI incumbents — established TMS, WMS, and supply chain planning platforms that have layered AI/ML capabilities onto existing enterprise software. Blue Yonder, Oracle SCM, Manhattan Associates, and Kinaxis fall into this category.
- Custom AI builders — consultative firms and solution integrators that build tailored AI applications on top of client data and infrastructure. RTS Labs and Unframe are representative players in this segment.
The core thesis is straightforward: buyers who align the vendor archetype to their organization's data readiness and operational maturity achieve deployment success at rates 2–3x higher than those who select based on feature checklists alone. An AI-native visibility platform like Project44, which ingests API-ready carrier data, will struggle inside a company whose freight data lives in spreadsheets and email attachments. Conversely, a custom builder like RTS Labs may be overkill for a company with clean, structured data and a well-defined single use case.
The table below summarizes the key differentiators across the three archetypes:
| Dimension | AI-Native Startups | Embedded-AI Incumbents | Custom AI Builders |
|---|---|---|---|
| Core architecture | Cloud-native, API-first, built for data ingestion at scale | AI layer on top of legacy TMS/WMS/ERP monoliths | Tailored stack built on client infrastructure |
| Time to value | Weeks to months (pre-built integrations) | Months to quarters (requires module activation) | Quarters to years (discovery + build + deploy) |
| Integration burden | Low to moderate (API connectors) | Moderate to high (legacy system dependencies) | High (custom ETL, data normalization) |
| Best suited for | Companies with modern API-ready systems and a focused use case | Enterprises with existing TMS/WMS investments seeking incremental AI | Organizations with unique workflows or poor data readiness needing full rebuild |
| Typical contract | SaaS subscription, usage-based pricing | Enterprise license + professional services | Project-based SOW + ongoing managed services |
For a deeper technical comparison of AI-native versus legacy platform architectures, see our dedicated analysis: AI-Native vs. Legacy Supply Chain Platforms: The Real Performance Gap in 2026.
Evaluation Criteria by Logistics Function
Once you have identified which archetype fits your organizational profile, the next step is evaluating vendors against function-specific criteria. A route optimization vendor and a warehouse automation vendor serve different operational needs and demand different evaluation lenses.
The table below maps the primary logistics functions to the evaluation dimensions that matter most for each:
| Logistics Function | Key Capabilities to Evaluate | Typical Deployment Model | Primary Metrics |
|---|---|---|---|
| Route optimization | Real-time traffic integration, multi-stop sequencing, constraint handling (driver hours, vehicle capacity) | Cloud SaaS, API integration with TMS | Miles driven, fuel cost, on-time delivery %, empty miles ratio |
| Warehouse automation | Pick/pack optimization, slotting algorithms, robotic integration, labor forecasting | On-premise or hybrid (latency-sensitive) | Throughput per hour, labor cost per order, error rate, space utilization |
| Demand forecasting | Probabilistic vs. point forecasts, seasonality handling, promotion modeling, external data ingestion | Cloud SaaS, data lake integration | Forecast accuracy (MAPE/WAPE), inventory turns, stockout rate |
| Real-time visibility | Carrier API coverage, ETA accuracy, exception detection, multi-modal tracking | Cloud SaaS, carrier network integration | Tracking coverage %, ETA deviation, alert latency |
| Supplier risk scoring | Data source breadth (financial, geopolitical, weather), update frequency, explainability of scores | Cloud SaaS, API feeds | Risk detection lead time, false positive rate, coverage breadth |
| Document processing | OCR accuracy, document type coverage (BOL, invoice, customs), integration with ERP/accounting | Cloud SaaS, API or SFTP | Processing time per document, error rate, exception handling rate |
For detailed ROI benchmarks across each of these functions — including the specific percentage improvements documented in real deployments — refer to our comprehensive guide: AI Use Cases in Supply Chain by Function: Where the ROI Is Real in 2026.
What to Look for in Route Optimization Vendors
Route optimization is the most mature AI logistics use case, with documented payback periods as short as 2–4 months and 3-year ROI ranging from 800% to 1,200% for fleets of 500+ vehicles, according to data aggregated by Thinking Inc from the Gartner Supply Chain Technology Report 2025. When evaluating route optimization vendors, pay particular attention to:
- Constraint modeling sophistication — can the system handle driver hours-of-service rules, vehicle weight limits, time windows, and dynamic re-routing simultaneously?
- Real-time data ingestion — does the platform consume live traffic, weather, and road closure data, or does it rely on static historical patterns?
- Integration depth with existing TMS — can the AI layer read and write routes directly into your transportation management system, or does it require manual export/import?
For a step-by-step evaluation framework specific to route optimization, including trial design and POC criteria, see our AI Route Optimization Buyer's Guide for Supply Chain Leaders.
Data Readiness: The Prerequisite Most Buyers Skip

The single most common reason AI logistics projects underperform or fail is not the algorithm — it is the data feeding it. A 2026 survey of over 800 freight forwarding and logistics professionals by Trax Technologies found that only 23% of companies maintain data quality sufficient for AI applications, defined as 75–100% of data meeting quality standards. The same survey found that over 70% of logistics professionals spend at least 25% of their time on manual data tasks — document chasing, email coordination, spreadsheet reconciliation — that AI could automate.
This data quality gap has direct consequences for vendor selection. An AI-native platform that requires clean, structured, API-accessible data will deliver poor results — or fail to deploy at all — in an organization where shipment data lives in PDF invoices and email attachments. Conversely, a custom AI builder can work with messy data, but the cost and timeline of data normalization will dominate the project budget.
Data Readiness Self-Assessment
Before engaging vendors, conduct an honest assessment of your organization's data readiness across five dimensions:
- Data completeness — what percentage of your shipments have complete, machine-readable records (origin, destination, mode, carrier, rate, actual transit time)? If the answer is below 80%, your data foundation needs work before AI can add value.
- Data accessibility — can your data be accessed via API, or does it require manual extraction from PDFs, emails, or legacy system exports? API-accessible data reduces integration costs by 40–60% according to Thinking Inc.
- Data standardization — are your location names, carrier codes, and product identifiers consistent across systems? Inconsistent data is the most common cause of AI model failure in logistics.
- Data timeliness — how quickly does your operational data become available for analysis? Real-time or near-real-time data enables different AI use cases than batch-processed data.
- Data governance — who owns data quality, and what processes are in place to maintain it? Organizations with a formal data governance function are significantly more likely to succeed with AI.
If your self-assessment reveals significant gaps, consider starting with a custom AI builder or a phased approach rather than a full-platform deployment. For a structured framework to assess and improve your organizational maturity before selecting a vendor, see our AI Maturity Roadmap for Supply Chain Leaders.
The broader lesson is that data readiness is not a technical detail to be handled after vendor selection — it is the primary determinant of which vendor archetype is appropriate for your organization. For a deeper analysis of why data and execution gaps cause most AI supply chain projects to fail, read Why Most AI Supply Chain Projects Fail — And How to Build One That Scales.
Total Cost of Ownership: Off-the-Shelf vs. Custom AI
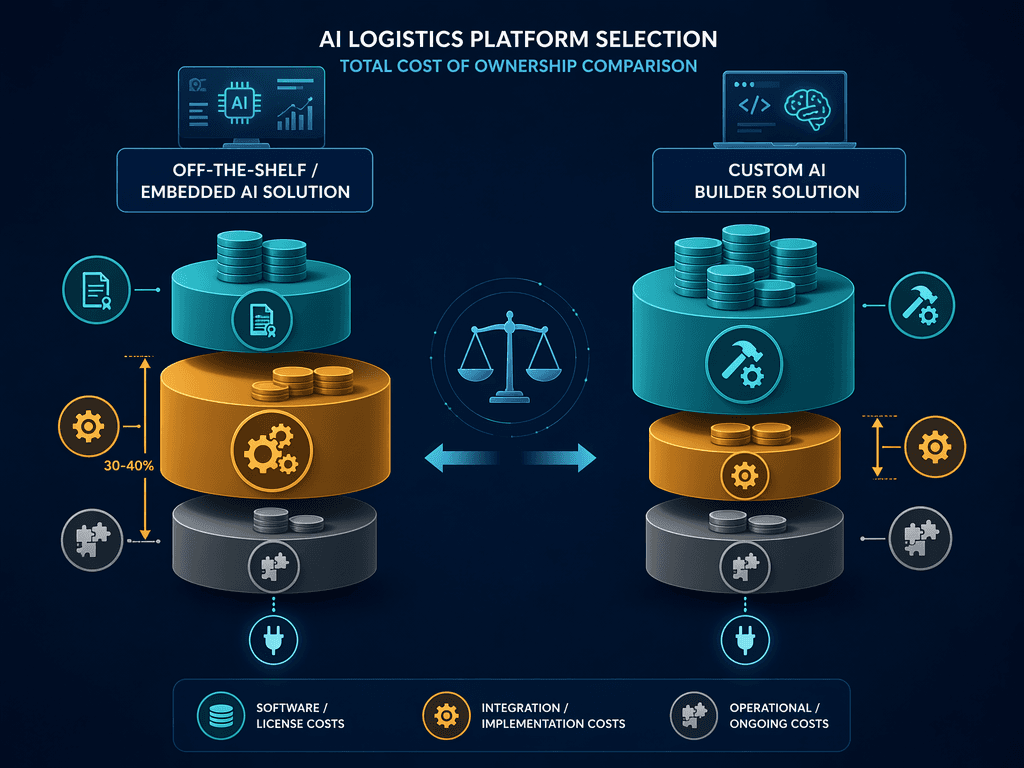
Total cost of ownership (TCO) for AI logistics solutions varies dramatically across the three archetypes, and the largest cost component is often not the software license or the build effort — it is the integration with existing systems. According to Thinking Inc's 2026 analysis, integration with legacy TMS/WMS systems typically consumes 30–40% of total project cost. Organizations with modern API-ready systems reach payback 40–60% faster than those with legacy infrastructure.
The table below provides a representative TCO comparison across the three archetypes for a mid-market logistics operation (500–2,000 shipments per day):
| Cost Component | AI-Native Startup | Embedded-AI Incumbent | Custom AI Builder |
|---|---|---|---|
| Annual software / license fee | $50K – $200K (SaaS) | $100K – $500K (enterprise license) | $0 – $50K (infrastructure only) |
| Integration & deployment (one-time) | $50K – $150K | $150K – $400K (30-40% of total) | $200K – $600K (discovery + build) |
| Data normalization & cleanup | $20K – $80K | $30K – $100K | $50K – $200K (often largest line item) |
| Change management & training | $20K – $50K | $30K – $80K | $40K – $100K |
| Year 1 total estimate | $140K – $480K | $310K – $1.08M | $290K – $950K |
| Typical payback period | 4–8 months | 8–18 months | 12–24 months |
Several important nuances emerge from this comparison:
- Route optimization pilots from single regions understate true deployment ROI. Thinking Inc notes that cross-region scaling typically achieves 70–80% of pilot results, meaning a pilot that shows 15% cost reduction may yield only 10–12% when rolled out across the full network.
- The margin impact of even small cost reductions is amplified in logistics. A 2–3% total cost reduction through AI translates to 30–75% margin improvement for the average mid-market 3PL operating on 4–7% net margins, per the European Logistics Association (2025).
- Organizations with modern, API-ready systems should prioritize AI-native startups for speed to value. Organizations with significant legacy infrastructure may find that custom builders or embedded-AI incumbents offer a more realistic path, even if the upfront cost is higher.
Real-World Deployment Benchmarks
The following case studies illustrate how each archetype performs in production environments. All outcomes are attributed to named sources with dates and scope notes.
AI-Native: Uber Freight — Algorithmic Route Optimization
Uber Freight, an AI-native digital freight marketplace, uses machine learning for algorithmic carrier pricing and route optimization. According to MIT's Chris Caplice and Uber Freight CEO Lior Ron, trucks in the U.S. run approximately 30% empty on average. Uber Freight's algorithmic route design reduced empty miles to 10–15% — a 50–67% improvement over the industry baseline. The system combines AI with operations research techniques, and MIT notes that the AI models systematically outperform training data on new, unseen routing problems.
Embedded-AI Incumbent: DHL — Agentic AI for Network Optimization
DHL has deployed agentic AI capabilities within its existing logistics network, achieving over 600 hours saved daily across its operations, according to reporting cited in the AIMultiple catalog. The deployment leverages AI agents to automate warehouse workflows, route exceptions, and customer communication. For a detailed analysis of DHL's deployment conditions, architecture, and measured outcomes, see our dedicated case study: DHL AI Logistics Network Optimization: Deployment Case Study.
Custom AI Builder: RTS Labs — Freight Matching Engine
A top-50 U.S. freight broker deployed a custom AI-powered freight matching engine built by RTS Labs. According to RTS Labs' 2026 case study, the broker achieved 18% revenue growth, 31% fewer empty miles, and a reduction in match time from 47 minutes to 4 minutes. This case illustrates the custom builder archetype's strength: the ability to work with the broker's specific data environment and operational workflows, producing outcomes that off-the-shelf platforms could not match.
AI-Native: Maersk — AI Rerouting for Disruption Detection
Maersk uses AI to monitor shipping routes and detect disruptions in real time, enabling proactive rerouting before delays compound across the network. The system ingests data from vessel tracking, port operations, weather feeds, and geopolitical alerts. For a detailed analysis of Maersk's deployment conditions and measured outcomes, see our dedicated case study: Maersk AI Logistics Deployment: Case Study Outcomes and Implementation Conditions.
Vendor Evaluation Scorecard Template
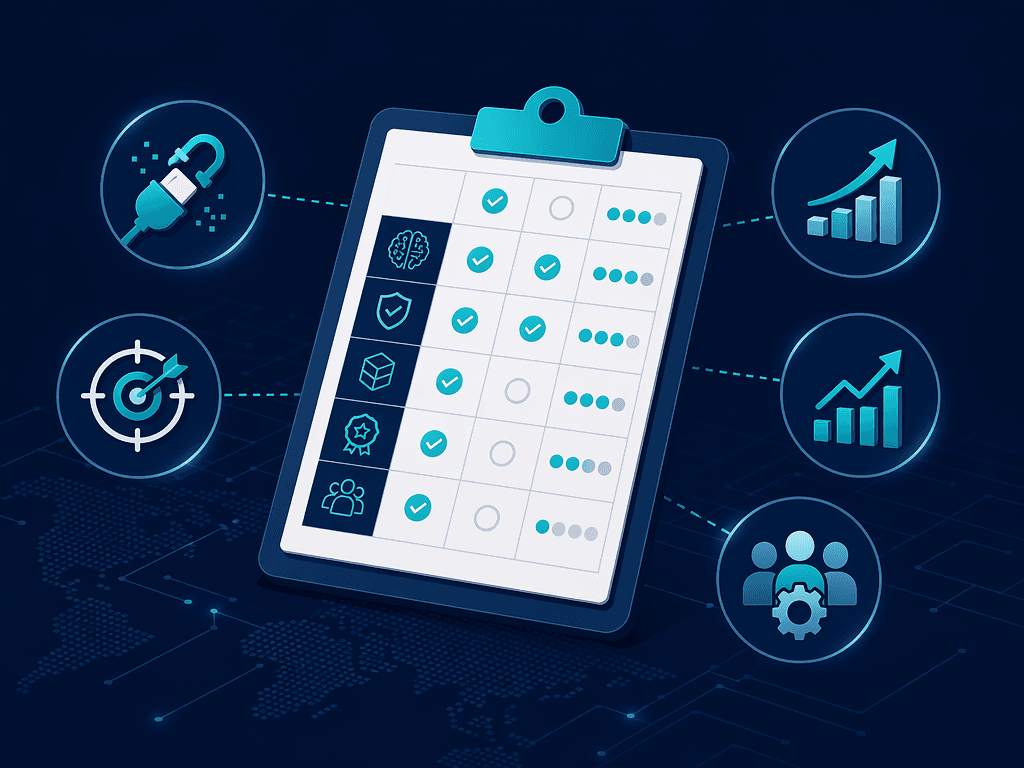
The following scorecard template provides a structured framework for evaluating AI logistics vendors across five dimensions. Weight each dimension based on your organization's priorities and maturity level.
| Evaluation Dimension | Weight (1-5) | Scoring Criteria (1-5 scale) | Vendor A Score | Vendor B Score | Vendor C Score |
|---|---|---|---|---|---|
| Data integration depth | 5 (critical) | 5 = API-native, real-time, minimal ETL; 3 = batch integration, moderate ETL; 1 = manual data upload required | |||
| Use-case specificity | 4 (important) | 5 = purpose-built for your function; 3 = general platform with your function as a module; 1 = requires heavy customization | |||
| Scalability track record | 4 (important) | 5 = documented deployments at 2x+ your volume; 3 = reference customers at similar scale; 1 = no production-scale references | |||
| Measurable ROI evidence | 5 (critical) | 5 = independently verified outcomes at named companies; 3 = vendor-reported outcomes with methodology; 1 = no outcome data | |||
| Workforce change management | 3 (valuable) | 5 = dedicated change management program; 3 = training materials provided; 1 = no change management support |
Comments
Join the discussion with an anonymous comment.