The AI Investment Paradox: Why 85% of Initiatives Deliver Near-Zero Value
Supply chain leaders are under extraordinary pressure to adopt artificial intelligence. A 2025 survey by ABI Research found that 94% of supply chain companies plan to use AI or generative AI for decision support within two years. Investment is flowing accordingly: 85% of executives told Supply Chain Brain in 2025 that they intend to increase AI spending in 2026, with one in five expecting a hike of 20% or more. The logic seems unassailable — AI promises better forecasts, leaner inventories, faster logistics, and lower procurement costs.
Yet the returns are not matching the rhetoric. Boston Consulting Group reported in 2025 that 85% of AI initiatives deliver near-zero measurable value. That is not a technology failure. The algorithms work. The cloud infrastructure is available. The vendors have case studies. The problem is organizational: most companies deploy AI without first understanding where they stand on a maturity curve, what problems they are actually solving, and what sequence of investments produces compounding returns rather than isolated experiments.
The gap is stark. Gartner surveyed 120 supply chain leaders already deploying AI and found that only 23% have a formal AI strategy. That means more than three-quarters of organizations investing in AI are doing so without a documented plan for how the technology connects to business outcomes. They are buying tools, not building capabilities. And the consequences show up in the P&L: Deloitte reported in 2025 that 85% of organizations increased AI investment yet only 6% saw ROI in under a year; most take two to four years to achieve satisfactory returns.
This article is written for the supply chain VP, procurement director, or operations executive who has been told to "do AI" and needs a practical framework to convert that mandate into measurable business value. The core argument is simple: the companies that succeed are those that assess their current maturity stage, start with the highest-feasibility use cases, assign named owners to transformation roles, and track value against baseline KPIs systematically over a structured timeline. The framework that follows — a four-stage maturity map, a five-dimension self-assessment, and a 30/90/12-month transformation roadmap — is designed to turn the 85% failure statistic into an avoidable outcome.
For readers who want deeper ROI benchmarking data before starting their maturity assessment, the companion piece From Pilot to Profit: The Real ROI of AI in Procurement and Supply Chain provides cross-analyst ROI synthesis. This article goes further: it helps you diagnose where you are before you decide where to invest.
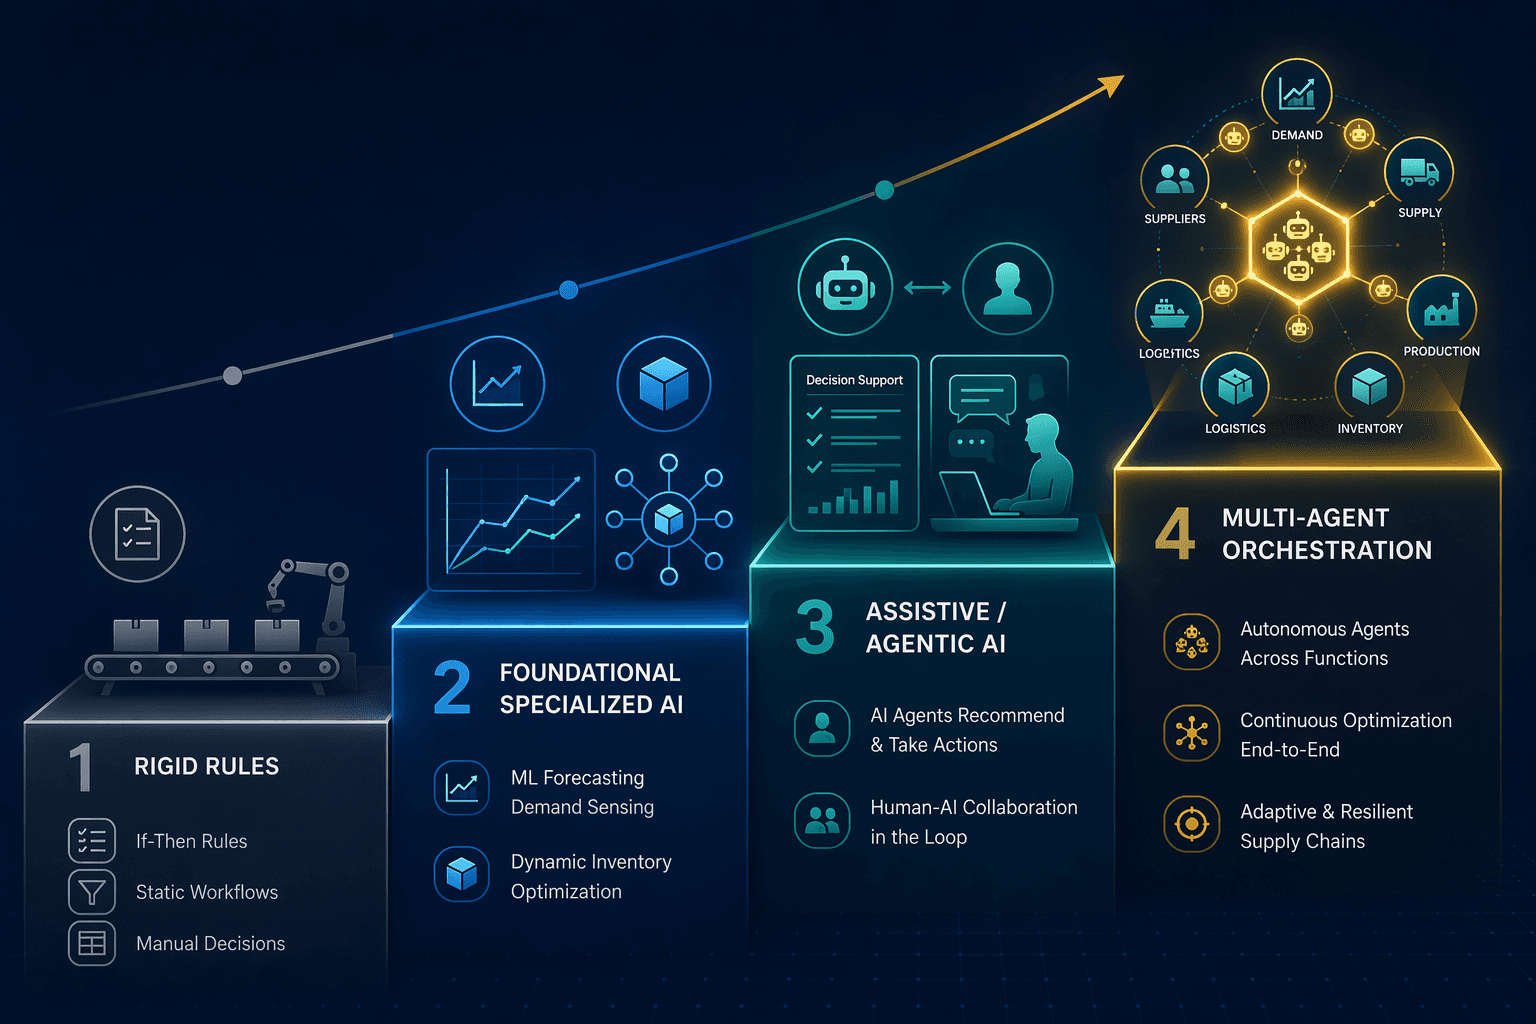
The 4-Stage AI Maturity Map: From Rigid Rules to Multi-Agent Orchestration
AI maturity in supply chain operations is not a binary state — you are not either "using AI" or "not using AI." It is a progression through four distinct stages, each with its own operational characteristics, data requirements, and realistic ROI expectations. The framework below, adapted from the RELEX AI-to-ROI model and validated against industry patterns, provides a common language for leadership teams to assess where they are and where they need to go.
| Stage | Operational Description | Typical ROI | Common Tools |
|---|---|---|---|
| Stage 1: Rigid Rule-Based Systems | Static safety stock formulas, fixed reorder points, spreadsheet-based S&OP. Decisions are deterministic and do not adapt to changing demand patterns. | Minimal. Automation of manual calculations, but no improvement in forecast accuracy or inventory turns. | Excel, legacy ERP planning modules, basic WMS/TMS. |
| Stage 2: Foundational Specialized AI | ML-driven demand forecasting, dynamic inventory optimization, automated supplier risk scoring. Single-function AI models trained on historical data with measurable accuracy improvements. | Measurable ROI begins here. 20–50% forecast error reduction (McKinsey), 20–30% inventory reduction (McKinsey), 5–15% procurement spend reduction. | Blue Yonder, o9 Solutions, Kinaxis, Relex, Coupa, specialized forecasting engines. |
| Stage 3: Assistive & Agentic AI | AI agents that monitor exceptions, recommend actions, and execute predefined decisions within guardrails. Human-in-the-loop for high-impact decisions. Cross-functional coordination begins. | 15–20% service level improvements (Deloitte), 8–12% logistics cost reduction (Gartner), 30–50% reduction in unplanned downtime (McKinsey). | Control towers, agentic AI platforms, digital twin simulators, AI-powered TMS/WMS. |
| Stage 4: Multi-Agent Orchestration | Autonomous planning and execution across S&OP, procurement, logistics, and warehousing. AI agents negotiate with each other, resolve disruptions without human intervention, and optimize end-to-end trade-offs in real time. | 60% of disruptions resolved without human intervention by 2031 (Gartner). Compound returns from integrated optimization across functions. | Multi-agent AI platforms, full digital twin ecosystems, autonomous planning systems. |
The critical insight for leadership teams is that Stage 2 is where measurable ROI begins. Organizations that try to leap directly from Stage 1 to Stage 3 or 4 — bypassing the data foundation, model governance, and process integration required at Stage 2 — are the ones that end up in the 85% failure bucket. The maturity map is a staircase, not an elevator.
Self-Assessment: Where Does Your Organization Stand?
Before building a business case or selecting vendors, leadership teams need an honest, structured diagnosis of their current maturity. The following five-dimension assessment, adapted from the RELEX framework, scores each dimension from 1 (Stage 1) to 5 (Stage 4 readiness). The goal is not a perfect score — it is a clear picture of where the gaps are so that investment can be targeted at the binding constraints.
Why invest the time in assessment? Accenture's 2024 analysis of 1,148 companies across 10 industries and 15 countries found that organizations with AI-mature supply chains are 23% more profitable and six times as likely to use AI and generative AI widely. That profitability premium is the benchmark that makes the assessment worthwhile.
| Dimension | Score 1 (Stage 1) | Score 3 (Stage 2) | Score 5 (Stage 4 Ready) |
|---|---|---|---|
| Data Foundation | Data is fragmented across ERP, WMS, TMS spreadsheets. No unified data lake or warehouse. Manual data cleaning required for every analysis. | Centralized data platform with automated pipelines. Clean, governed, and accessible for ML model training. Real-time data feeds for key functions. | Unified data fabric with real-time streaming, event-driven architecture, and bidirectional data flow between AI models and operational systems. |
| Planning Processes | S&OP is a monthly spreadsheet exercise. Forecasts are static and reviewed annually. Inventory policies are reviewed quarterly at best. | S&OP is a weekly or continuous process with ML-generated forecasts. Inventory optimization is dynamic and multi-echelon. Scenario planning is automated. | Planning is autonomous and continuous. AI agents adjust forecasts, inventory targets, and sourcing decisions in real time. Human oversight focuses on exceptions and strategy. |
| Technology Platforms | Legacy ERP with basic planning modules. No dedicated AI/ML platform. Analytics is done in Excel or BI tools. | Cloud-native AI planning platform deployed for at least one function (demand forecasting or inventory optimization). API integrations with ERP and WMS. | Composable AI architecture with multiple specialized models and agentic AI layers. Full digital twin capability for simulation and what-if analysis. |
| People & Change Leadership | No dedicated AI roles. Supply chain planners are expected to "figure out" AI tools on their own. Change management is ad hoc. | Dedicated data science or AI team supporting supply chain. Planners are trained on AI tools and understand model outputs. Change management is structured. | AI is embedded in every supply chain role. Planners are augmented by AI agents. Organizational design has been restructured around AI workflows. 84% of companies have not yet done this (Deloitte 2026). |
| Governance & Risk | No AI governance framework. Model outputs are used without validation. No audit trail for AI-driven decisions. | Basic model governance: validation, monitoring, and human-in-the-loop for high-impact decisions. Explainability is documented. | Comprehensive AI governance: model drift monitoring, automated rollback, audit trails for all autonomous decisions, and regulatory compliance (e.g., EU AI Act). |
To use this assessment: have each member of the leadership team score their organization independently, then compare results. The gaps between scores reveal where there is alignment and where there is disagreement about current capabilities. A data foundation score of 2 with a technology platform score of 4, for example, indicates that the organization has bought advanced tools but cannot feed them with reliable data — a classic failure pattern.
Three Common Failure Patterns and How to Avoid Them
The RELEX AI-to-ROI framework identifies three recurring failure patterns that explain why so many AI initiatives stall. These patterns are not hypothetical — they emerge repeatedly across industries and company sizes. Recognizing them early is the first step to avoiding them.
Failure Pattern 1: Starting with Technology Before Defining the Problem
A procurement director buys an AI-powered spend analytics platform because a competitor uses it. A logistics VP deploys a route optimization tool because it won an industry award. In both cases, the technology is selected before the problem is defined. The result: the tool solves a problem the organization does not have, while the actual pain point — say, supplier risk visibility or cross-dock coordination — remains unaddressed.
The antidote is simple but rarely practiced: define the operational problem in measurable terms before evaluating any technology. "We have 15% stockout rates on high-velocity SKUs during peak seasons" is a problem statement. "We need an AI forecasting tool" is a solution looking for a problem.
Failure Pattern 2: Bypassing the Foundation for the Cutting Edge
The allure of agentic AI and autonomous planning is strong. But organizations that try to deploy Stage 3 or Stage 4 capabilities without first building the Stage 2 foundation — clean data, validated models, integrated planning processes — fail predictably. The AI agents make decisions based on bad data, the models drift without monitoring, and the human planners lack the trust to act on AI recommendations.
The data bears this out. A 2025 Deloitte survey found that only 29% of manufacturers currently use AI or machine learning at the facility or network level. And 67% of organizations report stalled ROI on visibility tools due to fragmented legacy systems, according to Tradeverifyd's 2025-2026 industry benchmarks. The foundation must come first.
Failure Pattern 3: Treating AI as a Technology Upgrade, Not an Organizational Shift
This is the most pervasive failure pattern — and the hardest to fix. Organizations deploy AI tools but do not redesign roles, workflows, or decision rights around them. Planners are expected to use AI-generated forecasts but are still evaluated on metrics that reward manual overrides. Procurement agents have AI-powered supplier risk dashboards but no authority to act on the alerts.
Deloitte's 2026 research found that 84% of companies have not redesigned roles around AI. That means the vast majority of organizations are asking employees to work around AI rather than with it. The result is low adoption, frustrated teams, and AI tools that are purchased but not used.
The organizations that avoid these patterns share a common approach: they start with a well-defined operational problem, build the data and process foundation before adding complexity, and treat AI deployment as an organizational transformation that requires new roles, new metrics, and new decision rights. The case studies below illustrate what this looks like in practice.
| Company | Problem | AI Approach | Measurable Outcomes |
|---|---|---|---|
| Blount Fine Foods | High forecast error and food waste in a high-growth (20%+ CAGR) fresh food business. | ML-driven demand forecasting and dynamic inventory optimization (Stage 2). | 50% forecast error reduction, 35% less waste, sustained 20%+ CAGR. |
| KICKS (Nordics Beauty Retailer) | High lost sales from stockouts and late deliveries in omnichannel retail. | AI-powered inventory optimization and logistics coordination (Stage 2–3). | 34% lost sales reduction, late deliveries reduced from 5.2% to 3.4%. |
| Rastelli Foods | Lack of inventory visibility across multiple warehouses, leading to overstock and stockouts. | AI-driven inventory visibility and demand forecasting platform (Stage 2). | $3.5M saved in first year, 85% forecast accuracy achieved. |
| Bünting Group (German Retailer) | Inventory count inaccuracies causing balance errors and lost sales. | AI-powered inventory optimization and automated replenishment (Stage 2). | +2% sales value, -43% balance errors on inventory count days. |
The 30/90/12-Month Transformation Roadmap
A maturity assessment identifies where you are. A roadmap tells you how to move forward. The following 30/90/12-month transformation roadmap, adapted from the RELEX framework, provides a structured sequence of actions with named transformation owners, specific KPIs, and clear stage gates. The roadmap assumes the organization has completed the self-assessment and identified its starting stage.
The roadmap assigns four transformation owner roles, each with distinct responsibilities:
- Business Owner (typically VP Supply Chain or Procurement Director): owns the problem definition, business case, and stakeholder alignment. Ensures the AI initiative is tied to a specific operational outcome.
- Technology Enabler (VP IT, CDO, or Data Science Lead): owns data readiness, platform selection, model development, and integration with existing systems.
- Change Champion (HR or Operations Transformation Lead): owns role redesign, training, communication, and adoption metrics. Ensures the organization shifts alongside the technology.
- Value Tracker (Finance or Strategy Lead): owns KPI definition, baseline measurement, ROI tracking, and reporting to leadership. Ensures the initiative remains accountable to business outcomes.
| Phase | Timeline | Key Actions | Owner | KPIs to Track |
|---|---|---|---|---|
| Phase 1: Assessment & Quick Wins | Days 1–30 | Complete 5-dimension self-assessment. Identify 1–2 high-feasibility use cases (e.g., demand forecasting for top 20% of SKUs). Assign transformation owners. Establish baseline KPIs for selected use case. | Business Owner + Value Tracker | Baseline forecast accuracy, stockout rate, inventory turns, planner hours spent on manual tasks. |
| Phase 2: Pilot & Foundation | Days 31–90 | Deploy ML-driven forecasting or inventory optimization for the selected use case. Clean and unify data for the pilot scope. Train planners on AI tool outputs. Establish human-in-the-loop workflow. | Technology Enabler + Change Champion | Forecast error reduction (target: 20–30%), planner adoption rate (target: >80% using AI outputs weekly), data quality score (target: >90% completeness). |
| Phase 3: Scale & Optimize | Months 4–12 | Expand AI deployment to additional functions (e.g., procurement spend analytics, logistics route optimization). Integrate AI outputs into S&OP process. Begin agentic AI pilot for exception handling. Redesign planner roles around AI augmentation. | Business Owner + Technology Enabler + Change Champion | Cross-functional ROI (target: 15–20% service level improvement, 10–15% logistics cost reduction), role redesign completion rate, autonomous exception handling rate. |
The roadmap is designed to produce visible results within 90 days — not full transformation, but enough momentum to justify continued investment. The 30-day phase is deliberately scoped to assessment and quick wins because the most common failure is trying to do too much too fast. The 90-day pilot phase is where measurable ROI begins, consistent with the Stage 2 pattern. The 12-month scale phase is where the organization moves from isolated AI applications to integrated, cross-functional AI operations.
What AI-Native Operations Look Like Across Functions
The end-state vision — Stage 3 and Stage 4 maturity — is not a theoretical future. It is already being realized by organizations that have followed the staged approach. The following descriptions, grounded in real-world outcomes from the case studies and analyst benchmarks cited throughout this article, illustrate what AI-native operations look like across five core supply chain functions.
S&OP and Demand Planning
At Stage 2, ML-driven forecasting reduces errors by 20–50% (McKinsey). At Stage 3, the S&OP process becomes continuous rather than monthly. AI agents monitor demand signals, flag exceptions, and recommend adjustments to the plan. The human planner's role shifts from generating forecasts to evaluating AI recommendations and making strategic trade-off decisions. Blount Fine Foods achieved a 50% forecast error reduction and 35% less waste using this approach.
Inventory Optimization
Dynamic multi-echelon inventory optimization (MEIO) at Stage 2 reduces inventory by 20–30% while maintaining or improving service levels (McKinsey). At Stage 3, AI agents adjust safety stock policies in real time based on demand volatility, supplier lead time variability, and disruption alerts. Rastelli Foods saved $3.5M in the first year by gaining inventory visibility across multiple warehouses and achieving 85% forecast accuracy.
Logistics and Route Optimization
AI-powered route optimization at Stage 2 delivers 8–12% logistics cost reduction (Gartner). Uber Freight's ML-based carrier pricing and routing reduced empty miles from the industry average of 30% to 10–15%, as reported by MIT Sloan. At Stage 3, AI agents monitor real-time traffic, weather, and port congestion, rerouting shipments autonomously within guardrails. Walmart's route optimization program eliminated 30 million driver miles and saved 94 million pounds of CO2.
Procurement and Supplier Management
AI-powered spend analytics and supplier risk scoring at Stage 2 reduce procurement spend by 5–15% (McKinsey). At Stage 3, AI agents continuously monitor supplier financial health, geopolitical risk, and commitment compliance, escalating only the highest-risk exceptions to human buyers. A Fortune 500 manufacturer achieved 100% visibility into supplier commitments and a 30% reduction in supply-driven stockouts using this approach, as reported by Unframe.
Warehouse Operations
AI-powered warehouse automation at Stage 2 increases throughput by 30–50% in US distribution centers (McKinsey). GXO's AI-powered inventory counting system scans up to 10,000 pallets per hour. At Stage 3, AI agents coordinate robotic picking, dynamic slotting optimization, and predictive maintenance. Frito-Lay achieved zero unexpected equipment breakdowns in the first year of its predictive maintenance program.
These outcomes are not hypothetical. They are being achieved today by organizations that have invested in the data foundation, process integration, and organizational change required at each maturity stage. The common thread is not the sophistication of the AI — it is the discipline of staging investment in the right sequence.
The roadmap in this article provides the sequence. The self-assessment provides the starting point. The four transformation owner roles provide the accountability. The rest is execution — and the evidence shows that organizations that execute in stages, rather than in leaps, are the ones that convert AI spending into P&L impact.
Comments
Join the discussion with an anonymous comment.