
The useful question is not whether a warehouse digital twin can render a convincing 3D model. The useful question is which warehouse decision gets better after the model is connected to orders, inventory, labor, equipment, or layout data. The current evidence is uneven, but it is no longer empty: warehouse digital twin use cases now have reported production metrics in picking, slotting, inventory accuracy, workforce management, and automation planning.
That does not make every ROI slide safe to copy into a capital request. Most reported results still come from vendors, single-customer case studies, internal operator blogs, or market research rather than independent audits. The numbers below are best read as source-labeled assumptions, not universal benchmarks.
| Use case | Operational problem | Reported metric | Source type | Main caveat |
|---|---|---|---|---|
| Picking optimization | Excess travel from poor order grouping and inefficient path sequencing | 15–30% distance reduction from order clustering, plus another 10–20% from path optimization; 25–40% combined travel-distance reduction | Vendor-published methodology and results | Not independently audited |
| Slotting optimization | Fast movers sitting too far from pick stations or high-traffic zones | Up to 50% travel-time reduction from dynamic SKU velocity analysis | Single-vendor article | Upper-bound claim; warehouse baseline matters |
| Inventory accuracy | Cycle-count gaps, location mismatches, and slow variance closure | Vente-unique.com improved from 92% to 98% accuracy in 3 days, then reached 99.9% | Vendor-published customer case study | Single-customer result |
| Workforce management | Labor plans that lag real pick rates, congestion, and shift conditions | 15–27% labor productivity improvement per pick associate | Market research report | Methodology not independently verified |
| Automation planning and validation | Committing conveyors, robots, or layout changes before the model is accurate enough | Up to 80% reduction in digital twin build time using structured LIDAR scanning at about 3 cm precision | AWS blog based on Amazon fulfillment-center experience | Internal operator experience, not a neutral benchmark |

Picking optimization: fewer miles before faster picks
Picking is where the digital twin story becomes operational instead of decorative. A map of the building is not enough. The value comes when the system understands current orders, item locations, aisle constraints, pick zones, and the sequence in which work will hit the floor.
Optioryx describes a two-step approach. First, the twin clusters orders so that pickers or mobile robots can collect compatible work in fewer trips; the company reports 15–30% travel-distance reduction from that step. Then path optimization sequences the route through the warehouse, adding another 10–20% reduction. Combined, Optioryx reports 25–40% lower travel distance, with the caveat that the figures are vendor-published and not independently audited.[1]
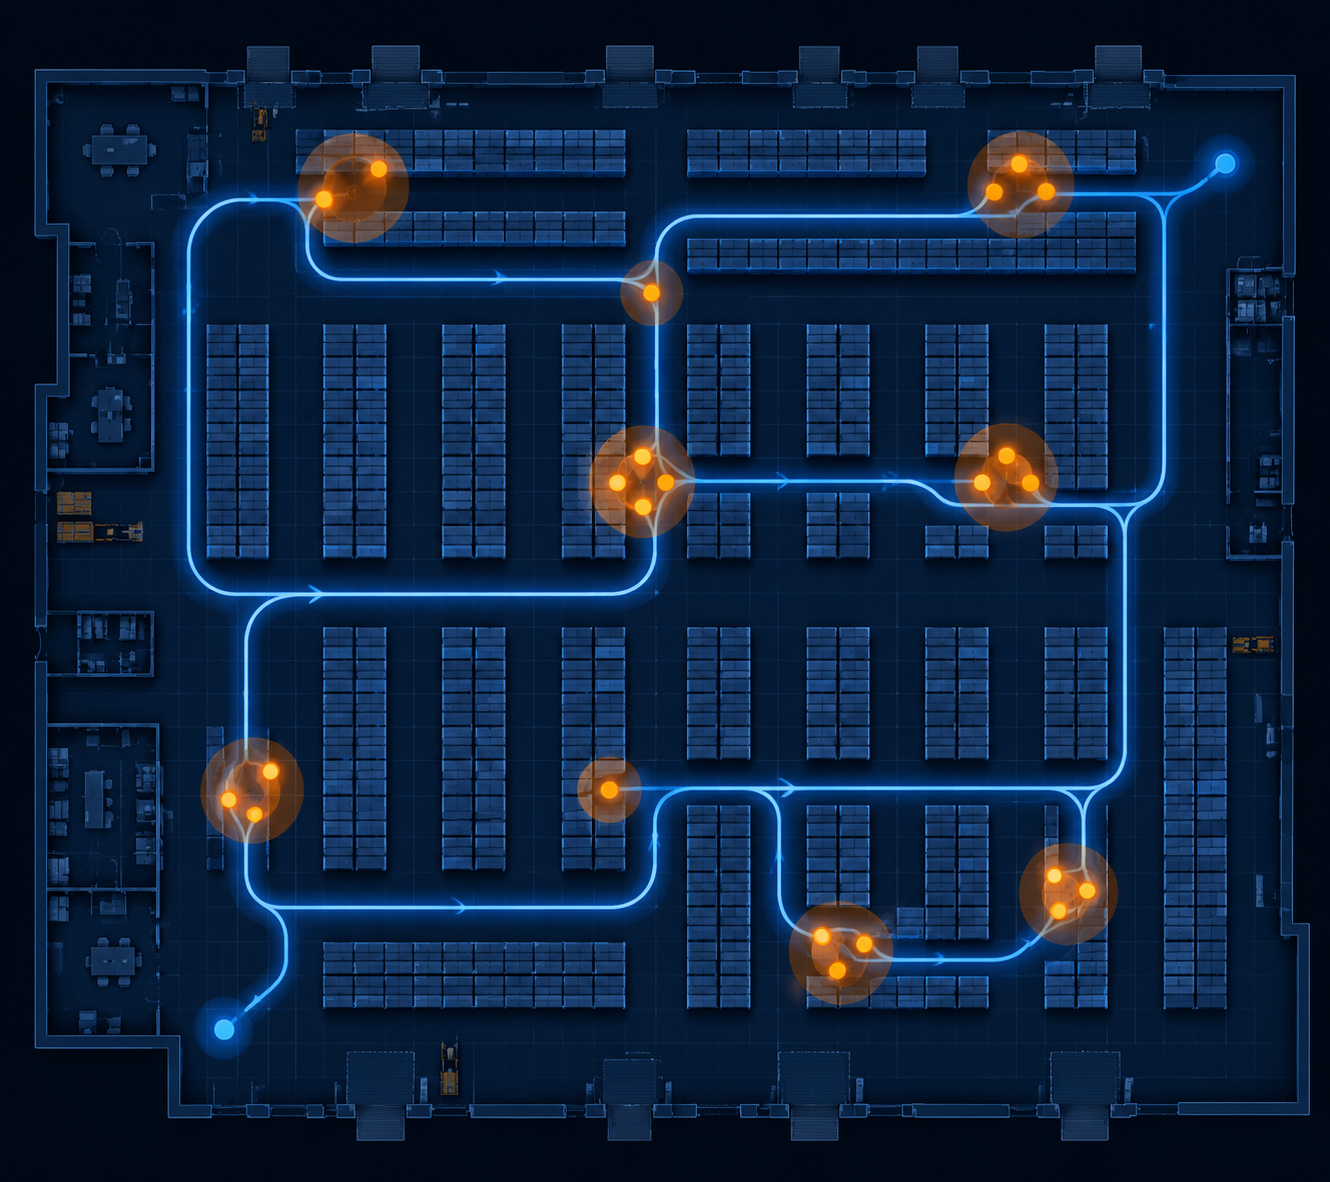
The mechanism matters more than the headline percentage. If the order pool is badly grouped, a perfect route only makes a poor batch slightly less wasteful. If the grouping is sensible but the path ignores aisle direction, congestion, or pick-face location, the batch still burns travel. A digital twin can improve the decision because it can test the work package and the route against the same physical layout.
For a warehouse team, the due diligence is straightforward: separate the clustering effect from the routing effect, measure baseline travel by order type, and test whether the reduction survives real wave timing, replenishment conflicts, and zone handoffs. A 25–40% vendor-reported travel-distance reduction is meaningful, but it should not be entered into an ROI model as a flat labor saving unless travel time is the actual constraint in that operation.[1]
Slotting optimization: when velocity analysis changes the pick face
Slotting is a quieter use case, but it often decides whether picking gains are durable. A digital twin can compare SKU velocity, item affinity, storage constraints, replenishment frequency, and pick-station distance before the team starts moving product. That is a different decision from drawing heat maps after the fact.
Synkrato reports that dynamic SKU velocity analysis can cut travel time by up to 50% by repositioning fast-moving items closer to pick stations.[2] The phrase “up to” has to do work here. It implies a high-opportunity baseline: fast movers were probably too far away, slotting was stale, or demand changed faster than the warehouse re-profiled locations.
The better business case does not start with the 50% ceiling. It starts with the cost of a re-slot, the volatility of the SKU base, the number of touches affected, and whether replenishment labor increases when pick travel falls. A twin is useful because it can test those trade-offs before supervisors spend a weekend moving inventory into locations that look efficient on one metric and painful on another.
Inventory accuracy: the case for sensing, not just modeling
Inventory accuracy is where the physical sensing layer becomes hard to ignore. A WMS location record can be wrong with great confidence. A digital twin tied to autonomous scanning, computer vision, or other real-time capture methods can expose the gap between the system record and the floor condition more quickly than manual cycle counts alone.
Dexory’s case study for Vente-unique.com is a strong example because the reported metric is specific. The retailer improved inventory accuracy from 92% to 98% in 3 days after using DexoryView autonomous robots and a digital twin, and later reached 99.9% accuracy.[3] That is the kind of before-and-after number operators can understand: fewer unresolved variances, fewer blind replenishment decisions, and less time spent arguing with the system of record.
It is still a single-customer, vendor-published case. The result should be treated as a peak deployment outcome, not a default accuracy target for every facility. Accuracy gains depend on starting condition, barcode discipline, location labeling, scanning frequency, exception workflow, and whether the WMS accepts corrections cleanly. A robot can see a mismatch; the warehouse still needs a process for deciding who reviews it, who approves the correction, and how quickly the variance is closed.
The DB Schenker example points in the same direction, though with a more modest number: a Dexory/Forrester TEI study reported a 6% inventory-accuracy improvement using real-time autonomous scanning robots integrated with a digital twin interface.[4] Taken together, the cases support a narrower but useful conclusion: warehouse digital twins can improve inventory accuracy when they are fed by fresh physical observations, not when they merely visualize old inventory records.
Workforce management: planning the shift while conditions are still moving
Labor planning is usually where averages betray the floor. The planned pick rate may be reasonable for the week and wrong for the next two hours because the order mix changed, a replenishment queue built up, or too many people were assigned to a zone that is about to run dry.
DataIntelo’s 2026 warehouse-specific market report cites labor productivity improvements of 15–27% per pick associate through digital-twin-guided operations.[5] The same report cites energy cost reductions of 18–24%, and also reports cross-cutting predictive maintenance effects: 25–38% maintenance cost reduction and 32–47% unplanned downtime reduction.[5]
Those ranges are useful as market context, not as proof that a particular building will land inside them. The methodology details are not independently verified from the available material. For a labor business case, the practical test is whether the twin changes a specific management decision: move associates before a queue forms, stagger breaks around automation saturation, rebalance work between zones, or adjust the release plan before congestion turns into overtime.
Teams already evaluating warehouse AI can compare this labor-planning pattern with broader examples in AI for Warehouse Management. The overlap is real, but the digital twin claim should stay tied to a live or frequently refreshed model of the facility, not just a forecasting dashboard.
Automation planning and validation: testing the building before buying the mistake
Automation planning is unforgiving because physical decisions become expensive quickly. Conveyor supports, mezzanine loads, robot charging areas, induction points, egress paths, and aisle widths cannot be hand-waved after procurement. A digital twin helps when it lets the engineering team validate layout, flow, and equipment assumptions before steel, controls work, or robots are committed.
AWS describes a Warehouse Automation and Optimization service that reduced digital twin build time by up to 80% using structured LIDAR scanning with about 3 cm precision.[6] The strongest part of that claim is not that LIDAR sounds advanced; it is that build time and layout accuracy are gating factors in simulation. If the model takes too long to create or starts from bad geometry, the automation engineer is validating a convenient fiction.
The caveat is equally important. The AWS example comes from Amazon’s internal fulfillment-center experience, so it should not be treated as a neutral benchmark for every operator. It does, however, identify a practical bottleneck: digital twin projects often fail before simulation because the facility model, equipment data, and process assumptions are incomplete.
CEVA Logistics offers a related example at Großbeeren, Germany, where it described a Monte Carlo simulation engine-based digital twin using real-time WMS data feeds.[7] As of mid-2024, the project was described as a trial, and its production status is not confirmed from the available sources.[7] That makes it useful as an example of simulation architecture, not as proof of sustained production ROI.
What the market numbers do and do not prove
Market sizing can explain why more vendors are in the conversation, but it cannot justify a warehouse project on its own. DataIntelo valued the global digital twins for warehouses market at $3.8 billion in 2025 and projected it to reach $18.6 billion by 2034, a 19.3% CAGR. The same report says cloud deployment accounted for 58.2% of 2025 revenue and projects that more than 47% of new warehouse digital twin installations will be AI-augmented by 2027.[5]
Those figures support a limited conclusion: investment and vendor activity are increasing in the warehouse-specific segment. They do not prove that a given distribution center will reduce travel, improve accuracy, or avoid automation rework. DataIntelo also notes more than 120 active vendors, which is a warning as much as a sign of maturity; fragmented supply means buyers need sharper assumptions, not looser ones.[5]
For ROI work, the safer pattern is to assign each assumption to its source type. Vendor case study numbers belong in an upside scenario unless the warehouse can reproduce the baseline conditions. Market research ranges belong in sensitivity analysis. Internal pilots deserve their own baseline, especially if labor standards, slotting discipline, inventory accuracy, or layout data quality differ by site. Readers building that model may want the more general warehouse AI ROI reality check alongside this use-case view.
A practical way to calibrate the investment case
A warehouse digital twin is easiest to defend when it is attached to a decision already causing measurable pain. If the problem is pick travel, measure distance and route quality before debating visualization. If the problem is inventory trust, inspect the sensing layer and exception workflow. If the problem is automation risk, check how quickly the team can build an accurate model and whether simulation uses live WMS or equipment data.
- Use vendor-reported gains as scenario inputs, not guaranteed outcomes.
- Keep adoption metrics separate from effectiveness metrics; a growing market does not equal a successful site deployment.
- Tie each use case to a baseline: travel distance, inventory variance, pick labor, energy cost, downtime, or simulation build time.
- Test whether the twin changes a live operating decision, not just whether it displays the warehouse more clearly.
- Budget for integration and data cleanup; WMS feeds, location master data, scan quality, and equipment state often decide whether the model is trusted.
Implementation planning should also be staged. A facility does not need to model every rack, task, robot, and labor rule on day one if the first value pool is narrower. A phased roadmap, like the one outlined in machine learning warehouse implementation, is often a better fit than a full-platform rollout that asks operations to trust too many new assumptions at once.
The credible conclusion is conditional. Warehouse digital twins are production-grade in several areas, especially when connected to picking, slotting, inventory visibility, labor planning, or automation validation. The investment case should still be built with labeled sources, local baselines, and sensitivity ranges, because the difference between a useful twin and an expensive visualization layer is usually found in the operating decision it changes.
References
- Warehouse Digital Twins, Optioryx
- Warehouse Digital Twins, Synkrato
- What’s next for digital twins, Dexory
- Dexory/Forrester TEI study, Dexory and Forrester
- Digital Twins for Warehouses Market, DataIntelo
- AWS Simulation and Digital Twin to Increase Warehouse Productivity, AWS Supply Chain Blog
- Digital twins: Optimizing warehouse performance to reduce costs, CEVA Logistics
Comments
Join the discussion with an anonymous comment.