
The Red Sea disruption turned a familiar supply chain problem into a modeling stress test. A lane that many logistics teams treated as a high-attention but still routinized corridor suddenly stopped behaving like its history. Suez transit volume fell by 57.5%, container freight costs rose by about 107% between December 2023 and May 2024 on the Drewry Index, and Asia-Europe rerouting around the Cape of Good Hope added 10-14 days of transit time, about 40% higher fuel costs per journey, and 38% more CO2 emissions.[1]
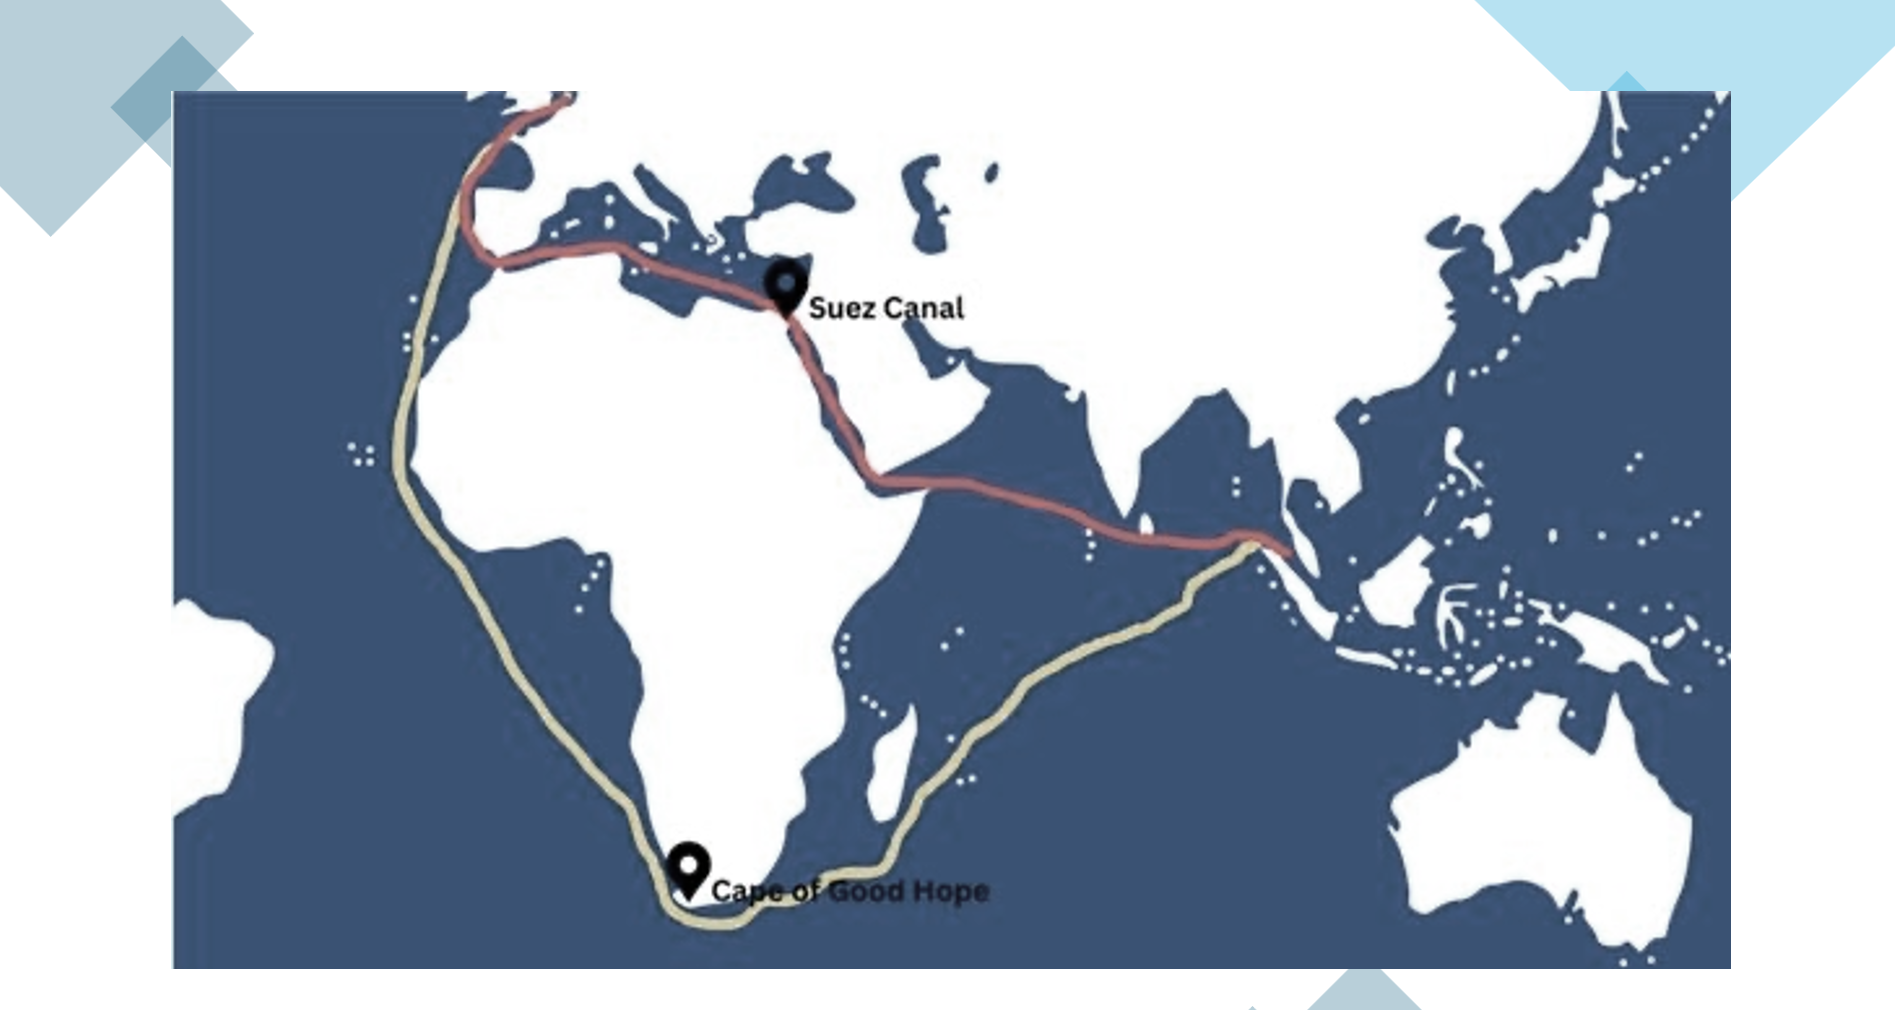
That is the operating context behind Red Sea disruption logistics risk modeling. The question is not whether a dashboard can color the Red Sea red after insurers, carriers, and procurement teams have already reacted. The harder question is whether a model can quantify a changing chokepoint probability early enough to affect a routing, inventory, exposure, or insurance decision.
Static risk matrices are weak at this job because they compress a dynamic system into a fixed score. They can mark a corridor as politically exposed, seasonally congested, or piracy-prone, but they do not naturally learn from vessel behavior, ownership networks, inspection records, alliance decisions, or a sudden divergence between normal AIS traces and current traffic. Machine learning does not solve that automatically. It only becomes useful when the model is trained for rare events, calibrated honestly, and connected to the operational exposure that the business actually carries.
The Evidence Worth Slowing Down For
The strongest peer-reviewed anchor for this discussion is not a Red Sea crisis paper. That matters. Knapp and van de Velden analyzed 1.2 million global maritime observations from 2014-2020 and tested 144 random-forest model variants for maritime risk prediction.[2] Their work predates the Houthi escalation and was built around routine maritime risk signals such as incidents, detentions, deficiencies, and casualties rather than conflict-driven chokepoint disruption. It should not be sold as a model that forecast the Red Sea crisis.
It is still highly relevant because it tests the part of the problem that many maritime risk slides glide past: whether machine learning can find useful structure in noisy vessel-level data when the outcome is rare. The authors compared multiple random-forest specifications, including balanced random forests, and reported 2.7-4.9x top-decile lift over random targeting for maritime incident prediction.[2]
Top-decile lift is not an abstract performance metric for a logistics risk team. If a model ranks vessels, voyages, or lane exposures by predicted risk, the top decile is the slice most likely to receive attention first. A 2.7-4.9x lift means the highest-scored tenth of observations contains materially more incidents than a randomly selected tenth.[2] In production terms, that can change which vessels a chartering desk screens manually, which supplier lanes receive contingency inventory, which bookings get exception review, or which shipments trigger insurance and security escalation.
The more interesting finding is not simply that random forests performed well. It is that the most predictive covariates were beneficial ownership and safety management company quality, not the more obvious signals such as vessel flag or class society.[2] That is the kind of result that justifies using machine learning instead of automating an old checklist. The model is not merely saying that risky-looking vessels are risky. It is surfacing institutional and management structures that a static matrix may underweight.
For Red Sea disruption logistics risk modeling, the transferable lesson is narrower but useful. A chokepoint model should not rely only on country risk, route geography, or freight-rate movement. It should be able to ingest vessel ownership, safety management history, AIS behavior, Port State Control records, trading pattern changes, carrier or alliance behavior, and external geopolitical signals. The Red Sea crisis is a corridor-level shock, but the operational consequences still arrive through vessel choices, port calls, service rotations, and exposed supplier flows.
Why Balanced Random Forests Matter In Chokepoint Risk
Rare events are where many impressive-looking logistics models become brittle. Maritime incidents, detentions, severe delays, and conflict-linked routing disruptions are sparse compared with normal voyages. A model trained naively on historical data can achieve reassuring aggregate accuracy by mostly predicting that nothing bad will happen. That is useless if the decision problem is finding the small set of voyages or exposures most likely to break.
Balanced random forests address this by correcting the imbalance between the majority class and the rare event class during training. In a maritime setting, that means the algorithm is forced to learn more from the scarce incident or disruption observations instead of being dominated by normal operations. The method does not create information that is not in the data, but it changes what the model is allowed to ignore.
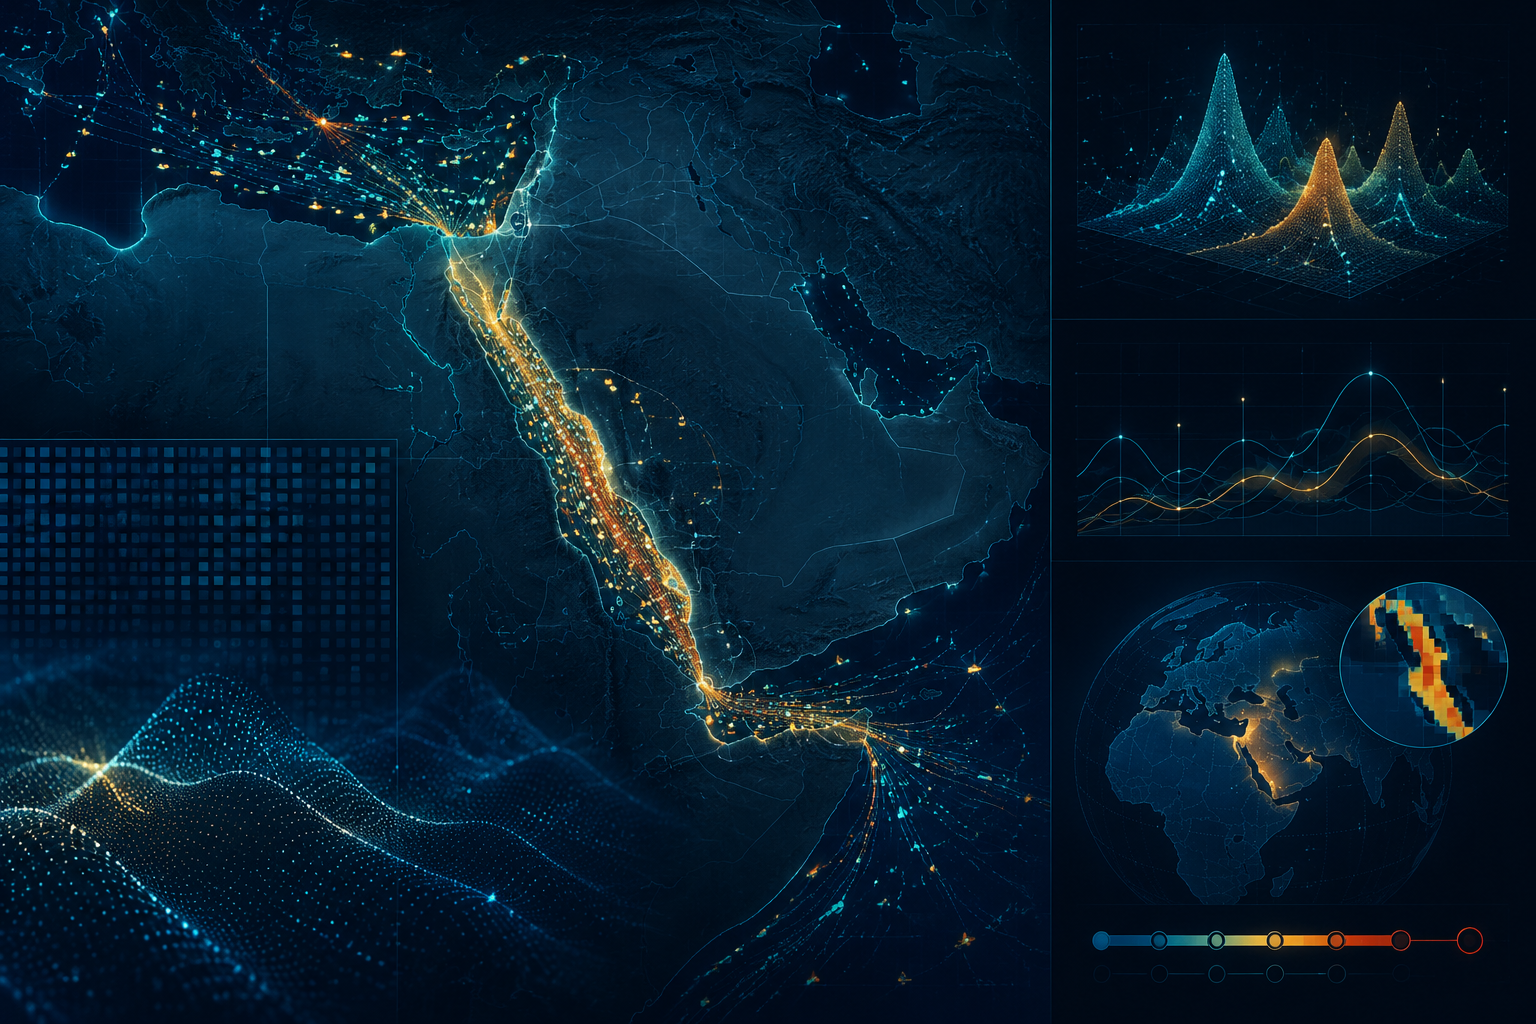
That distinction matters when a Red Sea-type shock shifts the baseline. Historical AIS patterns may show routine Suez transits, familiar port-call sequences, and stable carrier allocation. Once vessels begin diverting, skipping ports, changing speeds, or pausing service rotations, the model faces a distribution it did not see often in training. A balanced forest trained on rare maritime outcomes is better positioned than a static matrix, but it still needs current features that reflect the new regime.
The right operational target is not a binary claim that a crisis will or will not happen. A more defensible target is a calibrated probability or risk ranking that updates as signals change: vessel behavior, carrier announcements, port omissions, freight-price pressure, insurance conditions, geopolitical alerts, and exposure concentration. The model output should support decisions such as whether to pre-book capacity on an alternate lane, raise safety stock for a constrained component, change a delivery promise, or flag a shipment for executive review.
| Modeling issue | Why it matters in Red Sea-style disruption | What a production team should check |
|---|---|---|
| Class imbalance | Severe disruptions are rare relative to normal voyages. | Use methods such as balanced random forests and evaluate lift, recall, and calibration on high-risk segments. |
| Feature relevance | Obvious variables may underperform less visible ownership, management, or behavior signals. | Inspect covariate importance and test whether features remain predictive after the operating regime changes. |
| Model drift | Historical Suez patterns can stop representing current traffic behavior. | Monitor performance decay and retrain when AIS, port-call, and routing distributions shift. |
| Probability calibration | Risk teams need defensible probability bands, not only rank ordering. | Back-test predicted probabilities against observed outcomes and recalibrate for rare events. |
| Exposure connection | A high-risk voyage is only business-critical if it touches constrained products, suppliers, or contracts. | Join maritime risk scores to shipment, supplier, inventory, and customer-service exposure. |
From Paper Models To Operating Systems
Production systems show what this looks like outside a research setting, though vendor claims should be treated as directional unless independently audited. RightShip describes machine-learning systems including a Detention Predictor, Incident Risk Classification, and Vessel Trading Pattern Recognition, using data such as AIS activity and Port State Control inspection records to forecast vessel-level risk and classify trading behavior.[3]
The useful part is the operating pattern. AIS is not just a map layer. It becomes a behavioral history: where a vessel trades, how its port calls evolve, whether it begins avoiding certain waters, whether it slows, diverts, anchors, or changes its service pattern. Port State Control data adds an institutional and inspection lens. Incident classification creates an outcome structure. Trading-pattern clustering then groups vessels by behavior rather than by a single administrative label; RightShip reports that its clustering revealed five distinct risk profiles.[3]
That is a more credible architecture than a geopolitical heat map with a vessel overlay. It gives the model a way to learn that two ships with similar route labels may carry different risk because they have different ownership, management, inspection, and trading histories. It also gives analysts a way to challenge the output. If a model score rises, the risk team can ask which features moved: the lane, the vessel, the port history, the trading cluster, or the external condition.
A production maritime risk model should therefore expose both the score and the reason it changed. Network planners do not need a black-box probability that cannot be defended when capacity is scarce and freight premiums are rising. They need a ranked queue of exceptions, a confidence band, recent feature movements, and a link to the shipments, customers, inventory positions, and contracts affected by the score.
AIS Behavior Is A Live Signal, Not A Postmortem
The Red Sea crisis also showed that carrier and alliance behavior can be a measurable resilience strategy. Yang et al. used satellite AIS data to study shipping alliances during the crisis and found that their primary resilience strategy was increasing port skipping rates while maintaining vessel allocation.[4] That is not just a shipping-news detail. It is the kind of behavioral shift a live model should detect.
Port skipping changes the risk surface before it appears as a finished delay metric in an ERP system. A supplier may still have a booking. A vessel may still be deployed. But if the service begins omitting ports, the downstream effect can appear as missed feeder connections, transshipment congestion, rolled cargo, or inventory arriving at the wrong time. A model watching AIS traces and port-call execution can see that service reliability is changing even when a static route classification has not changed.
For analytics teams, the lesson is to model actions, not only events. A missile strike, insurance advisory, or naval warning may be an external event. A vessel diversion, port omission, anchorage pattern, speed adjustment, or allocation decision is an operational action. Chokepoint risk becomes more quantifiable when the model treats those actions as features that update the probability of delay, reroute, non-call, or capacity withdrawal.
This is where anomaly detection can complement supervised learning. The supervised model learns from labeled outcomes: detentions, incidents, diversions, or severe delays. The anomaly layer watches for current behavior that deviates from learned normal patterns. In a Red Sea setting, the anomaly itself is not the final answer; it is a trigger for recalibration, analyst review, or a higher-frequency forecast run.
The Maritime Score Is Only Half The Risk
A vessel-level or lane-level probability score can still be operationally incomplete. A 70% probability of disruption on a low-value, well-buffered shipment is not the same business risk as a 35% probability on a constrained component with one qualified supplier and no practical substitute. This is why graph-based supplier and network analysis belongs inside the deployment architecture rather than in a separate innovation lane.
Graph models are useful because chokepoint disruption propagates through relationships: supplier to part, part to product, product to plant, plant to customer, shipment to vessel, vessel to port, port to lane, lane to alternate capacity. A relational view can show which apparently small maritime exception touches a high-revenue customer program, a sole-source material, or a supplier tier that procurement does not normally monitor. For a deeper treatment of the supply-chain visibility side, see how knowledge graphs deliver multi-tier supply chain visibility.
The supplier concentration problem is not theoretical. A 2025 DLA analysis cited in a secondary aggregation found that more than 90% of materials identified as in shortfall had zero or one domestic supplier.[5] The source is not a maritime model, and it should not be treated as proof that Red Sea exposure has the same supplier pattern. It does show why a logistics-only view misses the consequence layer. The question is not only where the vessel is. It is what the vessel is carrying, who is waiting for it, and whether the network has another way to absorb the delay.
In practice, this means the model stack needs at least three joined views: maritime probability, shipment execution, and multi-tier exposure. A risk score that cannot identify affected purchase orders, SKUs, plants, customers, inventory buffers, and contractual service windows will struggle to win trust, even if the underlying AIS model is technically strong.
Where Deployments Fail
The failure mode is rarely that a team cannot train a model. It is that the model is evaluated under comfortable conditions and then asked to perform during a regime change. A Red Sea disruption model trained mostly on normal Suez patterns may appear stable until the very moment when vessels begin rerouting, omitting ports, or waiting for security guidance. That is not a small edge case. It is the core use case.
Knapp and van de Velden’s work is useful here because it points to both promise and constraint. The observed lift from balanced random forests supports deployment, but their 2014-2020 window does not directly test conflict-driven chokepoint behavior.[2] Applying the feature structure to the Red Sea requires validation on newer disruption data. Beneficial ownership and safety management quality may remain important, but a live chokepoint model also needs current geopolitical baselines, naval advisories, insurance-market changes, carrier actions, and AIS-derived behavioral shifts.
Calibration is the second weak point. A model that ranks cases well can still produce misleading probabilities. If the score says a voyage has a 40% disruption probability, someone may use that number in a freight budget, safety-stock decision, customer promise, or insurance discussion. The model team needs to know whether observed outcomes in that probability band actually occur at roughly that frequency, especially after a regime change.
Drift monitoring has to be explicit. AIS route distributions, port-call patterns, freight rates, and inspection exposure can all move after carriers alter their networks. Annual re-estimation may be enough for routine maritime risk, but severe chokepoint disruption can require faster retraining or at least recalibration when the input distribution shifts. The right cadence depends on traffic volatility, event frequency, and the cost of false negatives versus false positives.
- Track lift in the highest-risk deciles, not only overall accuracy.
- Measure calibration by probability band after major routing or geopolitical shifts.
- Compare feature importance before and after a disruption to detect changing drivers.
- Separate vendor-provided confidence scores from independently validated performance.
- Join maritime scores to supplier, inventory, shipment, and customer exposure before prioritizing action.
This is also why broad supply chain AI ROI numbers should make buyers cautious. A secondary aggregation cites convergence across Gartner, BCG, and McKinsey that fewer than 20% of supply chain AI initiatives in logistics risk deliver measurable ROI.[5] The number is not a verdict against maritime ML. It is a warning that a technically plausible model can fail if it is not embedded into exception workflows, decision rights, and exposure data.
What A Production-Grade Model Should Actually Output
A useful Red Sea disruption logistics risk model should not try to impress planners with a single crisis forecast. It should output a set of decision-grade artifacts that can be checked and acted on. The first is a probability or risk band for specific vessels, voyages, services, ports, or lanes. The second is a ranked exception queue showing which exposures deserve attention first. The third is an explanation layer identifying whether the score moved because of vessel behavior, ownership or management signals, port skipping, freight-rate stress, external security signals, or supplier criticality.
The fourth output is scenario impact. If Asia-Europe cargo moves via the Cape of Good Hope, the model should connect the reroute assumption to expected transit-time increase, fuel-cost pressure, emissions, inventory days, and service commitments, using current lane data rather than a fixed rule of thumb. The Marsh-cited estimates of 10-14 added days, about 40% higher fuel cost per journey, and 38% higher CO2 emissions are useful scenario anchors, but a company-specific model should translate those into affected orders and customers.[1]
The fifth output is a model-health view. Analysts should be able to see whether the current traffic distribution resembles the training window, whether calibration has deteriorated, whether the top-decile lift remains stable, and when the model was last retrained. Without this layer, the organization is asking planners to trust a probability score precisely when the world has changed enough to make historical patterns suspect.
For teams comparing vendors or deciding whether to build internally, the evaluation should focus less on the sophistication of the model name and more on the operating evidence. Ask whether the system handles class imbalance, which outcome labels it was trained on, how often it recalibrates, whether AIS behavior is modeled as a live signal, how geopolitical feeds enter the feature set, and whether performance is independently validated. A broader vendor evaluation checklist sits in how to evaluate supply chain AI software, but chokepoint risk deserves this additional scrutiny because the target event is rare, expensive, and regime-sensitive.
The Credible Claim
Machine learning can improve maritime chokepoint risk quantification, but the defensible claim is narrower than many demonstrations imply. Balanced random forests have peer-reviewed evidence of meaningful lift in maritime incident prediction on large historical data, and production systems show that AIS, Port State Control records, and trading-pattern recognition can be operationalized.[2][3] Red Sea-specific AIS research shows that crisis behavior such as port skipping can be measured rather than guessed.[4]
None of that proves a model can forecast the next geopolitical crisis. It does support a more useful conclusion: production-grade maritime risk models can quantify changing chokepoint probability better than static matrices when they are continuously retrained, calibrated for rare events, tied to live vessel behavior, and joined to supply-chain exposure. The model is valuable when it changes the next decision before the disruption is already obvious.
References
- Red Sea crisis: Impact and how to manage cargo risk in international trade, Marsh, 2024
- Exploration of machine learning methods for maritime risk predictions, Taylor & Francis, 2024
- How RightShip Leverages Machine Learning and AI for Proactive Risk Management, RightShip
- Geospatial resilience of shipping alliances: Navigating the Red Sea crisis, ScienceDirect, 2025
- Predictive Supply Chain Risk Modeling, Yenra
Comments
Join the discussion with an anonymous comment.