
The uncomfortable question usually arrives after the disruption, not before it: which products are exposed? Many companies can now answer that question for direct suppliers. They have supplier portals, spend data, ERP feeds, control-tower screens, and a tidy tier-1 view. Then the map stops. A McKinsey supply chain risk survey, cited by Glean, found that 60% of executives have visibility only into tier-1 suppliers.[1]
That tier-1 ceiling is the real starting point for a supply chain visibility knowledge graph. The point is not to draw a prettier network diagram. It is to give the operations director, risk analyst, or visibility team a way to trace a dependency from a product to a component, from that component to a supplier, from that supplier to a plant, and from that plant to another upstream source without asking every company in the chain to email a spreadsheet.

Why the Tier-1 View Breaks Down
Most visibility programs do not fail because teams forgot to collect data. They fail because the dominant data model was built to store records, not to follow dependencies. A supplier master table can tell you who the direct supplier is. A purchase order table can tell you what was bought. A certification table can tell you which supplier has which document on file. A logistics table can tell you which lane moved the shipment. The exposure, however, is in the relationships between those records.
In a relational system, those relationships are usually reconstructed through joins, reporting logic, and business rules that work only as far as the data has been explicitly modeled. That is manageable for direct suppliers. It becomes brittle when the question moves upstream: which tier-2 processor feeds this tier-1 component supplier, which mine supplies the processor, which products depend on that mineral stream, and which certificates or locations are attached to each step?
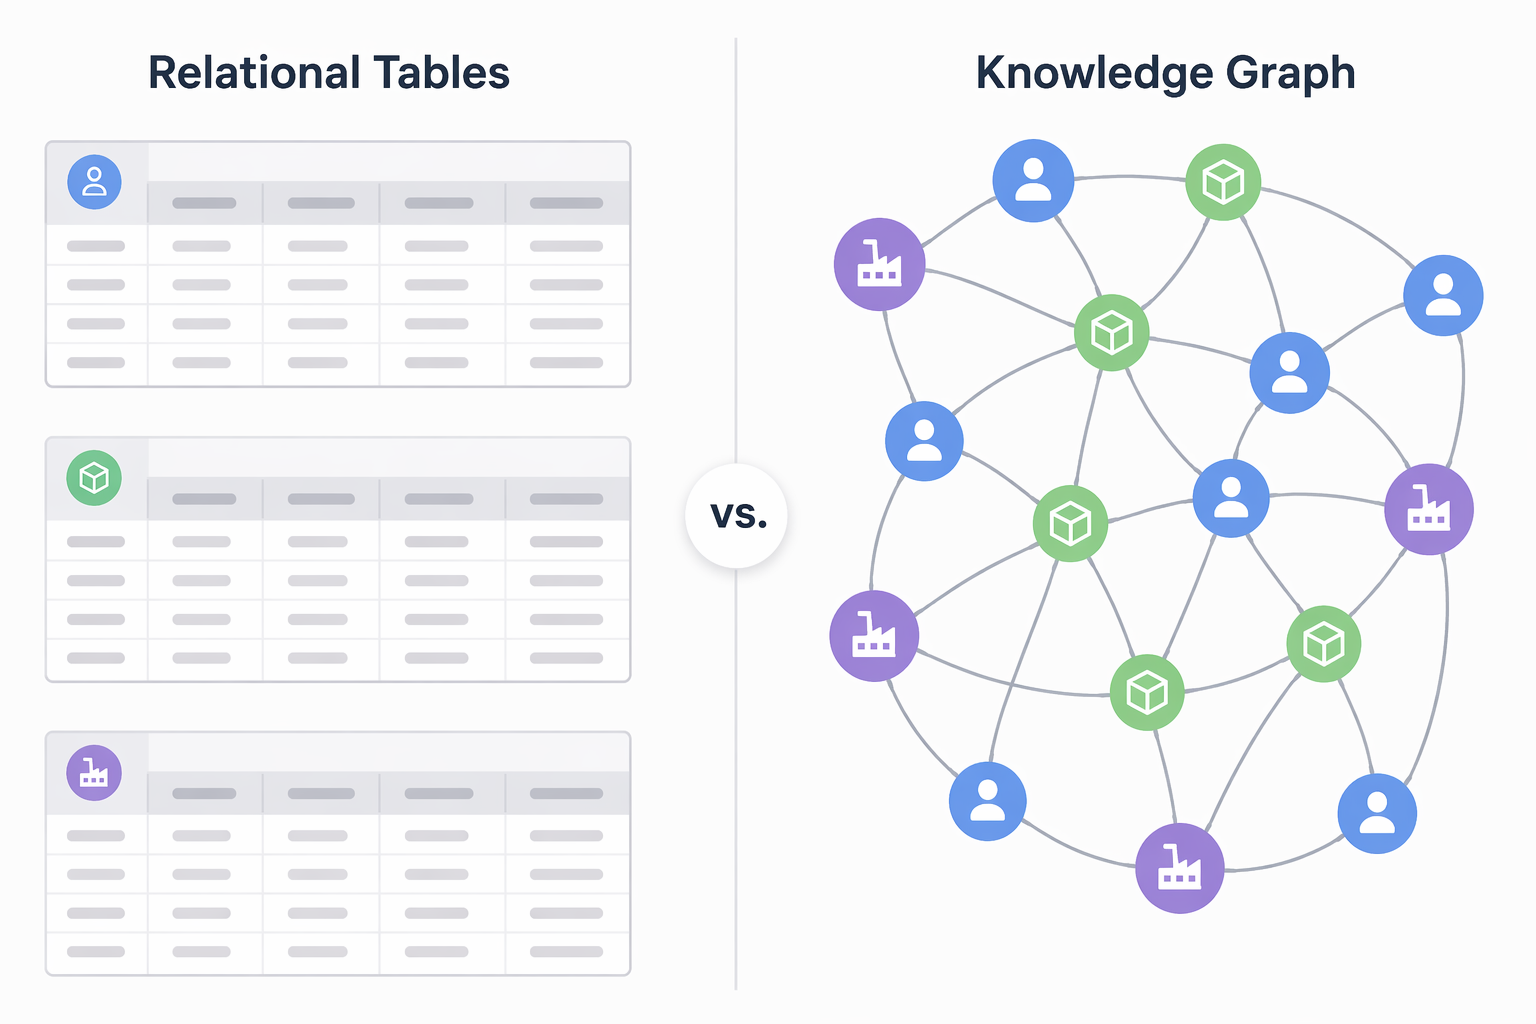
A knowledge graph changes the shape of the problem. Suppliers, materials, plants, products, locations, certifications, shipments, and risk events become nodes. The connections between them become typed edges: suppliesTo, dependsOn, locatedIn, certifiedBy, shipsThrough, ownedBy, or any relationship the ontology defines. Zero100 describes the distinction between knowledge graphs and ontologies as one of structure and meaning: the ontology defines the concepts and relationship types; the graph stores the connected instances that use them.[2]
| Visibility Question | Relational View | Knowledge Graph View |
|---|---|---|
| Which supplier sells this part? | Look up the supplier record linked to the purchase order. | Traverse from product to part to supplier. |
| Which upstream operation feeds this supplier? | Requires a separately modeled table or manual supplier disclosure. | Traverse from supplier to upstream supplier, site, material, or process if the relationship exists or has been inferred. |
| Which products are exposed to a location event? | Join products, suppliers, plants, and logistics data through predefined reporting logic. | Start with the affected location node and query all connected products, suppliers, lanes, and materials across hops. |
| Can the system distinguish confidence levels? | Often handled outside the core data model. | Relationship properties can mark source, timestamp, confidence, and verification status. |
The last row matters more than most vendor diagrams admit. A graph that mixes verified supplier-provided data, scraped public information, inferred relationships, and stale records without labels is not visibility. It is a more convincing way to be wrong. The graph model is useful because it can preserve relationship meaning and provenance, not because every edge in the network is automatically true.
What Multi-Hop Visibility Actually Requires
The basic graph terms are simple enough. A node is an entity: a supplier, plant, material, product, mine, warehouse, or certification. An edge is a relationship between two entities. A typed edge says what kind of relationship it is. A multi-hop query follows more than one relationship, such as product to component, component to supplier, supplier to upstream processor, processor to mining operation.
That is the difference between seeing a supplier list and asking a dependency question. A visibility team does not merely need to know that Supplier A exists. It needs to know that Supplier A manufactures Component B at Site C, that Component B goes into Product D, that Site C depends on Material E, and that Material E may originate from an upstream operation several hops away. The graph is valuable when those hops retain their meaning.
- A generic link says two records are related.
- A typed relationship says how they are related.
- A sourced relationship says where the claim came from.
- A temporal relationship says when the claim was valid or last updated.
- A confidence score or verification flag says whether the team should treat the edge as confirmed, inferred, or unresolved.
Without those distinctions, the model can still produce a network picture. It just cannot support the operational question that matters during a disruption: what is actually exposed, and how much trust should we place in that answer?
The Cambridge KG-LLM Framework Shows the Hard Part Is Feasible
The strongest evidence for this approach is not a generic claim that graphs are good at networks. It is the Cambridge University KG-LLM framework described in the arXiv paper “Enhancing Supply Chain Visibility with Knowledge Graphs and Large Language Models.” The framework uses large language models to extract supplier entities from public web data, builds a knowledge graph from those extracted entities, and applies the graph to the EV battery supply chain. The authors report 0.95 named entity recognition accuracy and show visibility extending beyond tier-2 to specific mining operations supplying critical minerals.[3]
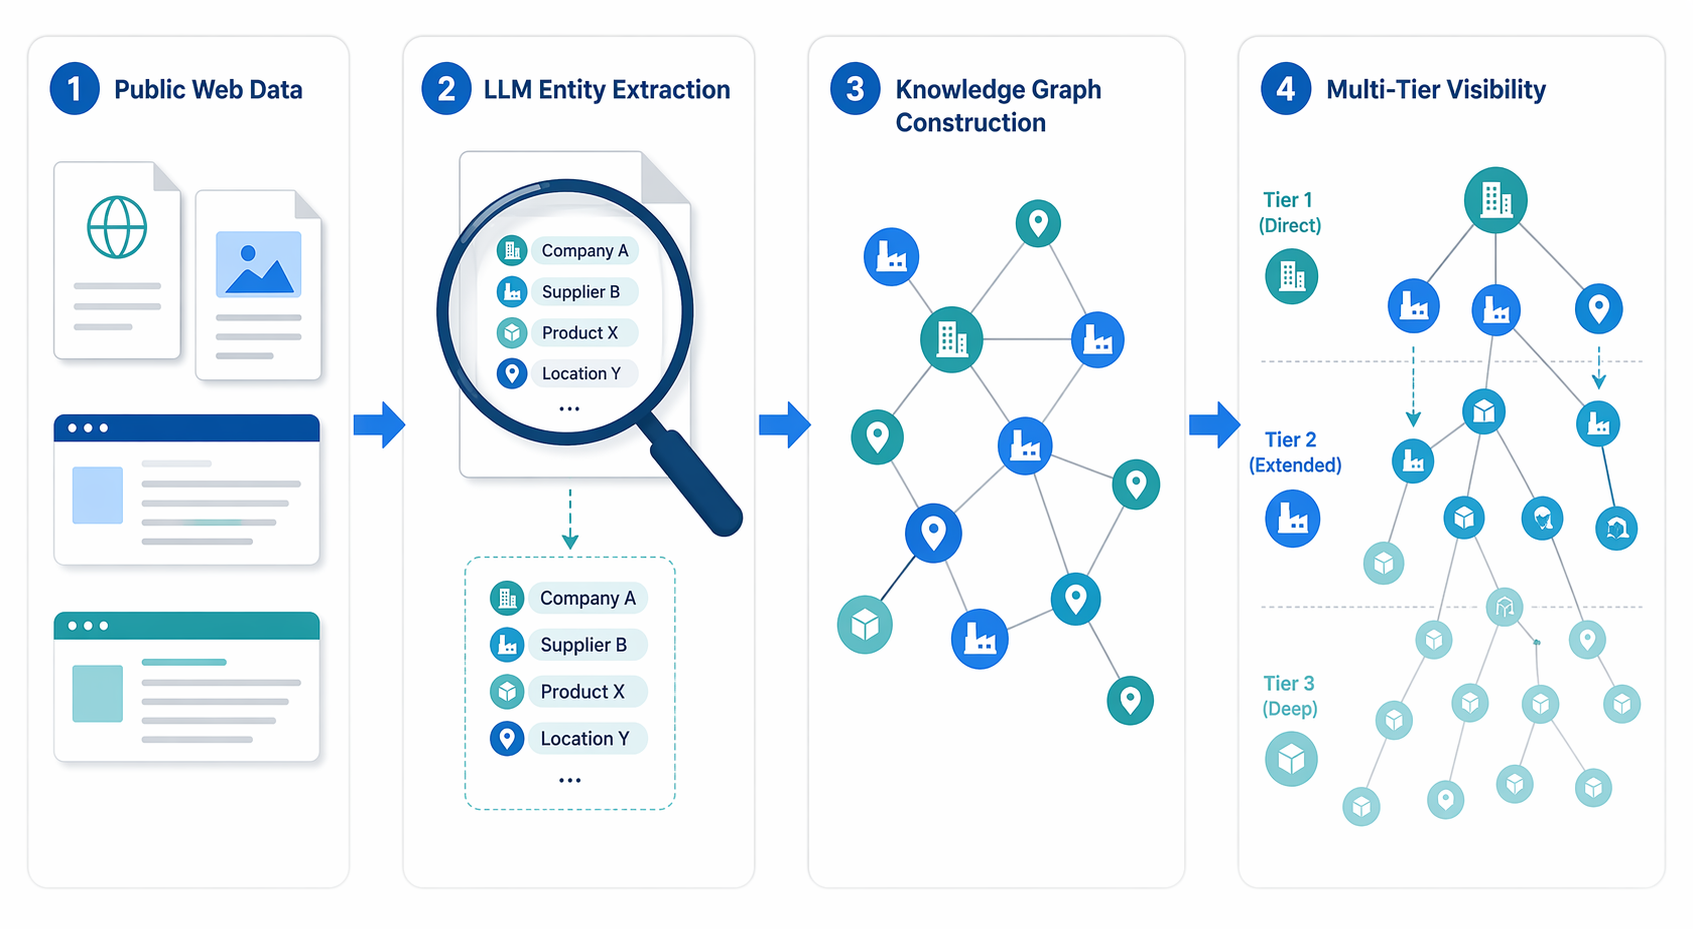
The workflow is important because it avoids the usual dead end in multi-tier visibility projects. If every upstream relationship must be collected through direct partner disclosure before the network can be queried, the program stalls at the exact point where leverage is needed. Cambridge’s approach starts from public web sources, uses LLMs to extract entities, then structures those entities into a graph that can expose upstream dependencies without waiting for every participant to submit clean data.[3]
That does not make the graph omniscient. The 0.95 figure is named entity recognition accuracy, not a guarantee that every supplier relationship in the EV battery chain was fully discovered, current, and verified. Entity extraction is one necessary part of the pipeline. Relationship inference, provenance tracking, update cadence, and validation remain separate problems. The paper is still a serious proof point because it shows that public unstructured data can be converted into a usable graph for multi-tier supply chain visibility rather than staying trapped as disconnected text.[3]
Why public data changes the economics of visibility
Direct supplier collaboration remains the higher-confidence source when it is available. But the further upstream the chain goes, the weaker the buyer’s contractual reach becomes. A tier-3 or tier-4 operation may not know the end manufacturer, may not have an incentive to share data, or may sit behind a trading, processing, or distribution layer. Public web data is imperfect, but it is often the only scalable way to assemble candidate relationships before outreach, audit, or supplier confirmation begins.
A practical system therefore separates inferred visibility from verified visibility. It can say: this product appears connected to this upstream operation through these public sources; this relationship has not yet been supplier-confirmed; this edge was last refreshed during this window; this node is a candidate for validation. That is a useful answer. It tells the risk team where to investigate instead of pretending the blind spot disappeared.
Enterprise Evidence: Useful, but Read the Label
Enterprise deployments add another kind of evidence: not proof of universal multi-tier mapping, but a signal that graph-based models can improve operational systems at scale. NebulaGraph describes ZKH’s ontology-driven supply chain knowledge graph and reports a 15% improvement in recommendation precision and a 5% increase in order conversion.[4]
Those numbers should be treated carefully. They are vendor-reported, and the public write-up does not fully detail the baseline or independent validation method. They are still relevant because they show an enterprise use case where ontology plus graph database architecture produced measurable business outcomes, not just a visual map. For a visibility leader, the lesson is not that ZKH’s results will transfer directly. It is that connected product, supplier, and transaction context can improve downstream decisions when the graph is designed around real operational questions.[4]
Vendor materials from Neo4j and TigerGraph point in the same architectural direction: graph schema design, data source integration, relationship traversal, and predictive analytics over connected supply chain data are now standard parts of the commercial conversation.[5][6] The useful evaluation question is not which diagram looks most complete. It is whether the platform can preserve relationship semantics, update the graph at the cadence your risk process needs, and expose query results in the tools where planners and risk teams actually work.
The Implementation Work That Decides Whether the Graph Becomes Useful
A supply chain visibility knowledge graph is not implemented by loading every available dataset into a graph database and hoping the network explains itself. The hard work sits in a narrower set of decisions: what the ontology must express, how entities are resolved across systems, how sources are scored, and how often the graph changes.
Start with the smallest ontology that can answer dependency questions
Ontology design is where many graph projects either become operational or become a warehouse of elegant ambiguity. The first version does not need to model every possible commercial, legal, engineering, and logistics relationship. It needs to answer the exposure questions the current system cannot answer.
- Which products depend on this supplier, material, site, or lane?
- Which upstream suppliers or operations appear connected to this direct supplier?
- Which relationships are verified by supplier disclosure, and which are inferred from public or third-party data?
- Which nodes and edges are recent enough to support a risk decision?
- Which paths connect a disruption location to affected products, customers, or inventory positions?
A minimum viable ontology might begin with products, components, suppliers, sites, materials, locations, certifications, and logistics lanes. It then defines relationship types carefully enough to prevent a meaningless graph: manufactures, supplies, dependsOn, locatedIn, shipsThrough, certifiedBy, and owns are not interchangeable. If the model cannot distinguish a supplier headquarters from a production site, or a material supplier from a distributor, the resulting query may be fast and still operationally useless.
Treat entity resolution as a control, not cleanup
Entity resolution is the quiet failure mode in multi-tier visibility. The same company can appear under legal names, trade names, translated names, abbreviations, merger histories, plant-level names, and supplier portal aliases. Public web extraction adds more variation. If those names are not resolved carefully, the graph creates duplicate nodes and broken paths. If they are merged too aggressively, it connects unrelated entities and creates false exposure.
A serious implementation needs matching rules, human review paths for high-impact merges, source provenance, and a way to undo or revise entity decisions. The graph should remember why two records were linked. A planner looking at a path from product to upstream supplier should be able to see whether the connection came from ERP data, a supplier declaration, a public document, a third-party feed, or a model-generated extraction.
Integrate sources by role, not by availability
The obvious data sources are ERP, procurement systems, supplier portals, quality systems, product lifecycle management, trade data, logistics feeds, IoT signals, and public web sources. They should not all carry the same authority. ERP may be strongest for direct spend and purchase history. PLM may be stronger for bills of material. Supplier portals may be stronger for declarations and documents. Public web sources may be stronger for discovering candidate upstream entities. IoT and logistics feeds may be stronger for current movement or site-level operating signals.
The graph’s job is to connect these sources while preserving what each source can and cannot prove. That is how the model avoids flattening a supplier’s self-declared certification, a government filing, a scraped web mention, and an internal purchase order into the same kind of fact.
Choose the graph database after the query patterns are clear
Neo4j, TigerGraph, NebulaGraph, Memgraph, and other graph databases can all appear credible in a vendor shortlist. The selection should follow the workload. A team running deep traversals across large supplier networks will evaluate different capabilities than a team embedding graph context into recommendations or risk scoring. Important questions include query language, scalability, integration with existing data platforms, access control, developer skill fit, visualization options, and support for temporal or versioned relationships.
The database decision is still secondary to the model. A fast graph database cannot rescue vague relationship types, unresolved entities, or stale data. It can only make those problems appear at greater speed.
Plan for time, not just structure
A static graph is a map of what the system believed at one point. Supply chain risk work needs to know when that belief became outdated. A supplier relationship can end. A plant can shut down. A certification can expire. A logistics lane can become constrained. A public source can be superseded. If the graph does not track freshness, a multi-hop query can produce a confident answer from obsolete edges.
Update cadence does not need to be identical for every node and edge. Direct procurement records may refresh frequently. Public web extraction may run on a scheduled crawl. Supplier declarations may change only when partners submit updates. Risk events may need near-real-time ingestion. The implementation question is whether the cadence matches the decision. Exposure analysis during a disruption has a different tolerance for stale data than an annual supplier segmentation exercise.
Where the Knowledge Graph Fits in the Visibility Stack
The graph should not replace existing control towers, supplier portals, or risk dashboards. It should sit underneath or alongside them as the connected dependency layer they usually lack. Control towers are good at presenting status. Supplier portals are good at collecting structured partner data. Risk dashboards are good at prioritizing attention. The graph is strongest when it explains how a node in one system connects to consequences in another.
For example, a disruption alert tied to a location becomes more useful when the graph can traverse from that location to sites, suppliers, materials, products, inventory, and customers. A resilience score becomes more defensible when it is based on connected dependency paths rather than supplier attributes alone. A nearshoring plan becomes less speculative when planners can see which upstream dependencies remain offshore even after final assembly moves closer to demand.
That is where the approach connects naturally to broader work in proactive supply chain risk management, AI resilience scoring, nearshoring supply chain planning, and multi-echelon inventory optimization. The same connected-network logic also overlaps with the way a digital twin supply chain represents operational entities and dependencies. The graph does not solve those adjacent problems by itself, but it gives them a better dependency model to work from.
What the Graph Can and Cannot Promise
Knowledge graphs do not eliminate the need for supplier collaboration, audits, verified partner data, or commercial pressure. They do not prove every upstream relationship simply because a model extracted a company name from a public source. They also do not make a static annual supplier map adequate for a disruption that changes by the day.
They do address the structural weakness that keeps many visibility programs trapped at tier-1. Supply chains are networks of entities and relationships. Tables can store pieces of that network, but they make dependency tracing awkward, brittle, and incomplete. A well-designed knowledge graph can connect suppliers, products, materials, locations, certifications, and events in a form that supports multi-hop queries, source provenance, and confidence-aware investigation.
The Cambridge KG-LLM framework shows that public web data and LLM extraction can extend visibility beyond tier-2 in a real EV battery supply chain context, with strong reported entity extraction accuracy.[3] ZKH’s NebulaGraph deployment shows that ontology-driven graph architecture can produce measurable enterprise outcomes, while still needing the caution owed to vendor-reported figures.[4] Between those two signals sits the practical implementation standard: meaningful ontology, disciplined entity resolution, source-aware integration, planned update cadence, and a clear separation between inferred and verified visibility.
References
- Real-world applications of knowledge graphs in supply chains, Glean
- Supply Chain's AI Building Blocks: Knowledge Graphs vs Ontologies, Zero100
- Enhancing Supply Chain Visibility with Knowledge Graphs and Large Language Models, arXiv
- Ontology Meets Graph Databases: Multi-Tier Visibility for Supply Chain Resilience, NebulaGraph
- Supply Chain Management, Neo4j
- Predictive Analytics in Supply Chain, TigerGraph
Comments
Join the discussion with an anonymous comment.