The Data Readiness Paradox: Why Most Predictive Analytics Initiatives Fail
Every logistics leader has heard the pitch: deploy predictive analytics and unlock 20% lower inventory, 15% fewer stockouts, and a logistics network that anticipates disruptions before they happen. The technology exists. The vendors are eager. The ROI case is compelling on paper. Yet the majority of organizations that attempt this transformation never reach production with a model that planners actually trust.
The root cause is almost never the algorithm. According to McKinsey research cited in multiple implementation analyses, roughly 60% of supply-chain-planning IT implementations exceed their budgets, miss their timelines, or fail to deliver the expected business outcomes. The common thread across these failures is not a shortage of ML talent or a bad model choice — it is a weak data foundation that no amount of algorithmic sophistication can compensate for.
Consider what happens when a logistics team tries to train a demand forecasting model on data from three different WMS instances, each using a different product hierarchy, inconsistent unit-of-measure codes, and timestamps that reflect when a record was entered rather than when the event actually occurred. The model trains on noise. The predictions are unreliable. The planners ignore them. The project is labeled a failure, and the organization walks away from predictive analytics for another two years.
This pattern is so widespread that it deserves a name: the data readiness paradox. Organizations invest heavily in model development and vendor selection while systematically underinvesting in the data plumbing that makes those models viable. The result is a graveyard of proof-of-concept dashboards that never made it to operational decisions.
The alternative — and the thesis of this guide — is to treat data readiness as the actual first project. Before a single model is trained, before a vendor demo is scheduled, the team must audit its data, normalize its master records, and establish the event-quality standards that make predictive analytics feasible. This is not glamorous work. It is the work that separates organizations that get value from predictive analytics from those that accumulate shelfware.
What Predictive Analytics in Logistics Actually Requires: A Data Readiness Checklist
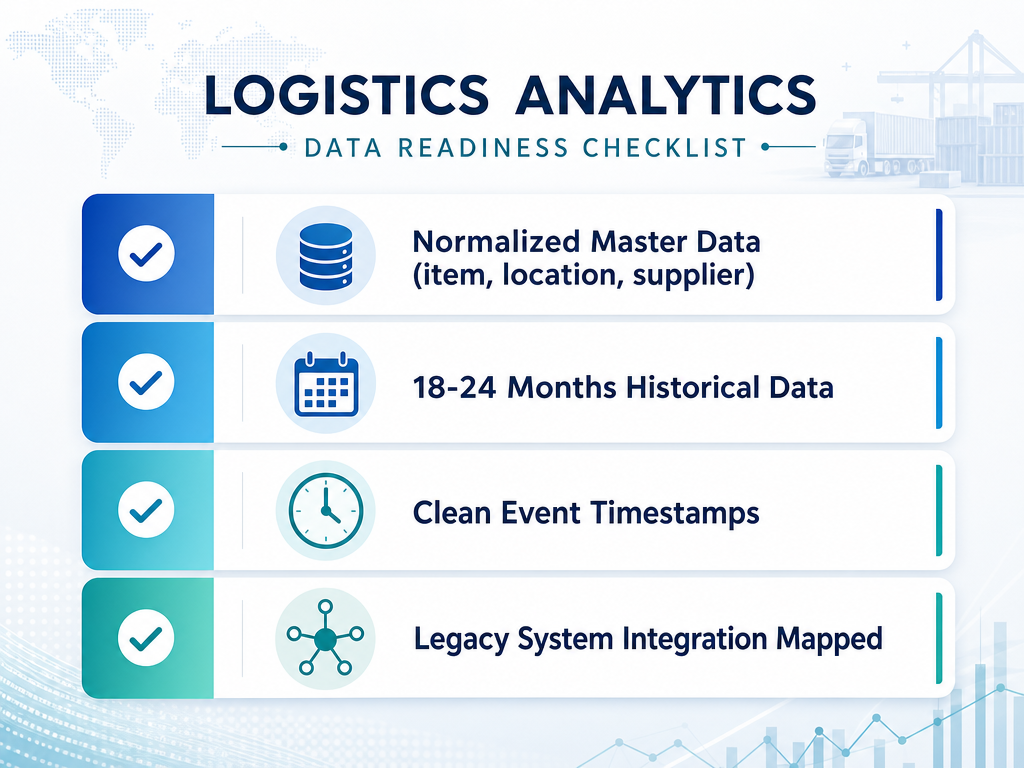
Before committing to a predictive analytics initiative, logistics leaders need a clear-eyed assessment of whether their data environment can support it. The following checklist, drawn from the BrainX implementation framework and validated against real-world deployment patterns, defines the minimum data prerequisites for a viable pilot.
| Data Requirement | Why It Matters | Typical State in Legacy Environments |
|---|---|---|
| Normalized master data (item, location, supplier, BOM, UoM) | Models cannot learn patterns from inconsistent identifiers. If the same SKU has three codes across three systems, predictions will be unreliable. | Multiple ERP instances, manual cross-references, inconsistent unit-of-measure codes (eaches vs. cases vs. pallets) |
| 18–24 months of clean historical data | Seasonal demand patterns, trend shifts, and promotional lifts require multiple cycles to train on. Less data forces the model to extrapolate from noise. | Data retention policies that purge records after 12 months; archived data in inaccessible formats |
| Clean event timestamps for stock movements, receipts, and backorders | Predictive models depend on knowing when things happened, not when they were recorded. Dirty timestamps produce misleading lead-time and velocity calculations. | Timestamps reflecting system entry time rather than event time; missing or null timestamps on critical events |
| Legacy system integration mapping | Predictive analytics requires a unified data pipeline. If data lives in siloed WMS, TMS, and ERP instances with no integration layer, the pipeline cost can exceed the model development cost. | Batch file exports, manual data pulls, no API access to core systems |
Organizations that cannot meet these prerequisites should not abandon predictive analytics. They should redirect their initial investment toward data remediation — a phase that the BrainX framework estimates at 4–8 weeks for a focused pilot, assuming source systems are accessible. The alternative, proceeding with dirty data, guarantees that the model will produce outputs that cannot be trusted, which in turn guarantees that planners will ignore the system.

The 30/60/90-Day Implementation Roadmap
The most common mistake in predictive analytics implementation is treating it as a monolithic, multi-month engineering project. The BrainX framework, developed from dozens of logistics AI deployments, advocates a different approach: a tightly scoped 30/60/90-day plan that forces the team to deliver a working, planner-facing prototype within 60 days and a production-hardened pipeline within 90.
The logic is straightforward. A focused pilot can be accomplished within 4–8 weeks if the source systems are available and the use case is narrowly bounded. Production scale typically takes 3–6 months. The 30/60/90 structure creates accountability checkpoints that prevent scope creep and surface data quality issues early, when they are still fixable.

Phase 1 (Days 1–30): Data Audit, Use Case Selection, and Baseline Measurement
The first 30 days are not about building anything. They are about understanding what you have, what you need, and where you are starting from. This phase has three parallel workstreams.
- Conduct a data audit against the readiness checklist above. For each data requirement, document the current state, the gap, and the effort required to close it. This audit becomes the basis for the data remediation plan.
- Select a single, narrow, high-impact use case. The ideal pilot use case has three characteristics: it addresses a measurable pain point (e.g., forecast accuracy for a single SKU category, ETA prediction for one lane), it has accessible data, and it has a domain expert who is willing to engage weekly.
- Establish baseline KPIs. Measure current performance on the metrics the pilot will target — forecast error, on-time delivery rate, inventory turns, or whatever is relevant. Without a baseline, you cannot demonstrate improvement.
Phase 2 (Days 31–60): MVP Pipeline, Baseline Model, and Workflow Prototype
With the data audit complete and the use case selected, the second phase shifts to building. The goal is not a production-grade system. It is a working prototype that a domain expert can interact with and provide feedback on.
- Build a minimal viable data pipeline that extracts, cleans, and joins the data required for the pilot use case. This pipeline does not need to be elegant. It needs to be functional and reproducible.
- Train a simple baseline model — a time series model for demand forecasting, a regression model for ETA prediction. Model complexity is secondary to getting a working feedback loop with domain experts. A simple model that planners trust is more valuable than a sophisticated model they ignore.
- Prototype the workflow integration. How will planners see the predictions? How will they provide feedback? How will the system learn from corrections? The workflow design is often harder than the model design.
The BrainX framework emphasizes that the MVP pipeline should be built with the expectation that it will be rebuilt. The purpose of Phase 2 is to surface integration challenges, data quality issues, and workflow friction points while the stakes are still low.
Phase 3 (Days 61–90): Production Hardening, Monitoring, and Repeatable Template
The final phase transforms the prototype into a production system and documents the process so it can be repeated for additional use cases.
- Harden the pipeline for production: automate data ingestion, implement error handling, establish SLAs for data freshness, and document the system architecture.
- Implement model monitoring for drift and accuracy. A model that is not monitored will degrade silently. Establish thresholds for retraining and a process for model updates.
- Document the process as a repeatable template. The goal is to create a playbook that the team can use to add new use cases in 4–6 weeks instead of starting from scratch each time.
As the organization gains confidence, the natural progression is from single-echelon to multi-echelon planning — moving from optimizing inventory at one node to optimizing across the entire network. For a deeper dive on this topic, see our Multi-Echelon Inventory Optimization (MEIO): Definition, AI Techniques, and Supply Chain Applications glossary entry.
Team Roles and Hidden Costs You Cannot Ignore
Predictive analytics initiatives fail as often from organizational gaps as from technical ones. The team structure and the hidden costs of implementation are two areas where vendor narratives routinely diverge from operational reality.
| Role | Primary Responsibility | Time Commitment |
|---|---|---|
| Product Owner | Owns the use case backlog, prioritizes features, manages stakeholder expectations, and ensures the project delivers business value. | Full-time during pilot; 50% during scale-up |
| Data Engineer | Builds and maintains the data pipeline, handles data quality, integrates source systems, and ensures data freshness. | Full-time through Phase 3 |
| ML Engineer | Selects, trains, and validates models; implements monitoring; manages model versioning and retraining. | Full-time through Phase 3 |
| Domain SME (Subject Matter Expert) | Provides domain knowledge, validates model outputs, identifies edge cases, and champions adoption within the operations team. | Weekly engagement minimum; more during Phase 2 |
| DevOps / MLOps Engineer | Manages infrastructure, deployment pipelines, monitoring, and incident response for production systems. | Part-time during pilot; full-time at production scale |
Beyond the team, there are hidden costs that rarely appear in vendor proposals but consistently surface during implementation.
- Master data reconciliation. If your item master, location hierarchy, or supplier identifiers are inconsistent across systems, someone must clean them. This is manual, tedious, and expensive. Budget for it.
- Legacy system integration. Many logistics systems predate modern API standards. Extracting data from them may require custom connectors, middleware, or manual exports. The integration cost can exceed the model development cost.
- Exception workflow redesign. Predictive analytics changes how planners work. If the system predicts a stockout, what does the planner do differently? Redesigning exception workflows requires process mapping, training, and change management.
- Planner retraining. Planners who have relied on intuition for years must learn to trust — and challenge — model outputs. This is a cultural shift, not a training course.
- Model monitoring infrastructure. A model in production requires ongoing monitoring for drift, accuracy degradation, and data quality issues. This infrastructure is rarely included in initial project budgets.
Measuring Success: KPI Map from Model Output to Financial Impact
One of the most common reasons predictive analytics initiatives lose executive support is a failure to connect model outputs to business outcomes. The team celebrates a 15% improvement in forecast accuracy, but the CFO asks why logistics costs did not decrease. The disconnect is predictable: model metrics are not business metrics.
The following KPI map shows how model-level metrics cascade through operational metrics to financial outcomes. Use this framework to build your business case and to track whether the model is actually delivering value.
| Model Output Metric | Operational Metric | Financial Outcome | Benchmark Range (McKinsey) |
|---|---|---|---|
| Forecast accuracy (MAPE, WAPE) | Fill rate, stockout rate, inventory turns | Logistics cost reduction, working capital improvement | 5–20% logistics cost reduction; 20–30% inventory reduction |
| ETA prediction precision | On-time delivery rate, dock utilization, detention cost | Reduced expedited shipping costs, lower detention fees | 5–15% procurement spend reduction |
| Demand sensing accuracy | Promotional fill rate, markdown rate, freshness waste | Revenue protection, margin improvement | 20–50% forecast error reduction |
| Predictive maintenance accuracy | Vehicle uptime, unplanned downtime, repair cost per mile | Lower maintenance spend, higher asset utilization | Up to $2,500 per truck annual savings (Forbes, waste fleet context) |
The critical insight from this KPI map is that model accuracy improvements do not automatically translate to financial outcomes. If the model predicts a stockout but the planner does not act on the prediction, the fill rate does not improve. If the ETA prediction is accurate but the dock scheduling system ignores it, detention costs do not decrease. The workflow integration — the human and process layer — is what converts model outputs into business value.
Common Pitfalls and How to Avoid Them
The following pitfalls appear consistently across predictive analytics implementations in logistics. Each is avoidable with the right upfront investment.
- Skipping the data audit. Organizations that proceed directly to model development without auditing their data quality inevitably discover critical gaps mid-project. The result is schedule overruns and budget overruns. Avoidance strategy: treat the data audit as a non-negotiable Phase 1 deliverable with a hard stop. If the data is not ready, the project does not proceed.
- Choosing too broad a use case. The most common failure pattern is attempting to predict demand for 50,000 SKUs across 20 distribution centers in the first pilot. The data complexity overwhelms the team, and nothing ships. Avoidance strategy: bound the pilot to a single SKU category and a single node. Prove the approach works before scaling.
- Neglecting workflow integration. A model that produces accurate predictions but is not integrated into the planner's workflow will be ignored. Avoidance strategy: design the workflow integration in Phase 1, before the model is built. How will the planner see the prediction? How will they act on it? How will they provide feedback?
- Underinvesting in change management. Planners who have spent years developing intuition about demand patterns will not automatically trust a model. Avoidance strategy: involve domain SMEs from day one, give them ownership of model validation, and celebrate early wins that the model enabled.
- Treating the model as a one-time build. Models degrade. Data distributions shift. Business conditions change. A model that is not monitored and retrained will become less accurate over time. Avoidance strategy: budget for model monitoring infrastructure from the start, and establish a retraining cadence based on observed drift.
For a broader view of how AI adoption is progressing across supply chain functions, including benchmark data on deployment maturity and investment intent, see our Gartner 2024 Supply Chain Technology Adoption Report: AI Planning Benchmarks.
Comments
Join the discussion with an anonymous comment.