
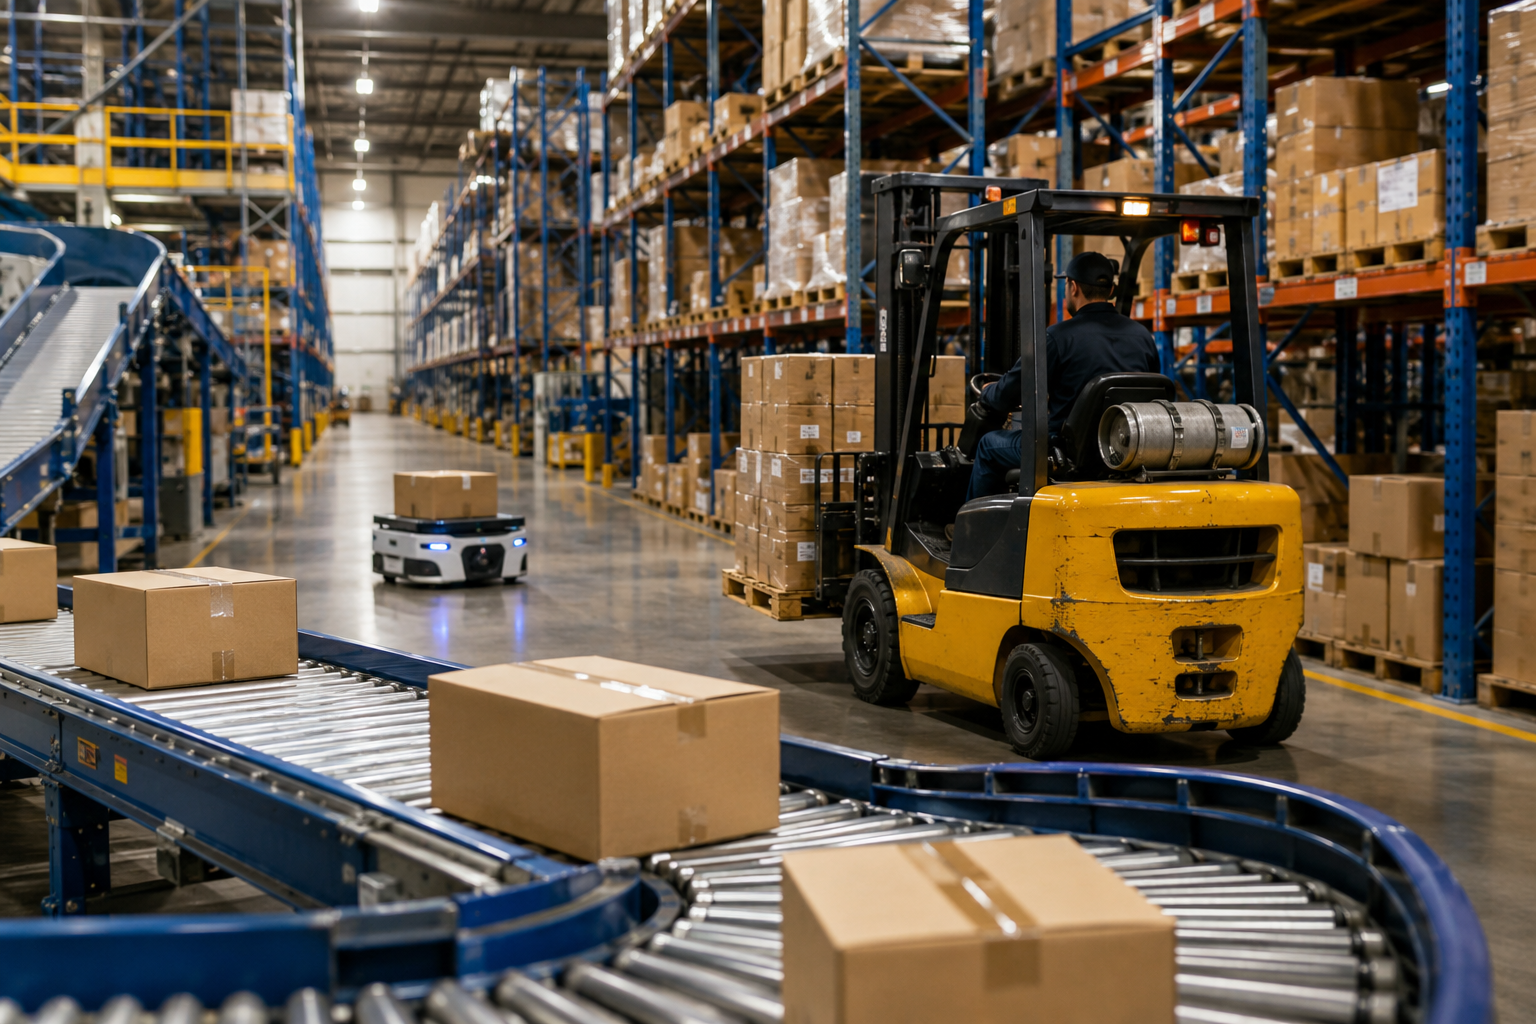
The hard part of planning predictive maintenance for logistics equipment is not deciding whether early warnings are useful. It is deciding which warning deserves the first budget line. A warehouse may have conveyors feeding outbound sortation, forklifts doing high-density putaway, and AGVs crossing the same aisles. Each failure stops work differently. A conveyor drive failure during peak sortation can strand 8,000+ packages per hour, while a downed AGV blocking an aisle has been benchmarked at $4,500+ per hour in missed SLA exposure and overtime; forklift emergency replacement events tied to motor controller or hydraulic drift are cited at $6,000+ per event in iFactory’s warehouse intelligence materials.[1] Emergency repair economics are no kinder on fleet equipment: FleetRabbit reports emergency repairs costing 4–5x more than planned maintenance, towing averaging $650 per incident, and a single emergency brake system repair costing $3,200+.[2]
Those are not universal savings promises. They are cost signals. The denominator still matters: how many assets are running, when they fail, how often they fail, and whether the avoided cost is true downtime, emergency parts, towing, overtime, missed SLA penalties, or maintenance labor shifted to a calmer window. The best first deployment is usually the asset category where one preventable failure creates the most expensive operational mess.
Start With The Failure That Forces The Worst Rework
A clean ROI spreadsheet can hide the part operations leaders feel first: who gets pulled off planned work when a lane goes down. If a sortation lane stops during a peak outbound wave, the problem is not only a bearing, drive, or motor. It is packages backing up, pickers waiting for release, shipping supervisors calling for manual workarounds, maintenance techs being pulled from preventive work, and overtime being approved before anyone has written the incident report.
That is why the first question should be operational, not technical: which equipment failure creates the highest-cost interruption in this building?
| Asset category | Failure economics to test first | When it is likely to be the first ROI case |
|---|---|---|
| Conveyors and sortation | Stranded package flow, missed ship windows, overtime, lane rebalancing | Automated or high-throughput facilities where outbound volume depends on continuous package movement |
| Forklifts | Emergency replacement, towing or service response, putaway delays, aisle congestion, labor rescheduling | Manual or mixed warehouses where lift trucks are the daily constraint |
| AGVs | Battery decay, blocked aisles, cascading delays across automated flows | Facilities with enough AGV density that one stalled vehicle disrupts multiple movements |
The comparison is not a ranking for every site. A manual facility with a small conveyor spur should not start with conveyors just because sortation failures look dramatic in a large automated DC. A facility with a dense outbound sorter should not start with lift trucks simply because the forklift fleet is bigger. Asset count is not the same as failure cost.
Conveyors And Sortation: Highest Impact When Throughput Is Concentrated
Conveyors earn the first look in automated distribution centers because they concentrate volume. A forklift failure can strand one operator and one load path. A sortation failure can strand the work of many upstream stations at once. iFactory’s June 2026 logistics maintenance benchmark cites conveyor drive failure during peak sortation as capable of stranding 8,000+ packages per hour.[1]
That number matters because it points to where the cost actually sits. The maintenance part may be modest compared with the operating consequence. Once a critical lane is down, supervisors may have to divert cartons, resequence waves, open manual processing, or hold labor past the planned cutoff. If the facility is shipping to carrier deadlines, the clock is not waiting for a root-cause review.
The predictive maintenance case for conveyors is strongest when the monitored failure mode has a visible pre-failure signature. iFactory reports that conveyor bearing wear can be detected 15–45 days before failure through AI analysis of current draw, vibration envelope, and temperature trends.[1] That does not mean every belt, roller, or motor will produce a perfect warning. It does mean the business case can be built around a narrow and defensible claim: catch bearing or drive degradation early enough to schedule work before the next high-volume window.
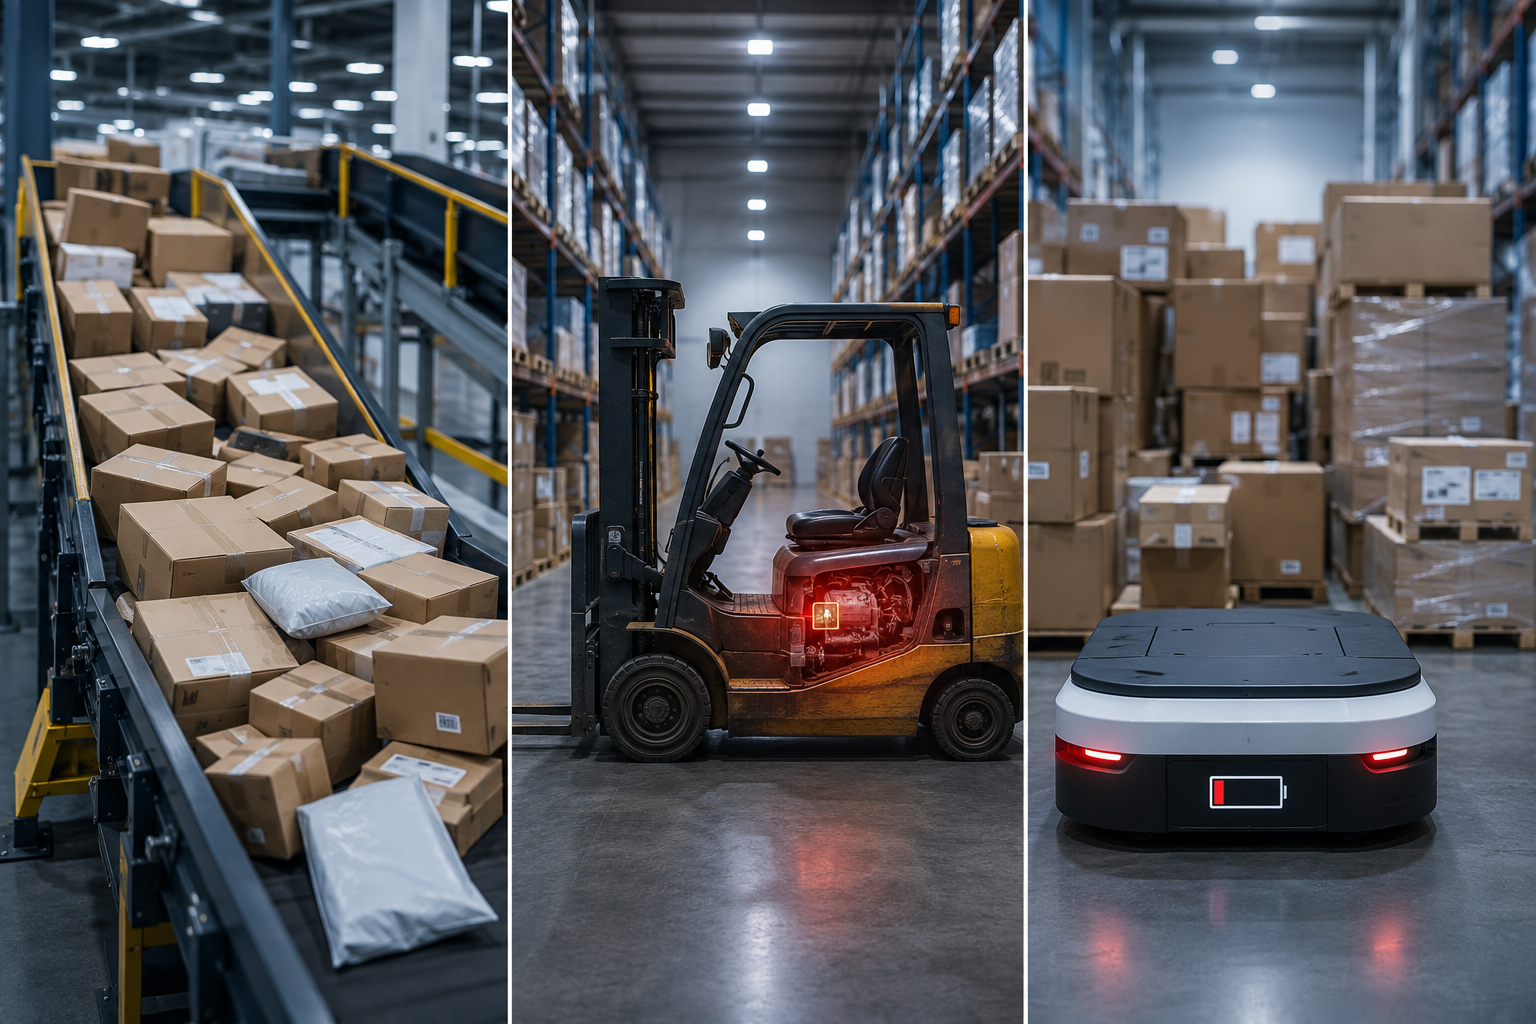
For a 90-day business case, the conveyor pilot should avoid trying to instrument the whole material handling system on day one. Pick the lanes where a stoppage forces the most rework: outbound sortation, induction, merge points, or any zone where one stalled drive blocks multiple downstream destinations. The maintenance director should already know which lane gets mentioned first on escalation calls. That is the lane where predictive maintenance has a chance to prove itself quickly.
A useful conveyor ROI case tracks more than avoided part replacement. It should record avoided downtime windows, emergency callouts avoided, overtime reduced or prevented, packages not delayed, and planned maintenance hours moved into scheduled access windows. Without those fields, the pilot risks looking like a sensor project instead of a throughput protection project.
Forklifts: The Faster First Case In Many Manual And Mixed Warehouses
Forklifts deserve nearly as much attention as conveyors because many warehouses still move their day by lift truck. The failure is smaller in blast radius than a major sorter outage, but it is often easier to recognize, easier to price, and easier to explain to finance. When a lift truck fails during high-density putaway, the problem is not just a repair order. A dock door waits, pallets stack in the wrong place, an aisle may clog, and another operator or spare unit has to be found.
iFactory’s warehouse intelligence practice cites forklift emergency replacement costs averaging $6,000+ per event when motor controller or hydraulic drift leads to failure during high-density putaway.[1] FleetRabbit’s case study gives the broader emergency-maintenance context: emergency repairs cost 4–5x more than planned maintenance, towing averages $650 per incident, and a single emergency brake system repair on a fleet vehicle costs $3,200+.[2]
The better forklift pilot is not usually “monitor every truck.” It is to start with the trucks whose failure forces the most expensive substitution. That may be the high-use units assigned to receiving, freezer operations, narrow-aisle putaway, or replenishment during outbound waves. A truck used occasionally as backup may have poor predictive maintenance ROI even if it is old. A newer truck that runs hard in the building’s most constrained process may be the better first monitor.
The detectable warning signs are practical rather than exotic. iFactory and FleetRabbit both identify forklift motor controller degradation as detectable 15–45 days before failure, using patterns such as current draw, temperature trends, and related condition signals.[1][2] That window is valuable because it gives maintenance time to order parts, schedule the unit off shift, swap assignments, and avoid emergency replacement during the work window that needed the truck most.
Forklift ROI also tends to be easier to defend in buildings where workarounds are visible. Everyone can see the idle operator, the pallet left in staging, and the supervisor looking for a spare. That visibility helps the first 90-day case, especially in operations where conveyor failures are rare or where the conveyor footprint is limited.
AGVs: Battery Health Becomes ROI When One Stoppage Blocks Many Moves
AGVs sit in a different category. Their predictive maintenance ROI is less about one mechanic responding to one disabled vehicle and more about network effect. If an AGV loses battery performance gradually, route reliability may degrade before anyone calls it a failure. If it stalls in the wrong aisle, other automated moves can stack up behind it.
iFactory’s benchmark cites a downed AGV blocking an aisle at $4,500+ per hour in missed SLA costs and overtime exposure.[1] That figure should be treated as a scenario benchmark, not a blanket assumption for every warehouse with a small autonomous fleet. The same blocked aisle means very different things in a dense robotic picking operation than it does in a facility with a few vehicles running low-frequency replenishment.
The AGV case becomes compelling when battery decay, charging behavior, and route blockage risk are tied to real operating consequences. If vehicles are missing assignments, returning to charge earlier than expected, or creating repeated traffic exceptions, monitoring battery health moves from “nice analytics” to queue protection. If AGVs are not yet a throughput constraint, they may belong in a second phase after conveyors or forklifts have already paid for the program.
What Multi-Asset Results Can And Cannot Prove
Large multi-asset deployments show that predictive maintenance can matter across a facility, but they do not automatically answer which asset should go first. TMA Solutions describes a warehouse deployment across 12 fulfillment centers monitoring 800+ conveyors, 250 AGVs, and 1,200 robotic arms, reporting a 48% reduction in unplanned downtime and 35% lower maintenance costs.[3]
Those results are useful because they show the scale of possible maintenance impact when monitoring reaches multiple equipment categories. They are less useful as a direct conveyor-versus-forklift-versus-AGV ranking, because the public summary does not isolate the savings by asset class, baseline failure rate, operating hours, or starting maintenance maturity. A facility leader can cite the result as broader ROI evidence, but the first-phase business case still has to be built from local failure economics.
For broader sourced ROI examples across supply chain use cases, see predictive analytics in supply chain use cases and the real ROI of predictive analytics in supply chain. Those comparisons are helpful once the warehouse team has already separated adoption claims from avoided-cost evidence.
A Phased Deployment That Finance Can Understand
The safest implementation path is not necessarily the slowest. It is the one that avoids turning a maintenance pilot into a facility-wide systems integration project before the first avoided failure has been counted.
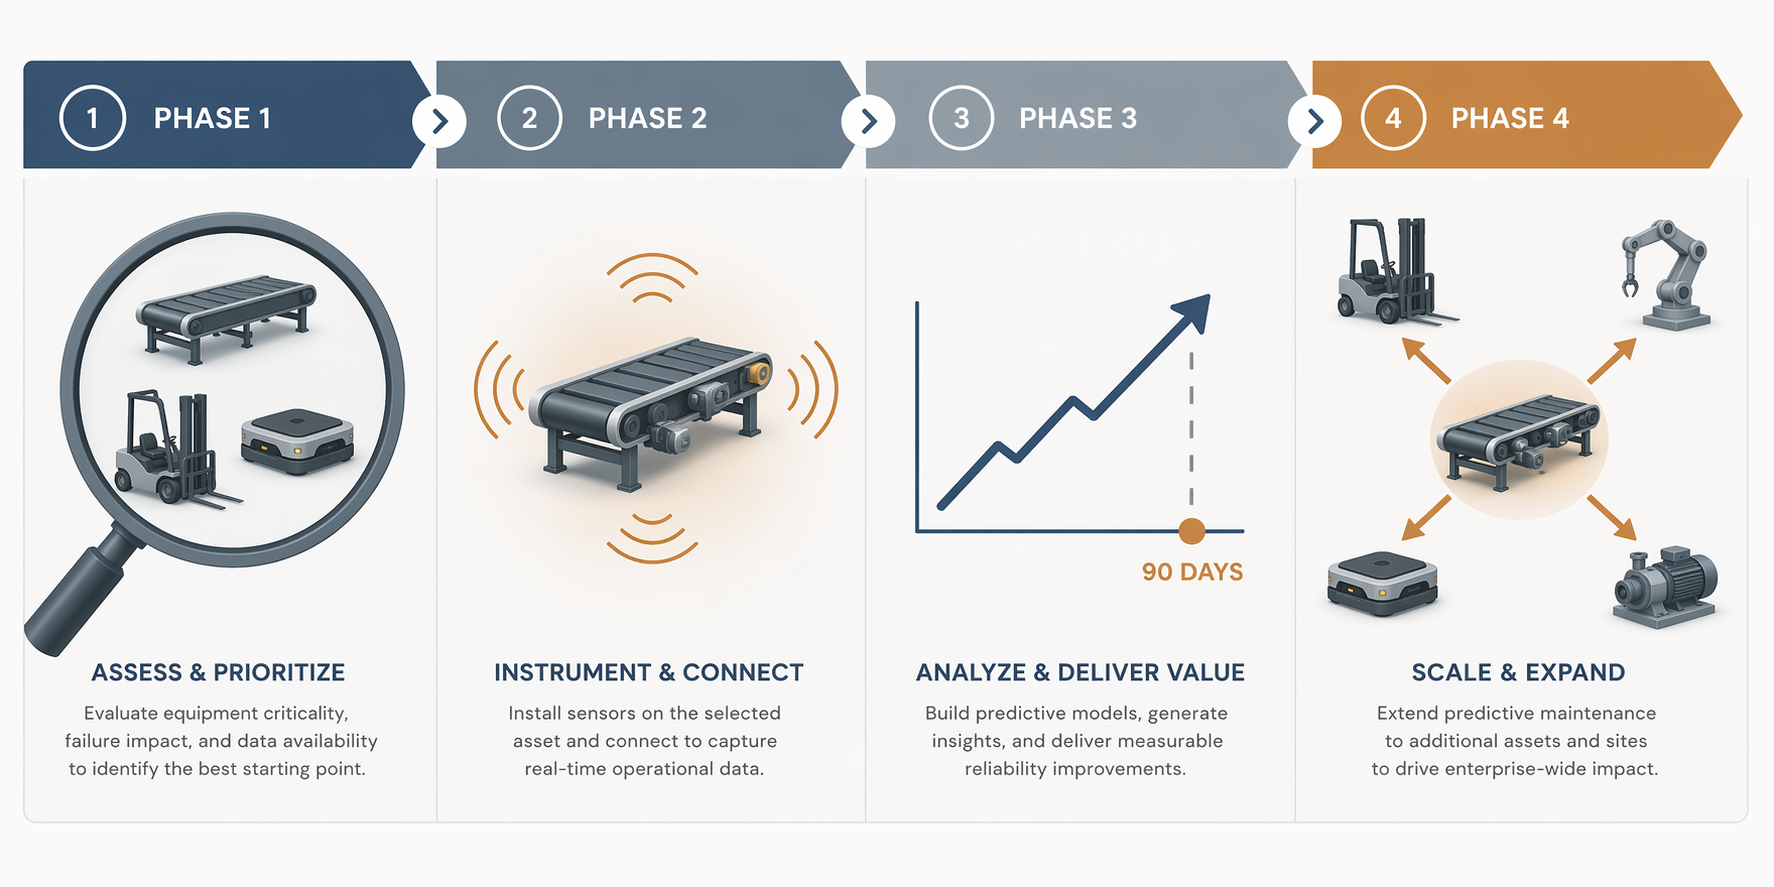
- Identify the highest-cost failure mode: not the oldest asset, not the largest fleet, but the failure that creates the most expensive interruption.
- Monitor one asset category first: conveyors, forklifts, or AGVs, depending on where the cost concentrates.
- Prove ROI within 90 days: track avoided downtime, emergency repair avoidance, overtime impact, missed SLA exposure, and maintenance labor shifted into planned windows.
- Expand sequentially: add the next asset category only after the first one has produced evidence the operations and finance teams both accept.
iFactory reports that warehouses starting with one high-impact asset type and proving ROI within 90 days achieved phased expansion in 14–30 days, compared with 12–18 months for organizations attempting simultaneous multi-system deployment.[1] That is vendor-originated deployment data, so it should not be treated as a guaranteed schedule. It is still a useful warning: all-at-once rollouts can spend months reconciling systems before anyone has proven which failure was worth monitoring first.
A phased sequence also makes procurement easier to defend. The first purchase is tied to a named failure mode. The first dashboard is tied to a named operating consequence. The first expansion request is tied to actual avoided disruption, not a broad claim that predictive maintenance is modernizing the warehouse.
For a more detailed implementation route, see the 90-day predictive analytics in logistics roadmap. If the harder question is matching equipment priority to facility profile, the warehouse AI decision framework is the better starting point.
How To Choose The First Asset Category
In an automated, high-throughput facility, conveyors and sortation usually deserve the first predictive maintenance pilot because one mechanical failure can interrupt a large volume of package flow. The strongest first case is a lane, drive, bearing group, or merge point where maintenance can connect early warning signals to avoided peak-window stoppage.
In a manual or mixed warehouse, forklifts may be the faster ROI case. Their failures are familiar, their emergency costs are easier to explain, and their operational consequences are visible on the floor. If high-use lift trucks are already causing putaway delays, emergency replacement, or repeated service calls, a forklift pilot may beat a conveyor pilot even if conveyors look better in generic ROI materials.
In AGV-heavy operations, battery health and blockage risk should move up the list before small performance losses become queue failures. The practical test is density: if one stalled vehicle blocks multiple routes, the AGV fleet is no longer a secondary maintenance concern.
The budget decision becomes defensible when it names the failure, the cost, the monitored signal, and the review window. Start with the asset category where a preventable failure hurts the facility most, prove the avoided cost within 90 days, and then expand with evidence instead of optimism.
References
- Predictive Maintenance Logistics Warehouse Operations, iFactory, June 2026.
- AI Predictive Maintenance Results, FleetRabbit, March 2026.
- Predictive Maintenance in Warehouses: Using AI to Reduce Downtime and Equipment Failure, TMA Solutions, January 2026.
Comments
Join the discussion with an anonymous comment.