Benchmarking predictive analytics in supply chain management gets messy because the phrase is used for very different investment patterns. A forecast model that changes the monthly demand plan is not the same business case as a routing engine that cuts miles, a maintenance model that prevents line stoppages, or a supplier-risk score that moves a purchase order before disruption hits.
That distinction matters when a buyer has to defend funding. The useful question is not whether predictive analytics is “transformative.” It is where the prediction enters the operating rhythm, which decision it changes, what data it depends on, and which financial or service metric should move afterward.

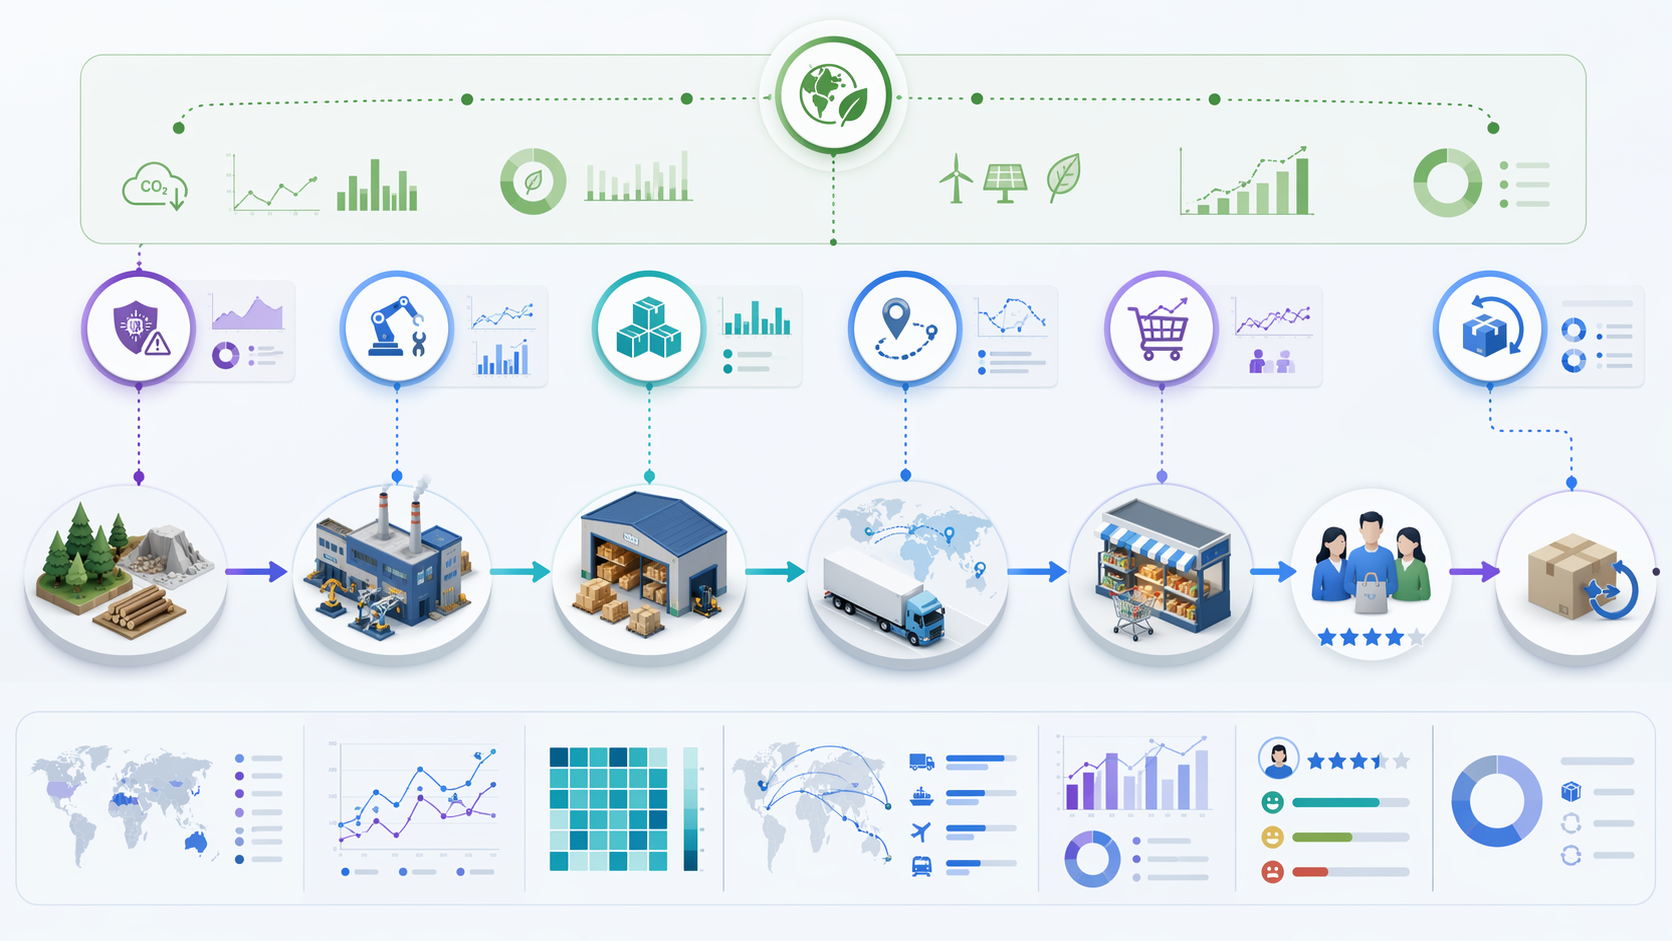
Seven predictive analytics use cases worth separating
The same platform may support several of these use cases, but the business case should not be blended too early. Each pattern has a different data burden and a different proof point.
| Use case | Supply chain function | Typical data inputs | Likely model family | Documented ROI or outcome benchmark | Named example or source | Caveat |
|---|---|---|---|---|---|---|
| Demand forecasting | S&OP, demand planning, replenishment | Order history, shipments, promotions, price, seasonality, channel signals, external demand drivers where available | Time-series forecasting, regression, machine learning ensembles, causal forecasting | McKinsey benchmark cited as 20–50% forecast error reduction | McKinsey figure cited by KNIME | Secondary-cited benchmark; original methodology should be verified before using it as a formal investment assumption [1] |
| Inventory optimization | Inventory planning, working capital, service-level planning | SKU-location inventory, demand variability, lead times, supplier performance, service levels, carrying costs | Probabilistic inventory optimization, simulation, predictive replenishment, optimization models | Kärcher reported 15% inventory value reduction; SR Analytics cites 15–28% carrying cost reduction from client data | SR Analytics | Client and case-derived results are useful as ranges, not guarantees [2] |
| Logistics routing | Transportation, last-mile delivery, network operations | Orders, stops, traffic, distance, constraints, delivery windows, vehicle capacity, driver rules | Route optimization, predictive ETA models, constraint optimization | UPS ORION associated with $300–400 million annual savings and 100 million miles reduced | UPS ORION example cited by Lumi AI | A mature, high-scale case; not a baseline for every fleet [3] |
| Supplier risk scoring | Procurement, supplier management, continuity planning | Supplier performance, quality, financial indicators, geopolitical signals, logistics signals, external risk feeds | Risk scoring, classification, anomaly detection, early-warning models | Boeing example describes multi-signal supplier risk analytics rather than a single-score supplier dashboard | Boeing example discussed by EY | Outcome is often avoided disruption or earlier intervention, which can be harder to express as direct ROI [4] |
| Predictive maintenance | Manufacturing, fleet, warehouse automation, asset reliability | Sensor data, machine logs, maintenance history, operating conditions, failure events | Failure prediction, anomaly detection, remaining-useful-life models | GM benchmark cited as 20% reduction in unplanned downtime | RTS Labs | Requires enough failure and maintenance-history data to avoid weak signals [5] |
| Reverse logistics prediction | Returns, service operations, inventory recovery | Return history, product attributes, customer behavior, reason codes, channel, refurbishment or resale outcomes | Return-propensity models, classification, recovery-value prediction | Amazon is cited for anticipatory returns positioning | LatentView | The sourced material supports the operating concept more than a quantified ROI benchmark [6] |
| ESG and carbon compliance prediction | Sustainability planning, transport planning, reporting, compliance | Shipment lanes, modes, energy use, facility data, supplier data, emissions factors, regulatory requirements | Emissions forecasting, scenario modeling, optimization, compliance-risk prediction | DHL target cited as 30% CO₂ reduction | RTS Labs | Treat as a planning and compliance signal, not proof that predictive analytics alone delivers the full reduction [5] |
One adoption figure is worth treating carefully before moving deeper. PwC’s 2026 Digital Trends in Operations Survey says 66% of respondents apply AI-enabled tools to planning and forecasting, but “AI-enabled tools” is wider than predictive analytics and may include automation, generative interfaces, and other decision-support capabilities [7]. It is useful context for planning digitization, not a clean measure of predictive analytics maturity.
Demand forecasting: the benchmark everyone wants, and the one to verify first
Demand forecasting is usually the first use case executives ask about because its consequences are visible everywhere: production plans, procurement commitments, deployment, service levels, and inventory write-offs. A better forecast does not create value by existing in a dashboard. It creates value when it changes a planning decision soon enough for the business to buy differently, produce differently, or allocate differently.
The most useful benchmark in the source set is the McKinsey figure, cited by KNIME, that predictive analytics can reduce forecast error by 20–50% [1]. That is a meaningful range for a business case, especially when a planning leader needs to compare a proposed model against today’s mean absolute percentage error, bias, or service-level misses. It should also be handled as a secondary-cited figure. Before a team builds a board-level savings estimate on the high end of the range, the original methodology, product scope, and baseline forecast quality should be checked.
The data requirement is heavier than many demos imply. A credible model needs enough clean history to separate recurring seasonality from one-time events, enough master data to know what the product and customer actually are, and enough causal information to understand promotions, price changes, channel shifts, and supply constraints. If the shipment record reflects stockouts, allocation, or substitutions, the model is learning constrained demand rather than true demand unless the planning team corrects for that.
This is where model family matters. Classical time-series models can still perform well for stable products with reliable history. Machine-learning ensembles may help when demand depends on many interacting variables, such as channel, geography, price, and promotion. Causal forecasting becomes important when planners need to explain why the forecast changed, not only improve the error metric. For deeper benchmark detail, the companion discussion on AI demand forecasting accuracy is the better place to pressure-test what a realistic improvement range looks like by forecast horizon and baseline maturity.
The operating test is simple: does the forecast feed the actual cadence of S&OP, replenishment, or allocation? A daily model that nobody reviews until the monthly demand meeting may be technically impressive and operationally late. A less sophisticated model that changes reorder quantities, exception queues, or deployment decisions at the right moment can produce more value.
Inventory optimization: where forecast improvement becomes cash
Inventory optimization is often sold as the natural downstream benefit of better forecasting, but it deserves its own business case. Forecast accuracy can improve while inventory stays stubbornly high if planning parameters, service-level policies, lead-time assumptions, and replenishment rules do not change.
The sourced benchmarks are concrete enough to be useful. SR Analytics cites Kärcher’s 15% inventory value reduction and reports a 15–28% carrying cost reduction range from client data [2]. Those figures point to a different value pool than the forecasting metric. The CFO does not bank forecast accuracy; the CFO sees lower working capital, reduced obsolescence, lower storage and handling cost, or fewer emergency buys.
The inventory model needs inputs that forecasting models can sometimes avoid: current stock by SKU-location, safety-stock logic, supplier lead-time variability, minimum order quantities, shelf life, substitution rules, service-level targets, and carrying-cost assumptions. If those inputs are unreliable, the model may produce recommendations that look precise but fail in the planner’s hands. This is why an inventory data-readiness assessment belongs before the software shortlist, not after contract signature.
The strongest inventory use cases usually connect prediction and optimization. The predictive layer estimates future demand, lead-time risk, or depletion probability. The optimization layer decides how much inventory to hold, where to position it, and when the service-level tradeoff is worth the working-capital cost. Treating those as one black-box “AI recommendation” makes it harder to diagnose whether a bad outcome came from weak demand sensing, bad policy parameters, or an unworkable replenishment constraint.
Logistics routing: prediction only pays when dispatch decisions change
Routing is the clearest example of predictive analytics producing operationally visible savings at scale. UPS ORION is associated with $300–400 million in annual savings and a reduction of 100 million miles, according to the Lumi AI source [3]. Those numbers are valuable because they connect the analytic system to a physical operating metric: miles driven.
That does not make ORION a universal benchmark. A parcel network with dense stops, disciplined scan data, and high route repeatability is not the same as a regional distributor with volatile order cutoffs and manual dispatch overrides. The transferable lesson is the operating mechanism: predictions about travel time, stop sequence, constraints, and delivery windows are embedded in the route plan before the driver leaves, not reviewed afterward in a performance dashboard.
For teams evaluating transportation analytics, the ROI indicator should match the routing decision. If the model changes route sequence, watch miles, fuel, driver hours, stops per route, and on-time delivery. If it predicts ETAs, watch customer-service contacts, appointment failures, detention, and exception handling. If it supports load consolidation, watch utilization and tender acceptance. Lumping those into one “logistics analytics” metric obscures which decision actually improved.
A logistics-specific use-case library can go deeper into routing, ETA prediction, fleet maintenance, and warehouse execution. In a supply-chain-wide investment view, routing is one pattern among several: high-volume, constraint-heavy, and strongest when the prediction is pushed directly into dispatch.
Supplier risk scoring: not just a prettier scorecard
Supplier risk scoring becomes predictive only when it pulls together signals early enough to change sourcing, expediting, inventory, or qualification decisions. A quarterly supplier scorecard that summarizes late deliveries and defects may be useful governance, but it is mostly retrospective. Predictive risk scoring asks whether the next order, next lane, or next supplier commitment is becoming fragile.
The Boeing example cited by EY is useful because it describes supplier risk through multiple signals rather than a single procurement metric [4]. In practice, those signals may include performance history, quality problems, capacity constraints, financial indicators, geopolitical exposure, logistics disruption, and external risk feeds. The model’s purpose is not only to rank suppliers; it is to trigger earlier action by procurement, planning, or operations.
The ROI is harder to package than a freight-mile reduction. Avoided disruption does not always show up as a clean savings line, and a risk intervention can look unnecessary if the event never materializes. That is why supplier-risk business cases should define intermediate metrics: lead time to intervention, number of high-risk suppliers with mitigation plans, reduction in single-source exposure, fewer premium-freight events linked to supplier misses, or faster alternate-source activation.
For procurement teams, the distinction from ordinary supplier management is material. A predictive risk system should influence award decisions, dual-sourcing priorities, safety-stock policy, or supplier-development work. If it only creates a new heat map for the quarterly business review, it may be analytics, but it is not yet an operating capability.
Predictive maintenance: asset data must meet maintenance action
Predictive maintenance sits at the boundary between supply chain, manufacturing, warehousing, and fleet operations. Its value depends on whether a predicted failure can be converted into a scheduled intervention before the asset disrupts production, fulfillment, or transport.
RTS Labs cites a GM benchmark of 20% reduction in unplanned downtime [5]. That is a useful outcome metric because unplanned downtime has a direct operating consequence: lost capacity, missed schedules, overtime, service failures, or expensive emergency maintenance.
The data burden is different from demand planning. Predictive maintenance typically needs sensor readings, operating conditions, fault codes, maintenance work orders, asset age, utilization, and enough historical failure events to distinguish noise from risk. A model trained on sparse or inconsistent failure records may become a false-alarm machine, which maintenance teams learn to ignore quickly.
The operational handoff is the deciding point. If the model flags an asset but maintenance has no spare parts, no technician window, or no authority to pull the asset from service, the prediction cannot produce the benchmarked outcome. The business case should therefore include planning rules for when to intervene, who approves downtime, and how parts availability is secured.
Reverse logistics prediction: useful even when ROI is less neatly sourced
Reverse logistics is often treated as an afterthought in supply chain analytics, even though returns can distort inventory, capacity, customer service, and margin. Predictive analytics can estimate which products are likely to be returned, why they may come back, where returned goods should be routed, and whether recovery, refurbishment, resale, or disposal is the better economic path.
The Amazon example in the source set is framed around anticipatory returns positioning rather than a quantified ROI outcome [6]. That is still useful, but it should not be stretched into a savings benchmark. The supported point is operational: if a company can anticipate returns earlier, it can position labor, space, disposition rules, and resale paths before returned goods pile up in the wrong node.
The model inputs usually differ from forward fulfillment. Return reason codes, product condition, customer behavior, channel, product attributes, seasonality, warranty rules, and recovery economics all matter. A reverse logistics model that only forecasts return volume may help staffing, but it will not answer the more valuable question: what should happen to the item once it comes back?
ESG and carbon compliance prediction: planning signal, not magic attribution
Carbon and ESG analytics are increasingly tied to supply chain planning because emissions are shaped by sourcing, transport mode, network design, warehouse energy use, and supplier behavior. Predictive models can forecast emissions exposure, test route or mode scenarios, identify compliance risk, and estimate the carbon effect of demand or network changes.
RTS Labs cites DHL’s 30% CO₂ reduction target [5]. That figure should be read as a planning and compliance signal, not as proof that predictive analytics alone delivers the full environmental outcome. Emissions reductions depend on assets, fuels, network decisions, supplier changes, operating discipline, and measurement boundaries as much as forecasting technique.
The more defensible business case is usually narrower: predictive analytics can help planners see the expected emissions consequence of a decision before it is locked. That may support mode selection, lane redesign, supplier comparison, facility planning, or regulatory reporting. The ROI may come partly from avoided compliance exposure and partly from operating efficiency, but the attribution needs care.
How to read the ROI ranges without being misled
The strongest benchmarks in this set have three qualities: a named operating context, a measurable outcome, and a visible mechanism. UPS miles reduced is stronger than a generic claim about logistics efficiency because the operating metric is clear [3]. Kärcher’s inventory value reduction is useful because it points to working capital rather than a vague planning benefit [2]. GM’s downtime benchmark is useful because unplanned downtime is a direct operational loss [5].
The weaker benchmarks are not useless; they just need narrower language. A secondary-cited forecast-error range can guide early sizing, but it should be verified before becoming a committed savings target [1]. A sustainability target can justify scenario planning, but it should not be attributed entirely to analytics [5]. A returns example can illustrate process design, but it should not be turned into a quantified ROI claim if the source does not provide one [6].
A practical buyer screen is to ask four questions before accepting any predictive analytics claim:
- What decision changes because of the prediction?
- Which data fields must be trusted before the model can work?
- Which operating metric moves first: forecast error, inventory value, miles, downtime, supplier intervention time, returns recovery, or emissions exposure?
- Is the cited benchmark from an independent study, a vendor case, client data, or a secondary summary?
Implementation timing is another area where precision matters. Consensus estimates of 6–12 months vary significantly by organization size and data readiness, so they should not be treated as a universal project plan. A narrow ETA model with clean transportation data may move faster than a multi-echelon inventory optimization program that requires master-data cleanup, policy redesign, and planner retraining.
What separates credible predictive analytics cases from umbrella claims
Predictive analytics becomes credible when the use case, data prerequisites, source attribution, and operating metric line up. Demand forecasting should be judged on forecast error and planning adoption. Inventory optimization should be judged on working capital, carrying cost, and service-level tradeoffs. Routing should be judged on miles, hours, fuel, and delivery performance. Supplier risk should be judged on earlier intervention and reduced exposure. Maintenance should be judged on downtime and maintenance execution. Reverse logistics should be judged on return handling, recovery value, and capacity planning. ESG prediction should be judged on scenario quality, compliance readiness, and measurable emissions planning.
The investment case does not need perfect evidence before a pilot begins. It does need honest boundaries. A benchmark is useful when it calibrates ambition; it becomes dangerous when it pretends that one company’s operating result, one vendor’s client range, or one secondary-cited statistic applies across the whole supply chain.
References
- Predictive Analytics in Supply Chain: A Practical Guide, KNIME
- Supply Chain Predictive Analytics: Cut Costs 25%, SR Analytics
- Predictive Analytics in Supply Chain Management, Lumi AI
- Power of predictive analytics and AI in supply chain, EY
- Predictive analytics in supply chain, RTS Labs
- Predictive Analytics in Supply Chain: Examples and Use Cases, LatentView
- 2026 Digital Trends in Operations Survey, PwC
Comments
Join the discussion with an anonymous comment.