Why Predictive Analytics Matters More in 2026
The World Economic Forum recently stated that volatility is no longer a temporary disruption but a structural condition leaders must plan for. For supply chain leaders, this is not a theoretical observation. Month-long disruptions now occur every 3.7 years on average, according to McKinsey research cited in a 2026 implementation guide by BrainX. The same analysis notes that 60% of supply-chain-planning IT implementations take longer or cost more than expected. Against this backdrop, predictive analytics has moved from a competitive differentiator to an operational necessity.
But the market is littered with tools that generate accurate forecasts yet fail to change business outcomes. A 2026 PwC survey of 767 US operations and supply chain leaders at companies with $100M+ revenue found that 89% say their tech investments haven't fully delivered expected results, with integration complexity as the top barrier. The problem is not the quality of the prediction — it is the absence of a coordinated response.
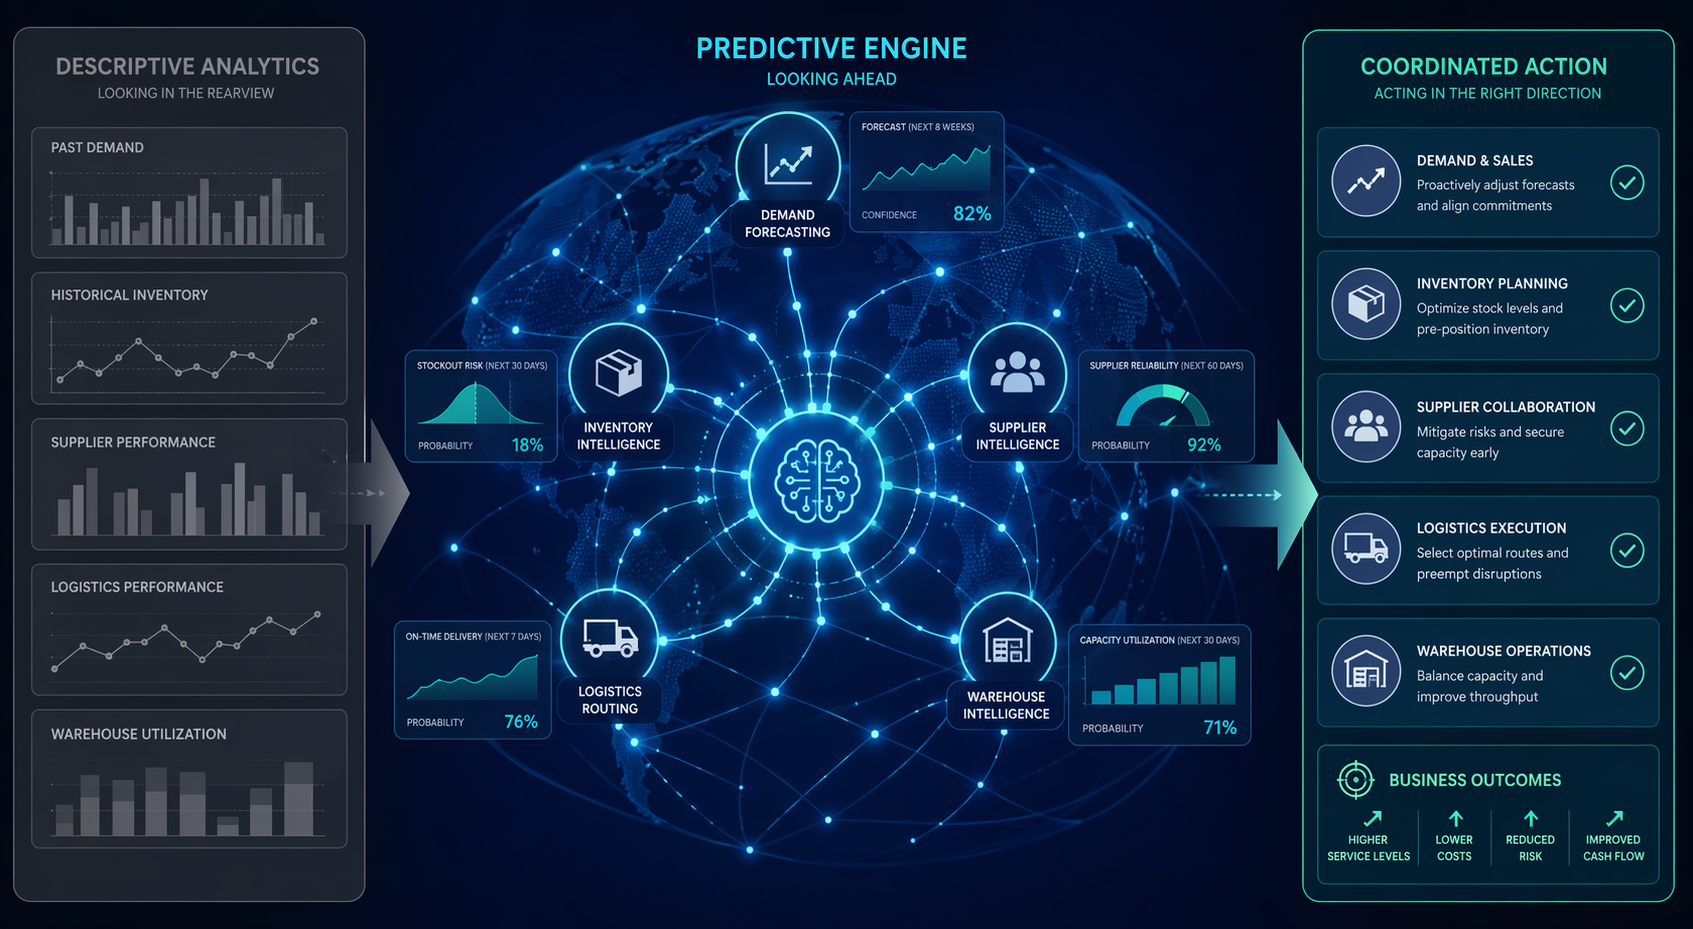
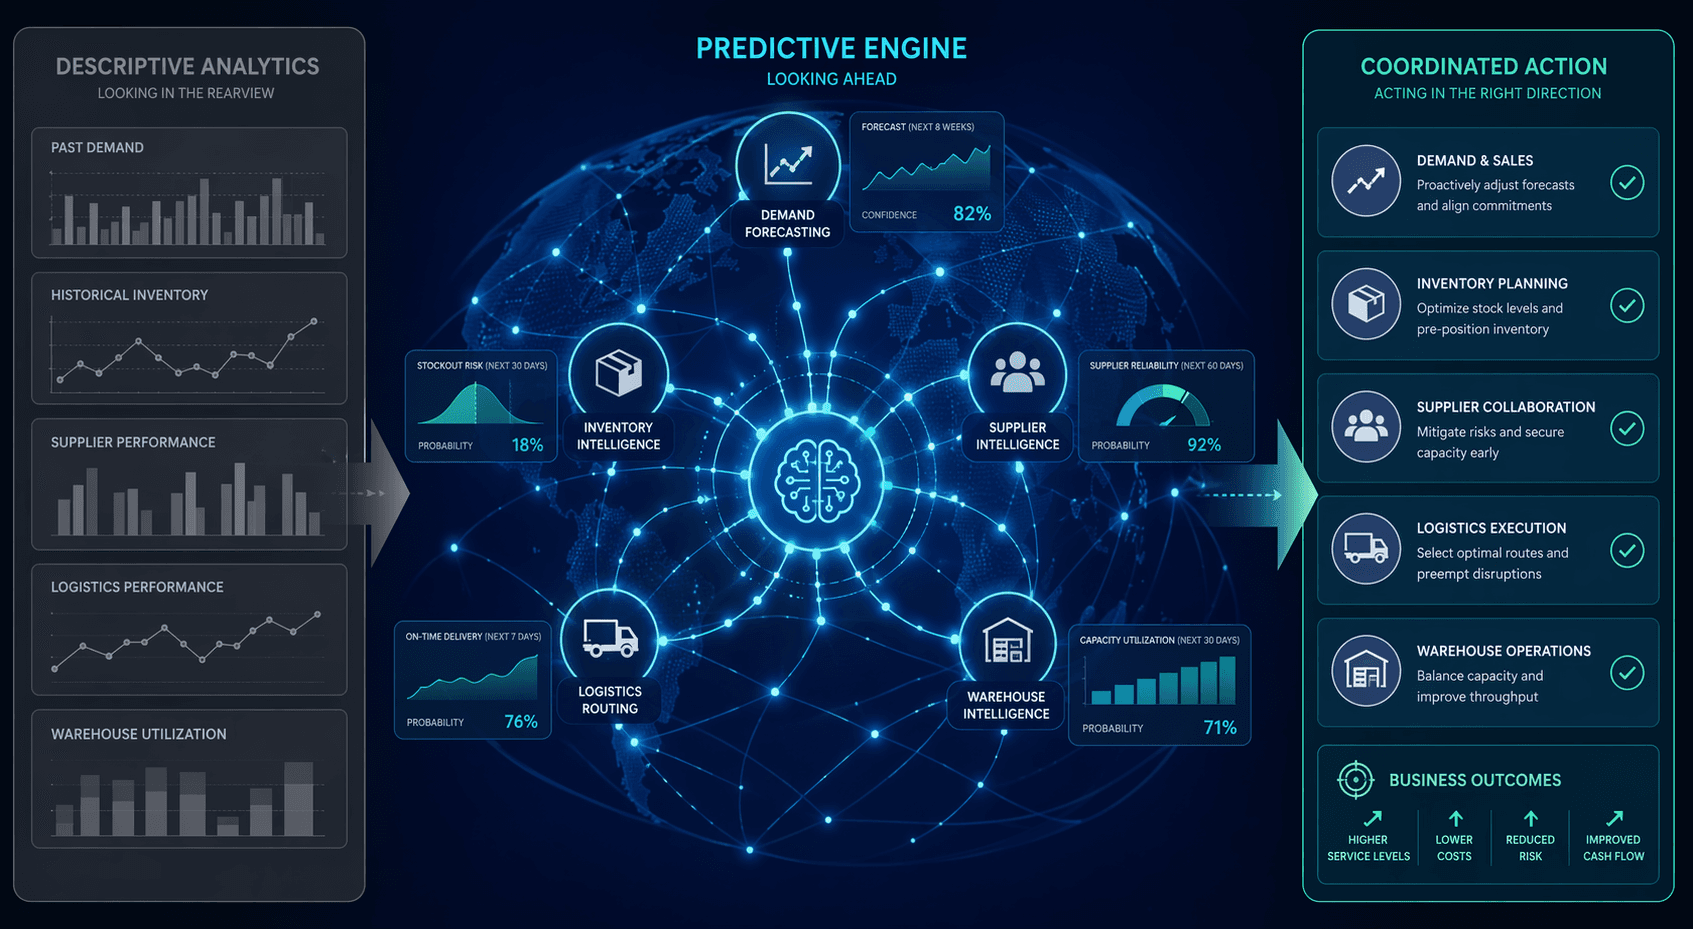
This article examines five supply chain functions where predictive analytics delivers measurable, source-attributed ROI: demand forecasting, inventory optimization, supplier risk management, logistics routing, and predictive maintenance. The central argument is straightforward: value is captured not by forecast accuracy alone, but by the ability to act on predictions across procurement, planning, logistics, and operations in a coordinated way. This differentiates the analysis from broader overviews like From Pilot to Profit: The Real ROI of AI in Procurement and Supply Chain, which covers ROI broadly without anchoring each claim to a specific predictive analytics function and the coordination thesis.
Demand Forecasting: 20–50% Error Reduction with Cross-Functional Payoff
Demand forecasting is the most established predictive analytics use case in supply chain, and the ROI benchmarks are well-documented. McKinsey reports that AI-driven demand forecasting reduces forecast errors by 20–50%. ThroughPut AI's 2026 enterprise guide cites a similar range of 20–40% forecast accuracy improvement. These are not marginal gains — they fundamentally change how an organization plans procurement, sets safety stock levels, and allocates production capacity.
The real-world evidence extends beyond vendor-reported benchmarks. Procter & Gamble integrated data from more than 10 systems to reduce its demand signal response time from over two hours daily to instantaneous, as documented in a 2026 KNIME guide. That speed improvement matters because it allows planners to react to demand shifts within the same planning cycle rather than the next day.
However, improved forecast accuracy alone does not drive value. A more accurate demand signal must trigger coordinated action: procurement adjusts order quantities, logistics reallocates transportation capacity, and inventory planners revise safety stock targets. If each function continues to operate with its own forecast, the accuracy gain is lost in translation. This is the central insight of the r4/XEM DecisionOps framework, which treats coordinated response as the missing layer above existing planning systems.
Inventory Optimization: 15–30% Reduction While Maintaining Service Levels
Excess inventory ties up working capital and masks operational problems. Predictive analytics addresses this by forecasting demand at a granular level — by SKU, location, and time period — and recommending optimal stock levels. ThroughPut AI's enterprise guide reports that predictive inventory optimization can reduce excess inventory by 15–30% while maintaining or improving service levels.
A concrete example comes from Kärcher, the cleaning equipment manufacturer. In a case study documented by KNIME, Kärcher achieved a 15% reduction in inventory value while maintaining high service levels using predictive stock recommendations. The system analyzed historical demand patterns, lead times, and service level targets to generate daily replenishment suggestions that planners could review and execute.
For organizations with complex distribution networks, Multi-Echelon Inventory Optimization (MEIO) represents a more advanced technique that uses predictive signals across multiple tiers of the supply chain — from raw material suppliers to regional distribution centers to retail locations. The MEIO glossary entry on this site provides a detailed definition and application overview. MEIO requires clean, granular data across all echelons, which is why the Data Readiness Assessment for AI Inventory Optimization is a prerequisite reading for any team considering this approach.
Supplier Risk Management: From Reactive Alerts to Continuous Scoring
Traditional supplier risk management relies on periodic reviews — quarterly scorecards, annual audits, and reactive alerts when a disruption has already occurred. Predictive analytics shifts this to continuous scoring and early warning. By ingesting data from financial reports, news feeds, weather patterns, geopolitical events, and supplier performance history, models can assign real-time risk scores and flag potential disruptions weeks in advance.
A Fortune 500 manufacturer cited in Unframe AI's 2026 overview deployed agentic AI for supplier commitment monitoring and achieved 100% visibility into supplier commitments, three weeks' advance warning of potential disruptions, and a 30% reduction in supply-driven stockouts. This is not a theoretical capability — it is a documented outcome from a production deployment.
The key to capturing value from supplier risk predictions is the same as in demand forecasting: coordinated action. A risk score for a critical supplier must trigger specific responses — sourcing teams identify alternatives, planners adjust safety stock for affected components, and logistics teams prepare for potential rerouting. Without this cross-functional playbook, the early warning becomes just another report that nobody acts on. The AI in Procurement: 10 Real-World Examples with Measurable Outcomes article on this site provides additional deployment cases in this area.
Logistics Routing and Predictive ETAs: Real-Time Optimization at Scale
Logistics is where predictive analytics meets real-time operations. Route optimization models process historical traffic patterns, weather data, delivery windows, and vehicle constraints to recommend optimal routes. Predictive ETA models go a step further, continuously updating estimated arrival times based on current conditions and communicating changes to customers and downstream operations.
DHL is a frequently cited example of real-time predictive routing at scale, as noted in ThroughPut AI's enterprise guide. Gartner reports that AI-enabled route optimization reduces transportation costs and improves on-time delivery performance, though specific percentages vary by network complexity and implementation scope.
The coordination requirement in logistics is particularly visible. A predictive ETA that a warehouse receives two hours before a truck arrives allows dock scheduling, labor allocation, and inventory staging to be adjusted in advance. Without that downstream integration, the ETA is just a data point. The Supply Chain Control Tower AI glossary entry provides a framework for understanding how cross-functional visibility platforms enable this kind of coordinated response.
Predictive Maintenance: 30–50% Fewer Unplanned Downtime Events
Unplanned downtime in warehouses and manufacturing facilities is expensive — lost production, expedited shipping costs, and missed customer commitments. Predictive maintenance uses sensor data, equipment history, and operating conditions to forecast when a machine is likely to fail, enabling maintenance to be scheduled during planned downtime rather than in response to a breakdown.
McKinsey reports that predictive maintenance reduces unplanned downtime by 30–50% and lowers maintenance costs by 10–40%. ThroughPut AI's guide corroborates the 30–50% downtime reduction figure. In manufacturing environments, General Motors and other automotive OEMs have deployed predictive maintenance on critical production equipment, though specific outcome data is often treated as proprietary.
The coordination thesis applies here as well. A prediction that a packaging line will fail in 72 hours must feed into production scheduling (to accelerate the current batch), inventory planning (to ensure sufficient finished goods to cover the downtime), and procurement (to order replacement parts). If the maintenance team acts on the prediction but production and inventory teams are not looped in, the downtime may still cause a stockout.
ROI Summary: Sourced Benchmarks Across Five Functions
The table below consolidates the ROI ranges discussed in this article, with source attribution. These figures represent benchmarks from published research and vendor-documented case studies — they are not guaranteed outcomes and will vary based on organizational context, data quality, and implementation rigor.
| Function | Reported ROI Range | Primary Source | Coordination Requirement |
|---|---|---|---|
| Demand Forecasting | 20–50% forecast error reduction | McKinsey (via BrainX 2026) | High: requires procurement, logistics, and inventory to act on shared forecast |
| Inventory Optimization | 15–30% excess inventory reduction | ThroughPut AI 2026; KNIME/Kärcher case study (15%) | High: requires demand signal integration and service level alignment across echelons |
| Supplier Risk Management | 30% reduction in supply-driven stockouts; 3 weeks advance warning | Unframe AI 2026 (Fortune 500 manufacturer) | High: requires procurement, planning, and logistics to execute predefined response playbooks |
| Logistics Routing & Predictive ETAs | Transportation cost reduction; on-time delivery improvement | Gartner (via Unframe AI 2026) | Medium-High: requires warehouse and customer integration for ETA-driven scheduling |
| Predictive Maintenance | 30–50% fewer unplanned downtime events; 10–40% lower maintenance costs | McKinsey (via BrainX 2026 and ThroughPut AI 2026) | Medium: requires production scheduling and inventory planning to adjust for planned downtime |
Common Failure Modes and How to Avoid Them
The PwC 2026 survey data is sobering: 89% of operations leaders say their tech investments haven't fully delivered expected results. The top barrier is integration complexity. The second is data quality — 87% of respondents say poor data quality has impacted their ability to achieve value from digital initiatives. Only 30% report significant improvement in data quality over the past 2–3 years.
These findings align with practitioner experience. KNIME's guide recommends spending 60% of project time on data connection and cleaning. BrainX's implementation guide requires 18–24 months of clean historical data as a minimum for predictive models. Organizations that skip this step — rushing to deploy models on fragmented or low-quality data — consistently underperform.
Beyond data, the organizational silo problem is the most persistent failure mode. The PwC survey found that only 41% of companies operate with collaborative, horizontal structures today, though 94% of those with siloed structures expect to shift toward a networked model. Predictive analytics amplifies the cost of silos: each function generates its own forecast, sets its own targets, and optimizes for its own metrics, so the coordinated response never materializes.
- Data readiness: Conduct a data quality assessment before selecting a predictive analytics platform. The Data Readiness Assessment for AI Inventory Optimization provides a structured framework for this evaluation.
- Integration planning: Allocate budget and timeline for connecting the predictive analytics layer to existing ERP, planning, and execution systems. Integration complexity is the #1 barrier cited in the PwC survey.
- Cross-functional governance: Establish a shared decision operations framework — the r4/XEM approach — that defines how predictions trigger actions across procurement, planning, logistics, and operations.
- Pilot design: Start with a 4–8 week pilot focused on a single function and a bounded set of SKUs or routes. BrainX recommends this timeline before committing to full production scale, which typically requires 3–6 months.
- Model selection: The Machine Learning in Supply Chain Management glossary entry provides an overview of techniques and their applicability. KNIME notes that a well-tuned XGBoost model on clean data outperforms any neural network on fragmented data — simpler models often win in production.
The Tool Landscape: What to Look for in a Predictive Analytics Platform
The predictive analytics tool landscape for supply chain can be grouped into three categories, each serving a different evaluation need:
- Comprehensive planning platforms: Solutions like Blue Yonder, o9 Solutions, Kinaxis, and SAP IBP embed predictive analytics within broader supply chain planning suites. These are best suited for enterprises that want an integrated planning environment and have the budget and IT resources to manage complex implementations.
- Specialized point solutions: Vendors focused on a single function — demand sensing (e.g., ToolsGroup), inventory optimization (e.g., E2open, RELEX), supplier risk (e.g., Altana, Resilinc), or logistics routing (e.g., Trimble, Descartes). These offer deeper functionality in their domain but require integration with other systems.
- Coordination layers: Emerging platforms like r4/XEM that sit above existing systems and orchestrate cross-functional response to predictive signals. These address the coordination gap directly and are particularly relevant for organizations that already have planning tools but lack the connective tissue between them.
This site's Vendor Comparisons and Vendor Profiles sections provide deeper evaluations of specific platforms, including methodology comparisons, integration requirements, and known customer outcomes. For organizations in the early evaluation stage, the key criteria to assess are: data integration requirements, model explainability, deployment model (SaaS vs. on-premise), and — most importantly — the platform's ability to trigger coordinated actions across functions, not just generate predictions.
From Forecast to Coordinated Action: The Real Unlock
The evidence across five functions is consistent: predictive analytics delivers measurable ROI when — and only when — predictions drive coordinated cross-functional response. The r4/XEM DecisionOps framework formalizes this insight as a coordination layer above existing ERP, planning, supplier, and logistics systems. It turns predictive signals into orchestrated actions across procurement, operations, and logistics.
The PwC survey offers a hopeful data point: 83% of operations leaders agree that AI agents and automation will accelerate the breakdown of traditional functional silos. But technology alone does not create coordination. It requires organizational design, shared metrics, and a decision operating model that connects the forecast to the response.
Comments
Join the discussion with an anonymous comment.