
Supply chain control tower software can produce a defensible ROI case, but only if the model starts with the right kind of evidence. The numbers that hold up best are not the biggest claims in vendor decks. They are the narrower, source-attributed ranges that can be tied to a value driver: logistics cost, inventory, service resilience, labor productivity, and payback.
A practical starting envelope looks like this: logistics cost down 3–5%, inventory down 5–15%, labor efficiency up 10–20%, delays and downtime down 50–80% in digital-twin-enabled supply chains, productivity gains ranging from 2x to 10x in Nucleus Research reporting, and payback for AI-powered control tower deployments often discussed around 4–8 months, though that payback window has thinner independent validation than the cost and inventory ranges.[1][2][3][4]
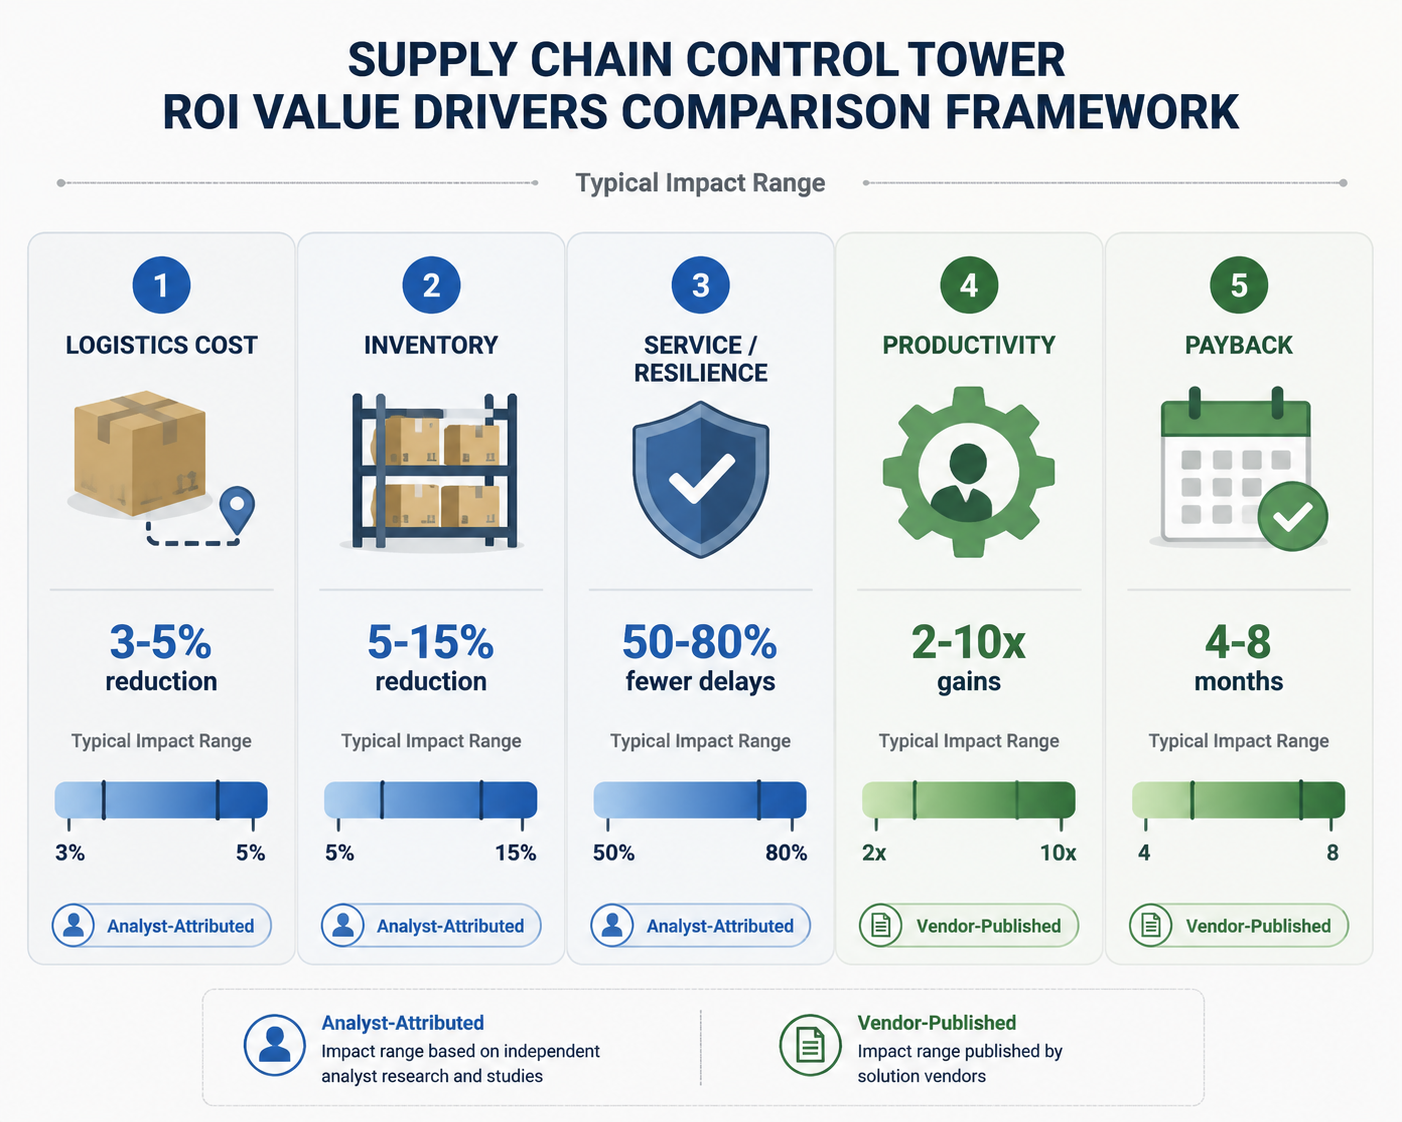
| Value driver | Defensible planning range or reported outcome | Best use in a business case | Source type |
|---|---|---|---|
| Logistics cost | 3–5% reduction; vendor deployment examples include detention and OTIF penalty savings | Use as a base-case range against controllable freight, detention, expediting, and penalty pools | Analyst-attributed range plus vendor-published cases[1][4] |
| Inventory | 5–15% reduction; One Network-reported deployment outcomes include 90% stockout reduction and 100%+ inventory turn increase | Use only after separating safety stock, cycle stock, obsolete inventory, and service-policy constraints | Analyst-attributed range plus vendor-published deployment evidence[1] |
| Service and resilience | 5–8% fill-rate improvement; 50–80% fewer delays and downtime in digital-twin-enabled supply chains | Use where revenue protection, service penalties, production continuity, or customer allocation matter | Analyst-attributed digital twin/control tower evidence[2] |
| Productivity | 10–20% labor efficiency improvement; 2–10x productivity gains in Nucleus Research reporting | Use where planners, logistics coordinators, and exception managers spend measurable time gathering data and chasing status | Analyst-attributed and research-attributed ranges[1][3] |
| Payback | 4–8 months for AI-powered control tower deployments in cited commentary and FourKites reporting | Use as a sensitivity case, not as a universal benchmark | Limited-source convergence; validate against implementation scope[4] |
Those figures are useful because they are specific enough to model and modest enough to challenge. They are not a license to paste a global average into a board deck. A food manufacturer with chronic detention, spoilage exposure, and OTIF penalties has a different ROI surface from an automotive network trying to prevent line stoppages, or a distributor whose biggest constraint is planner bandwidth. The software label may be the same; the economic mechanism is not.
Readers who still need the foundational capability spectrum can start with Supply Chain Control Tower AI: Definition, Capability Spectrum, and Maturity Levels. The ROI discussion here assumes the buyer is already past the definition stage and is deciding whether the investment case can survive finance review.
Start with source quality, not the largest percentage
Control tower ROI evidence falls into two broad buckets, and they should not be mixed casually.
- Analyst-attributed or research-attributed ranges are better for base-case modeling because they are broader and less tied to one successful deployment. Accenture-attributed figures reported by AltexSoft, McKinsey and BCG figures reported by C&F, and Nucleus Research figures reported by CE Interim sit in this category.[1][2][3]
- Vendor-published deployment outcomes are useful as proof that a mechanism can work in a real operation, but they should be treated as case evidence, not general benchmarks. FourKites, One Network, Locus, and SAP cases belong here.[1][4][5][7]
- Company case studies can be compelling when the baseline problem is visible. IBM’s reported $160 million cost reduction and 100% order delivery during the COVID crisis is strong deployment evidence, but it should not be converted into a percentage forecast for a different company without the underlying spend base and operating context.[1]
The distinction matters because a control tower business case usually fails in the gap between “this happened somewhere” and “this is likely here.” A vendor case can help prove plausibility. A board model needs a baseline, an addressable cost pool, and a reason the selected control tower model can actually influence that pool.
Logistics cost: the cleanest place to start
The most usable logistics cost benchmark is the Accenture-attributed 3–5% reduction reported by AltexSoft.[1] It is not the most dramatic number in the evidence set, but it is the right kind of number for a first-pass model because it can be applied to a defined spend base: transportation, warehousing interfaces, expediting, detention, demurrage, accessorials, and penalty exposure where the control tower has operational reach.
The range does not mean total supply chain cost automatically falls by 3–5%. If the software only improves shipment visibility and does not change tendering, appointment management, exception escalation, or carrier collaboration, the addressable pool is smaller. If it connects visibility to execution workflows, exception prioritization, and automated intervention, the range becomes more credible.
FourKites provides a useful example of the mechanism in a top-15 food and beverage manufacturer: $500,000 in detention savings, $800,000 in OTIF penalty reduction, and a 35% logistics productivity gain.[4] This is exactly the sort of case that belongs in an ROI deck as deployment evidence. It shows that detention, penalties, and coordinator productivity can be monetized when the operational baseline is painful enough. It should not be described as the expected outcome for every shipper.
Renault Group adds another logistics example from a different environment. Its control tower work is reported to have halved expedited transport across 6,000 daily loads.[6] That matters because expedited freight is often where poor visibility becomes cash leakage. But the same caution applies: an operation with limited expedited freight exposure cannot borrow Renault’s result and call it a base case.
How to model the logistics line
Use the 3–5% range only against spend categories the control tower can influence. In a conservative model, that may mean detention, demurrage, expediting, accessorial disputes, premium freight, OTIF penalties, and the labor attached to exception handling. In a broader execution-led model, it may include a larger share of transportation spend because the platform is changing decisions, not only showing status.
Inventory: the headline range needs tighter guardrails
The Accenture-attributed inventory reduction range of 5–15% is one of the most important numbers in the ROI set.[1] It is also one of the easiest to misuse. Inventory comes down only when the organization changes planning buffers, replenishment timing, allocation, or confidence in supply. A dashboard alone does not release working capital.
The stronger business case separates inventory into categories before applying any percentage: safety stock held because lead times are uncertain, cycle stock driven by order policies, in-transit inventory, slow-moving or obsolete stock, and strategic buffers that the business is not willing to cut. A control tower may reduce the first and third categories materially while leaving strategic buffers unchanged. That is still valuable, but the addressable base is smaller than total inventory on the balance sheet.
One Network-reported outcomes show why the upside can look large in some deployments: 90% stockout reduction, 75% expediting cost reduction, and 100%+ inventory turn increase are cited in AltexSoft’s control tower overview.[1] These are powerful indicators of what can happen when planning, visibility, and execution are connected. They are also vendor-attributed deployment outcomes, so the right question is not whether they are interesting. The right question is whether the buyer has the same baseline condition: stockouts that are visible, expediting that is material, and inventory turns constrained by coordination rather than by commercial policy.
Inventory ROI also depends on whether finance values the benefit as working-capital release, carrying-cost reduction, markdown avoidance, service improvement, or some combination. A $10 million inventory reduction is not the same thing as a $10 million P&L benefit. The model should show both the balance-sheet release and the annual cost impact, or it will overstate the return.
Service and resilience: valuable, but harder to translate into ROI
Service improvements are often where operations teams feel the value first and finance teams ask for more proof. McKinsey-attributed data reported by C&F links digital-twin-enabled planning to 20–30% forecast accuracy improvement and 5–8% fill-rate improvement.[2] BCG-attributed data in the same source reports 50–80% reductions in delays and downtime for digital-twin-enabled supply chains.[2]
Those numbers support a resilience case, especially in supply chains where missed supply creates measurable cost: lost sales, production downtime, emergency freight, customer penalties, or allocation disputes. They do not prove that every control tower will generate a 50–80% reduction in delays. The cited evidence is tied to digital-twin-enabled supply chains, which implies more than passive visibility.
The finance model should therefore avoid treating service improvement as a vague customer-satisfaction benefit. It should name the economic event being prevented: a stockout, a missed delivery window, a line stoppage, a service-level penalty, a lost order, or a late shipment that triggers premium recovery. If those events are not currently measured, the ROI case should either exclude them from the base case or put them in a clearly labeled upside scenario.
This is also where industry differences become sharp. Automotive and industrial networks may justify control tower investment through downtime avoidance and expedited transport reduction. Consumer goods and food manufacturers may find the economics in shelf availability, OTIF penalties, detention, freshness, and allocation. A mid-market distributor may care less about global disruption modeling and more about fill rate, backorder management, and branch-level inventory visibility.
Productivity: count the hours before claiming the multiplier
Productivity is real, but it is often modeled lazily. Accenture-attributed figures reported by AltexSoft cite 10–20% labor efficiency improvement, while CE Interim cites Nucleus Research on 2–10x productivity gains and 8% supply cost reduction.[1][3] Those numbers can be used, but only after defining whose work is changing.
The labor pool usually includes planners, logistics coordinators, customer service teams, inventory analysts, procurement expediters, and managers who spend time reconciling data across ERP, TMS, WMS, carrier portals, spreadsheets, and email. The productivity gain may come from fewer manual status checks, faster exception triage, automated report generation, better prioritization, or less rework after bad handoffs.
SAP’s Schnellecke example is a narrow but useful productivity signal: report generation moved from 2 hours to immediate.[7] That should not be inflated into a full labor-reduction claim by itself. It should be used to identify a class of work that can disappear or compress when data is integrated properly.
Locus reports customer metrics including 25% efficiency gains, 45% more deliveries per vehicle, and an 8% SLA improvement.[5] Those figures point toward route execution and last-mile density benefits, not a generic enterprise control tower return. They are highly relevant for delivery-heavy networks. They are less relevant for a manufacturer whose primary issue is supplier disruption or global ocean visibility.
For business-case purposes, productivity should be modeled in two layers. First, calculate hard savings only where labor can actually be redeployed, avoided, or converted into higher throughput without new hiring. Second, show soft capacity release where the same team can manage more shipments, SKUs, suppliers, plants, or exceptions. The second benefit may be strategically important, but it is not the same as headcount savings.
Payback: useful as a challenge test, weak as a standalone proof
The 4–8 month payback window for AI-powered control towers is attractive, and FourKites discusses that kind of payback in the context of modern control tower deployments.[4] It should be handled carefully. Payback depends on implementation cost, integration scope, user adoption, baseline leakage, and how quickly the platform moves from visibility to operational intervention.
A narrow visibility deployment may have lower software and implementation cost, but it may also have fewer levers to monetize. An execution-led control tower may cost more and take more integration work, but it can influence a broader set of decisions: appointment changes, carrier escalation, inventory reallocation, replenishment actions, exception prioritization, and service recovery. A planning-led or digital-twin-enabled tower may produce value through forecast accuracy, fill rate, delay reduction, and scenario planning rather than immediate freight savings.
That is why payback belongs near the end of the model, not at the beginning. Build the benefit lines first. Then test whether the investment, timeline, and adoption plan make a 4–8 month payback plausible. If the only way to reach that window is to assume every value driver lands at the high end in year one, the model is not yet board-ready.
The control tower model changes the ROI surface
Market context is useful here, but not as ROI proof. Mordor Intelligence reports that operational control towers hold 53.45% market share, while end-to-end predictive suites are growing at a 17.40% CAGR.[6] That says buyers are still spending heavily on execution visibility and operational coordination, while more predictive architectures are expanding. It does not say either model will pay back in a specific company.
| Control tower model | Primary ROI surface | Typical modeling caution |
|---|---|---|
| Visibility-led | Fewer manual status checks, faster escalation, reduced detention or late-shipment surprises | Lower cost does not automatically mean high ROI if users still resolve exceptions outside the system |
| Planning-led | Forecast accuracy, inventory positioning, fill rate, scenario planning | Benefits require planning process changes, not only better analytics |
| Execution-led | Freight cost, expediting, OTIF penalties, service recovery, exception automation | Integration and workflow depth determine whether the platform can actually change outcomes |
| Digital-twin or predictive suite | Delay reduction, downtime avoidance, scenario simulation, resilience planning | Higher potential value usually comes with higher data, integration, and governance requirements |
This distinction is more useful than ranking vendors in the abstract. A buyer evaluating platform archetypes can map the ROI evidence to specific solution categories using Supply Chain AI Solutions: A Vendor Directory by Archetype. The point is not to pick the most advanced architecture by default. It is to avoid claiming inventory, service, and execution savings from a tool that only provides shipment visibility.
Build the business case from the baseline up
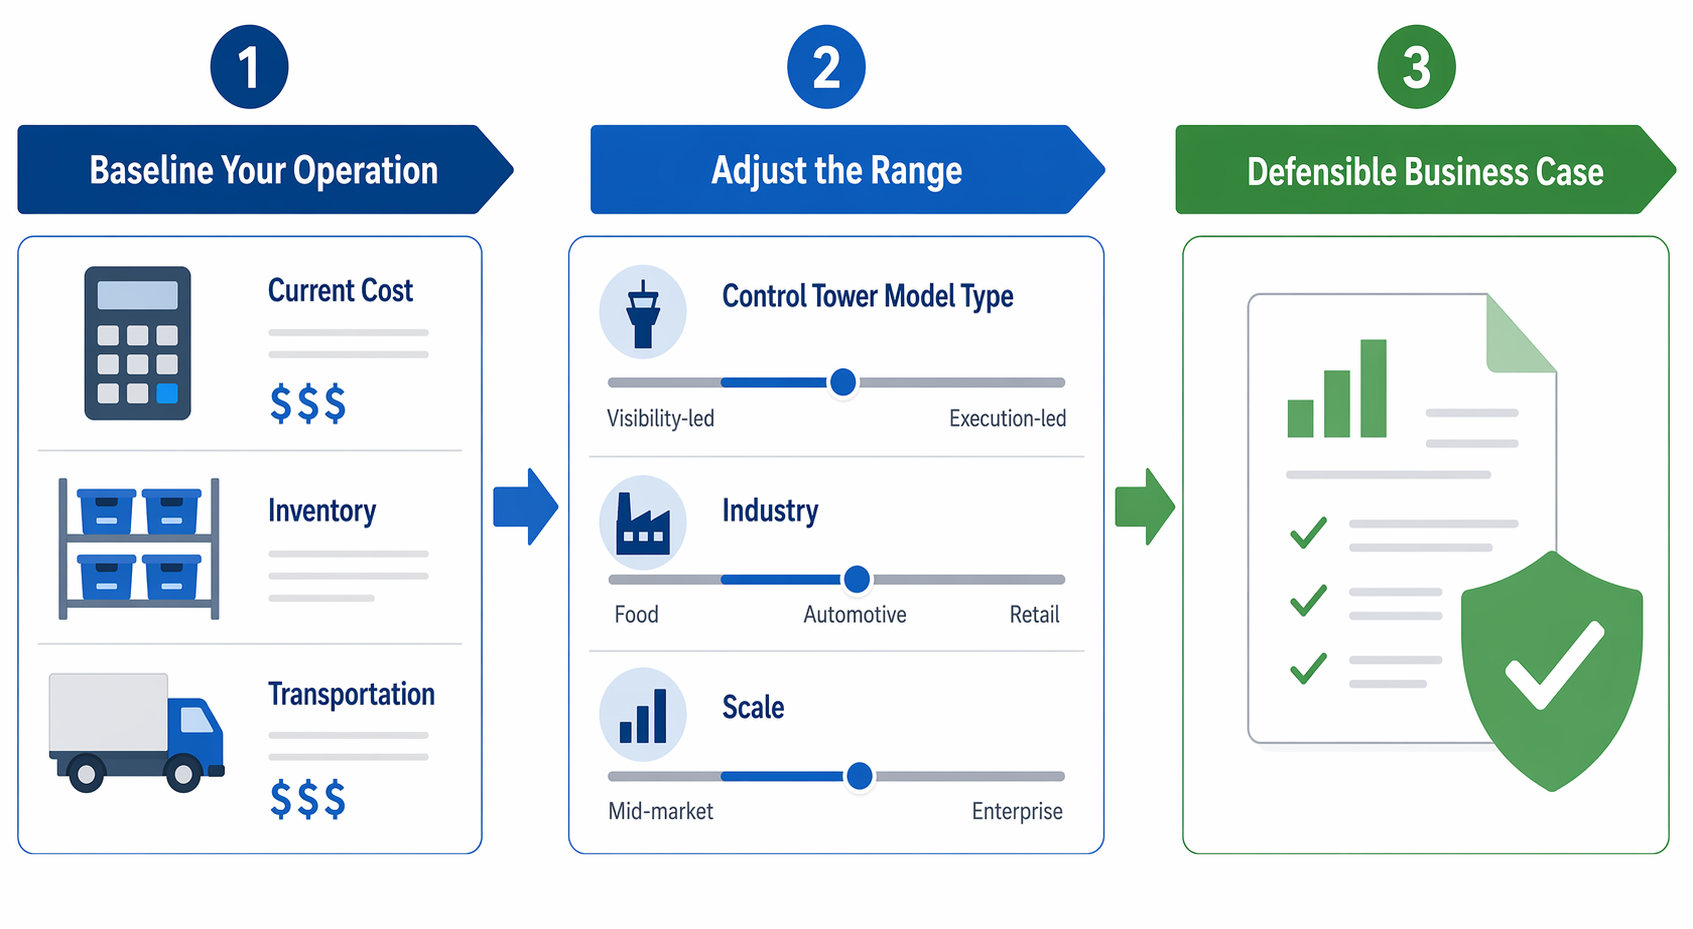
A defensible ROI model starts with current operational leakage, not with a vendor’s outcome slide. The baseline should be recent enough to reflect current network conditions and long enough to avoid being distorted by one abnormal month. It should also separate recurring waste from one-time disruption.
- Logistics spend: transportation, premium freight, detention, demurrage, accessorials, expedites, failed deliveries, appointment misses, and service penalties.
- Inventory value: safety stock, cycle stock, in-transit inventory, obsolete or slow-moving stock, and buffers held because lead times or supplier reliability are uncertain.
- Service loss: stockouts, backorders, late orders, fill-rate misses, OTIF penalties, customer deductions, lost sales estimates, and production downtime.
- Labor effort: hours spent on manual status checks, spreadsheet reconciliation, report generation, supplier or carrier chasing, exception meetings, and customer-service firefighting.
- Decision latency: how long it takes to detect an exception, assign ownership, approve a recovery action, and confirm execution.
Once the baseline is visible, the cited ranges can be applied with discipline. Logistics cost reduction of 3–5% belongs on the addressable logistics leakage pool, not necessarily on all logistics spend.[1] Inventory reduction of 5–15% belongs on inventory categories the operating model can actually change.[1] Fill-rate and delay improvements belong in the model only if they connect to measurable service economics.[2] Productivity gains belong where work content has been counted and where capacity release has an economic consequence.[1][3]
Adjust the range before presenting the number
| Adjustment factor | Move the ROI expectation up when... | Move the ROI expectation down when... |
|---|---|---|
| Baseline leakage | Detention, expediting, stockouts, penalties, or manual exception work are frequent and measured | The operation already has low leakage or weak measurement of preventable events |
| Control tower model | The platform can trigger decisions, automate workflows, or connect planning to execution | The implementation is mostly passive visibility with limited process authority |
| Industry economics | Late or missed supply creates measurable financial consequences such as downtime, spoilage, lost sales, or penalties | Service failures are inconvenient but rarely monetized or contractually penalized |
| Scale and complexity | The network has many sites, carriers, suppliers, SKUs, lanes, or customer promises to coordinate | The network is simple enough that existing teams can manage exceptions manually |
| Data and integration readiness | ERP, TMS, WMS, carrier, supplier, and order data can be connected with usable latency and quality | Data gaps force users back into spreadsheets and email for the decisions that matter |
This adjustment step is where many business cases become either credible or theatrical. A company with high premium freight, low planner bandwidth, poor ETA reliability, and measurable OTIF penalties can reasonably test the upper side of the logistics and productivity ranges. A company with stable lanes, low penalty exposure, and mature transportation execution should probably start closer to the low end, even if the market average looks better.
A board-ready model should show source lineage
The strongest control tower ROI model is not the one with the highest return. It is the one where every material assumption has a lineage: internal baseline, analyst-attributed range, vendor deployment comparison, or upside scenario. That format lets finance challenge the model without dismantling it.
| Model line | Recommended treatment | Example source support |
|---|---|---|
| Base-case logistics savings | Use 3–5% only on addressable logistics leakage or controllable spend | Accenture-attributed range via AltexSoft[1] |
| Base-case inventory savings | Use 5–15% only on reducible inventory categories; separate working capital from P&L benefit | Accenture-attributed range via AltexSoft[1] |
| Service improvement | Model only where fill-rate, downtime, delay, penalty, or lost-sales economics are measurable | McKinsey and BCG figures via C&F[2] |
| Productivity | Separate hard labor savings from capacity release; count work before applying a percentage | Accenture-attributed and Nucleus Research figures[1][3] |
| Deployment upside | Use named cases to explain mechanism, not to set a universal forecast | IBM, FourKites, One Network, Locus, Renault, SAP cases[1][4][5][6][7] |
| Payback | Use as a sensitivity test after benefits and implementation costs are built | FourKites discussion of AI-powered control tower payback[4] |
A simple scenario structure usually works better than a single blended ROI number. The conservative case can include only hard savings from measured logistics leakage, labor redeployment, and avoidable penalties. The expected case can add inventory carrying-cost reduction, service improvements with clear economics, and capacity release. The upside case can include larger inventory release, delay reduction, or growth enablement, but only if those assumptions are labeled and reviewed separately.
Vendor evaluation should come after this modeling work, not before it. If the business case depends on inventory reduction, the selected platform needs planning, allocation, or replenishment influence. If the case depends on detention and OTIF penalties, it needs transportation execution workflows and carrier collaboration. If the case depends on planner productivity, it needs exception automation and usable decision support, not just a prettier dashboard. For a broader evaluation discipline, see How to Evaluate AI Tools for Supply Chain Management Without Falling for Marketing Hype.
The defensible answer
The evidence supports a credible ROI case for many control tower investments. A defensible planning envelope is 3–5% logistics cost reduction, 5–15% inventory reduction, meaningful service improvement where delay and fill-rate economics are measurable, 10–20% labor efficiency improvement with some research citing larger productivity multipliers, and potential payback around 4–8 months in AI-powered deployments when baseline leakage and implementation scope support it.[1][2][3][4]
The evidence does not support one universal ROI number for supply chain control tower software. The right range depends on the control tower model being purchased, the addressable cost pools, the industry economics, the scale of the network, and the organization’s ability to move from visibility to changed decisions. The business case that survives scrutiny is contextual, source-attributed, and explicit about which benefits come from broad research and which come from vendor-published deployment evidence.
References
- Supply Chain Control Tower: Enhancing Visibility and Resilience — AltexSoft.
- AI in Supply Chain Control Towers: From Monitoring to Decision Execution — C&F.
- Supply Chain Control Tower: Real-Time Visibility & ROI — CE Interim.
- Why Supply Chain Control Towers Didn't Deliver on Their Promise (And What's Changing) — FourKites.
- 10 Best Supply Chain Control Tower Providers in 2026 — Locus.
- Control Tower Market Size, Growth & Outlook — Mordor Intelligence.
- Moving Toward a More Autonomous Supply Chain — SAP, May 2026.
Comments
Join the discussion with an anonymous comment.