
The Spend Analytics Problem at Scale
Procurement organizations managing thousands of suppliers and millions of line-item transactions annually face a structural data problem. Spend data is scattered across multiple ERP instances, procurement systems, P-card feeds, and manual invoice submissions — each with its own taxonomy, naming conventions, and data quality profile. A single global enterprise might record the same supplier as "DHL," "DHL Freight," "Deutschland DHL," and "DHL Express" across different business units, fragmenting what should be a consolidated view of total spend with that carrier.
The consequence is that analytics teams spend the majority of their time cleaning and classifying data rather than analyzing it. Category managers receive static spend cubes that are already weeks or months out of date by the time they are published. Maverick spend, off-contract purchasing, and pricing anomalies go undetected until the next quarterly review — if they are caught at all. The procurement function remains reactive, responding to cost overruns after they have already occurred rather than preventing them.
This is the operational pain point that machine learning directly addresses. Unlike rule-based classification systems that require manual maintenance of thousands of regex patterns and category mappings, ML models learn from the data itself. They adapt to new supplier names, evolving category structures, and changing purchasing patterns without requiring a re-write of business rules. The result is a shift from static, backward-looking reporting to a dynamic, continuously updated view of procurement spend that enables proactive category management.

How ML Classification Works: Supervised, Unsupervised, and Reinforcement Learning
Modern spend classification systems employ three distinct machine learning approaches, each addressing a different aspect of the data fragmentation problem. Understanding how these mechanisms work — and where they fall short — is essential for analytics directors evaluating vendor solutions or building internal capabilities.
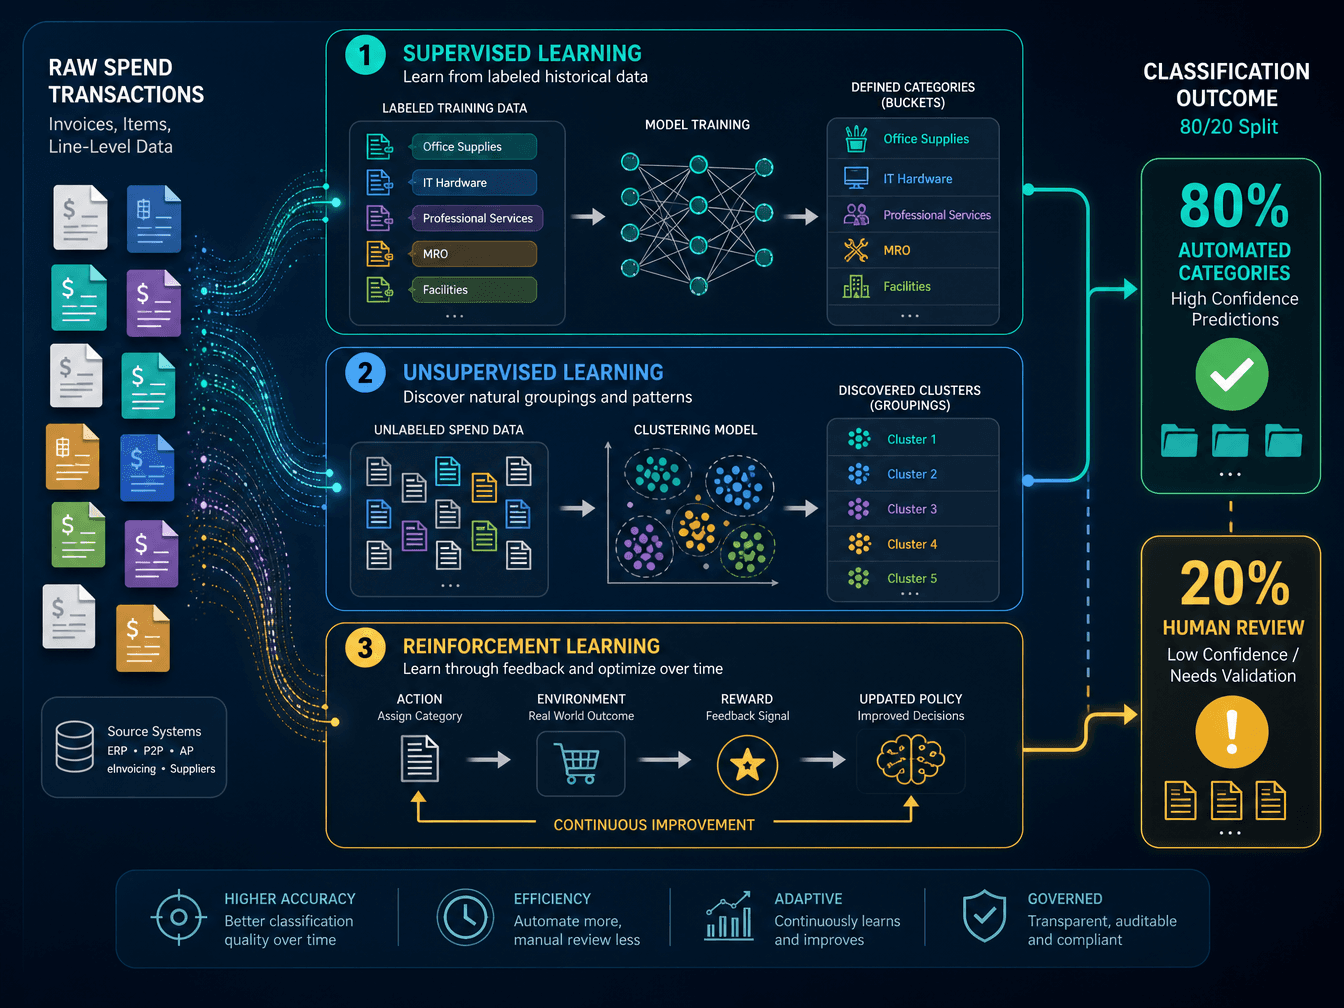
Supervised Learning for Automated Categorization
Supervised learning is the workhorse of spend classification. The process begins with a training dataset of historically classified invoices or purchase orders — ideally tens of thousands of records that have been manually coded by procurement analysts. The algorithm learns to associate line-item descriptions, commodity codes, supplier names, and dollar amounts with the correct spend categories. Once trained, the model can classify new, unseen transactions automatically.
In practice, approximately 80% of spend classification can be automated through supervised learning, while the remaining 20% requires human review and exception handling. This 80/20 split is not a limitation of the technology — it reflects the reality that some transactions are genuinely ambiguous, involve new categories, or contain data quality issues that no model can resolve without human judgment. The key architectural decision is how the system handles the low-confidence tail: routing uncertain classifications to a human review queue rather than forcing a potentially incorrect assignment.
The accuracy gains are substantial. One water treatment company reportedly improved the accuracy of its procurement spending classification by more than 90% using AI, according to a KPMG study cited by Oracle. This level of improvement transforms the reliability of downstream analytics — category managers can trust that the "IT Services" bucket actually contains IT services, not a mix of consulting, hardware, and telecom expenses that happened to share a vendor.
Unsupervised Learning for Vendor Name Consolidation
Vendor name consolidation is a deceptively hard problem. Rule-based approaches require procurement teams to maintain ever-growing lists of aliases and fuzzy-match patterns. Unsupervised learning solves this by detecting patterns in vendor relationships without pre-programmed rules. The algorithm clusters similar vendor names based on string similarity, address overlap, tax ID patterns, and co-occurrence in transactions — grouping "DHL," "DHL Freight," and "Deutschland DHL" into a single entity without requiring a human to define what constitutes a match.
This capability is particularly valuable in organizations that have grown through acquisition, where each acquired company brings its own supplier master data with different naming conventions. Without unsupervised consolidation, total spend with a single supplier can be scattered across dozens of vendor records, masking the true commercial relationship and undermining negotiation leverage.
Reinforcement Learning for Continuous Improvement
The third mechanism — reinforcement learning — closes the feedback loop. When a human reviewer corrects a classification decision, that correction becomes a training signal. The algorithm is "rewarded" for correct classifications and "penalized" for incorrect ones, gradually improving its accuracy over time. This is what distinguishes ML-based spend classification from static rule engines: the system gets better the more it is used, adapting to new categories, changing supplier landscapes, and evolving procurement patterns without requiring manual rule updates.
The practical workflow, as described by Sievo, follows a three-step cycle: (1) the algorithm classifies new transactions at high confidence automatically or routes low-confidence items to human review; (2) human analysts review and correct the low-confidence classifications; (3) the corrected data feeds back into the training set, improving the model's performance on future transactions. Over time, the proportion of transactions requiring human review shrinks, and the classification accuracy across all spend categories converges toward the high-confidence threshold.
Beyond Classification: Anomaly Detection, Predictive Pricing, and Should-Cost Modeling
Once clean, classified spend data exists, the analytical possibilities expand far beyond categorization. Three capabilities in particular transform procurement from a reporting function into a proactive value creation engine.
Real-Time Anomaly Detection
ML models trained on historical spend patterns can detect anomalies in real time — a sudden spike in spend with a particular supplier, a category where prices are deviating from the established trend, or a transaction that falls outside normal purchasing patterns. Unlike rule-based alerts that require manual configuration of thresholds, ML-based anomaly detection establishes a dynamic baseline of "normal" behavior and flags deviations that warrant investigation.
This capability directly addresses maverick spend and compliance issues. When an employee purchases from an off-contract supplier at a premium price, or when a category's spend suddenly exceeds forecast without explanation, the system can notify the category manager immediately rather than waiting for the next quarterly report. The same mechanism can detect pricing anomalies — a supplier whose invoice prices have drifted above the agreed contract rate — and flag them for audit before payment is processed.
Predictive Pricing and Should-Cost Modeling
Predictive pricing models analyze historical price data, commodity indices, and market trends to forecast future cost movements for key categories. This enables procurement teams to time their sourcing activities strategically — accelerating purchases before anticipated price increases or delaying commitments when prices are expected to fall.
Should-cost modeling takes this a step further by estimating what a product or service should cost based on its underlying cost drivers — raw material prices, labor rates, manufacturing complexity, logistics costs. By comparing actual supplier prices against the should-cost estimate, category managers can identify which categories offer the greatest negotiation leverage and which suppliers may be charging above-market rates.
Sanofi provides a documented example of this capability in action. The pharmaceutical company applied should-cost modeling to inform make-versus-buy decisions across multiple categories, achieving an average 10% reduction in spend. An advanced analytics platform also reduced the time required to evaluate tenders by two-thirds, and digitally enabled negotiations helped Sanofi increase the savings achieved by 281%, according to McKinsey's analysis of WEF Lighthouse case studies.
| Capability | What It Does | Primary Value | Example Outcome |
|---|---|---|---|
| Anomaly Detection | Flags deviations from historical spend patterns in real time | Identifies maverick spend, pricing errors, and compliance issues before payment | Immediate notification of off-contract purchases |
| Predictive Pricing | Forecasts cost movements using historical data and market indices | Enables strategic timing of sourcing activities | Avoiding purchases before anticipated price increases |
| Should-Cost Modeling | Estimates optimal price based on cost driver analysis | Reveals negotiation leverage and above-market pricing | Sanofi: 10% average spend reduction across categories |
| Real-Time Spend Visibility | Combines classified data with external intelligence for live dashboards | Eliminates lag between transaction and insight | Category managers see current spend, not 30-day-old cubes |
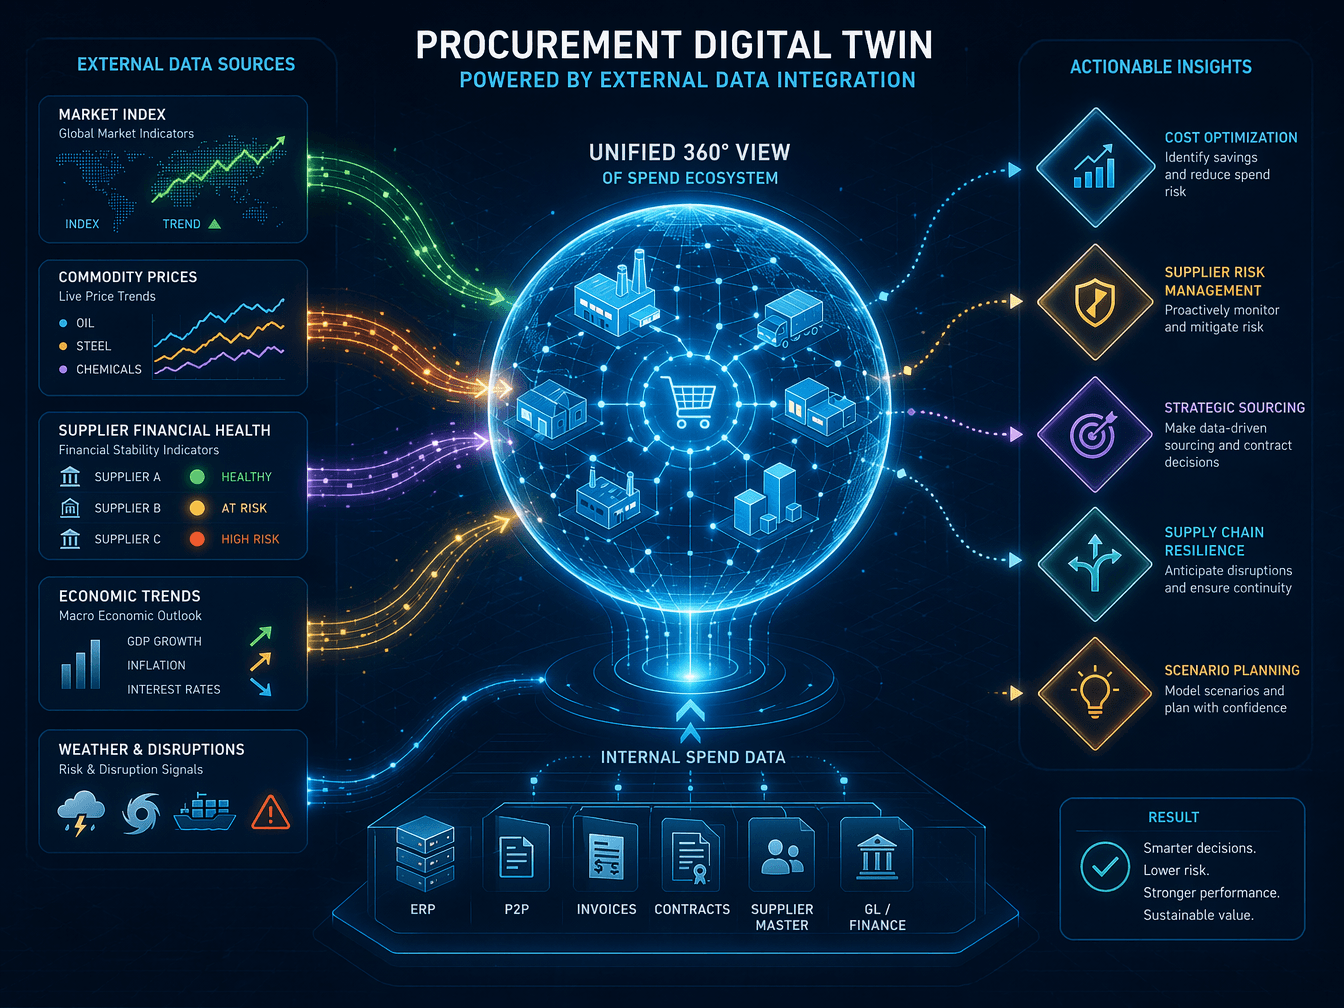
External Data Integration: Building a Digital Twin View of Procurement
The most powerful spend analytics deployments do not stop at internal data. They combine classified spend data with external market intelligence to create what practitioners increasingly call a "digital twin" of the procurement ecosystem — a continuously updated, multi-dimensional view that reflects not just what the organization has spent, but what it should be spending and what risks are emerging.
The data architecture required to support this involves several integration layers:
- Commodity price indices and market benchmarks: Real-time feeds for key raw materials (steel, aluminum, chemicals, semiconductors, agricultural commodities) enable predictive pricing models and should-cost estimates to reflect current market conditions rather than trailing indicators.
- Supplier financial health scores: Credit ratings, payment behavior data, and financial statement analysis provide early warning of supplier distress that could disrupt supply. Natural language processing can capture data from external sources such as market indices, company credit ratings, social media, and publicly available information about suppliers to spot opportunities and risk.
- Economic indicators and geopolitical risk data: GDP forecasts, inflation rates, trade policy changes, and regional stability assessments help procurement teams anticipate macro-level cost pressures and adjust sourcing strategies accordingly.
- Sustainability and compliance data: Carbon emissions scores, labor practice ratings, and regulatory compliance databases enable procurement to factor ESG criteria into category strategy without manual research.
The integration challenge should not be underestimated. Most procurement functions run on five to ten separate point solutions, none of which were designed to share a data model. Building the data pipeline that connects internal ERP data with external feeds requires investment in data engineering, API management, and data governance — and it is the single most common reason that AI spend analytics initiatives stall. As Gartner noted in 2025, 74% of procurement leaders say their data is not AI-ready.
Verified ROI: What the Data Shows
The ROI evidence for ML-driven spend analytics is among the strongest of any AI application in procurement. Multiple independent sources converge on a consistent set of outcomes, though the specific figures vary by deployment scope and organizational maturity.
| Metric | Source | Reported Figure | Context |
|---|---|---|---|
| Procurement spend reduction | McKinsey, 2024 | 5–15% | AI-enabled distribution operations |
| Classification accuracy improvement | Oracle/KPMG, 2023 | >90% | Water treatment company deployment |
| Category strategy development time reduction | McKinsey (Teva Pharmaceuticals, WEF Lighthouse) | 90% | Analytics-driven procurement with automated spend cube |
| Spend reduction via should-cost modeling | McKinsey (Sanofi, WEF Lighthouse) | 10% average | Applied across multiple categories |
| Tender evaluation time reduction | McKinsey (Sanofi, WEF Lighthouse) | Two-thirds reduction | Advanced analytics platform |
| Savings increase from digitally enabled negotiations | McKinsey (Sanofi, WEF Lighthouse) | 281% | Compared to pre-AI baseline |
| Value creation pipeline increase | McKinsey | Up to 200% | AI-enabled procurement organizations |
| CPOs prioritizing spend analytics for GenAI | Deloitte 2025 Global CPO Survey | 53.44% | Top priority among all GenAI use cases |
The Deloitte finding that 53.44% of CPOs cite spend analytics and dashboarding as their top GenAI priority underscores the market's recognition that this is not a speculative use case — it is the most immediate, highest-confidence application of AI in procurement today. The McKinsey estimate that AI can increase the value creation initiatives pipeline by up to 200% further reinforces the point: organizations that get spend analytics right do not just reduce costs; they fundamentally expand the set of value-creation opportunities they can identify and pursue.
Implementation Best Practices for Analytics Leaders
Deploying ML-driven spend analytics is as much an organizational challenge as a technical one. The following practices, drawn from documented implementations and industry guidance, provide a starting framework for analytics directors and category managers.
Start with Data Cleansing and a Single High-Value Category
The most common failure mode in spend analytics AI projects is attempting to classify all spend categories simultaneously. The data quality requirements, category complexity, and supplier diversity vary so widely across categories that a single model trained on all spend data will underperform across the board. A better approach is to select one high-value category — IT services, logistics, or packaging, for example — where the spend volume justifies the investment and the category manager is willing to participate in the human review loop. Prove the model works in that category, then expand.
McKinsey's guidance reinforces this: focus on five or six high-value digital and AI use cases, applying the Pareto principle that a handful of data products deliver 60% to 80% of the value at stake. Trying to boil the ocean with a comprehensive spend analytics platform from day one is a recipe for budget overruns and stakeholder fatigue.
Use a Human-in-the-Loop Governance Model
Full automation of spend classification is neither achievable nor desirable. The Sievo 80/20 rule — 80% automated, 20% human-reviewed — reflects the reality that some transactions require contextual knowledge that no algorithm can replicate. The governance question is not whether to include human review, but how to design the review workflow so that it improves the model over time rather than becoming a bottleneck.
Three governance models exist, and the right choice depends on the maturity of the deployment:
- Human-in-the-loop: Every classification output is reviewed before it is accepted. Appropriate for the initial training phase and for high-risk categories where classification errors have significant consequences.
- Human-on-the-loop: The AI operates autonomously for routine, high-confidence classifications but escalates low-confidence items and anomalies to human reviewers. This is the most common model for mature deployments.
- Human-out-of-the-loop: No real-time human intervention. Suitable only for well-established, stable categories where the model has demonstrated sustained accuracy over multiple quarters.
The "trust-but-verify" principle applies throughout: even in autonomous mode, periodic audits of classification accuracy are essential to detect model drift — the gradual degradation of performance that occurs when purchasing patterns, supplier landscapes, or category definitions change.
Partner with IT from the Beginning
Spend analytics AI initiatives fail when procurement treats them as a standalone project. The data integration requirements — connecting ERP instances, procurement systems, P-card feeds, and external market data sources — require IT involvement for API access, data governance, and security compliance. McKinsey's guidance is explicit: partner with IT from the beginning. Procurement teams that attempt to build AI capabilities in isolation often find that their models cannot access the data they need, or that the data pipeline breaks when the IT team makes unannounced changes to source systems.
For a detailed step-by-step implementation roadmap covering data readiness, model selection, pilot design, and scaling, see the How to Implement Machine Learning in Procurement: A 6-Step Roadmap from Pilot to Scale guide on ChainSignal.
Address Data Quality Without Waiting for Perfection
One of the most persistent barriers to AI adoption in procurement is the belief that data must be perfect before ML can add value. The evidence suggests the opposite: 8 out of 10 organizations implementing AI in procurement experienced improved data quality as a result, according to APQC data cited by the Art of Procurement. The act of deploying ML classification forces data quality issues to the surface — inconsistent vendor names, missing commodity codes, duplicate supplier records — and the human review process that accompanies ML deployment systematically resolves them.
The practical implication is that procurement teams should not wait for a multi-year data cleansing initiative before starting. Begin with the data you have, classify it with ML, and use the classification process itself to identify and fix the most critical data quality issues. The model will improve as the data improves, creating a virtuous cycle rather than a sequential dependency.
Comments
Join the discussion with an anonymous comment.