
In the first two or three days after a major earthquake, the supply chain question is rarely abstract. A logistics team needs to know whether trucks can reach a warehouse, whether a port access road is blocked, whether a supplier site is damaged enough to trigger an alternate source, and whether inventory should be redeployed before the next confirmed report arrives. AI supply chain earthquake damage assessment is useful only if it moves those assets out of the unknown column quickly enough to change those calls.
The best systems do not magically remove uncertainty. They compress one part of the response cycle: turning satellite or UAV imagery into classified damage signals. That is different from saying the whole decision cycle drops to minutes. Imagery has to exist, cloud cover and viewing angle matter, models classify what they can see, and someone still has to decide whether a red polygon on a map means reroute, inspect, substitute, hold, or escalate.
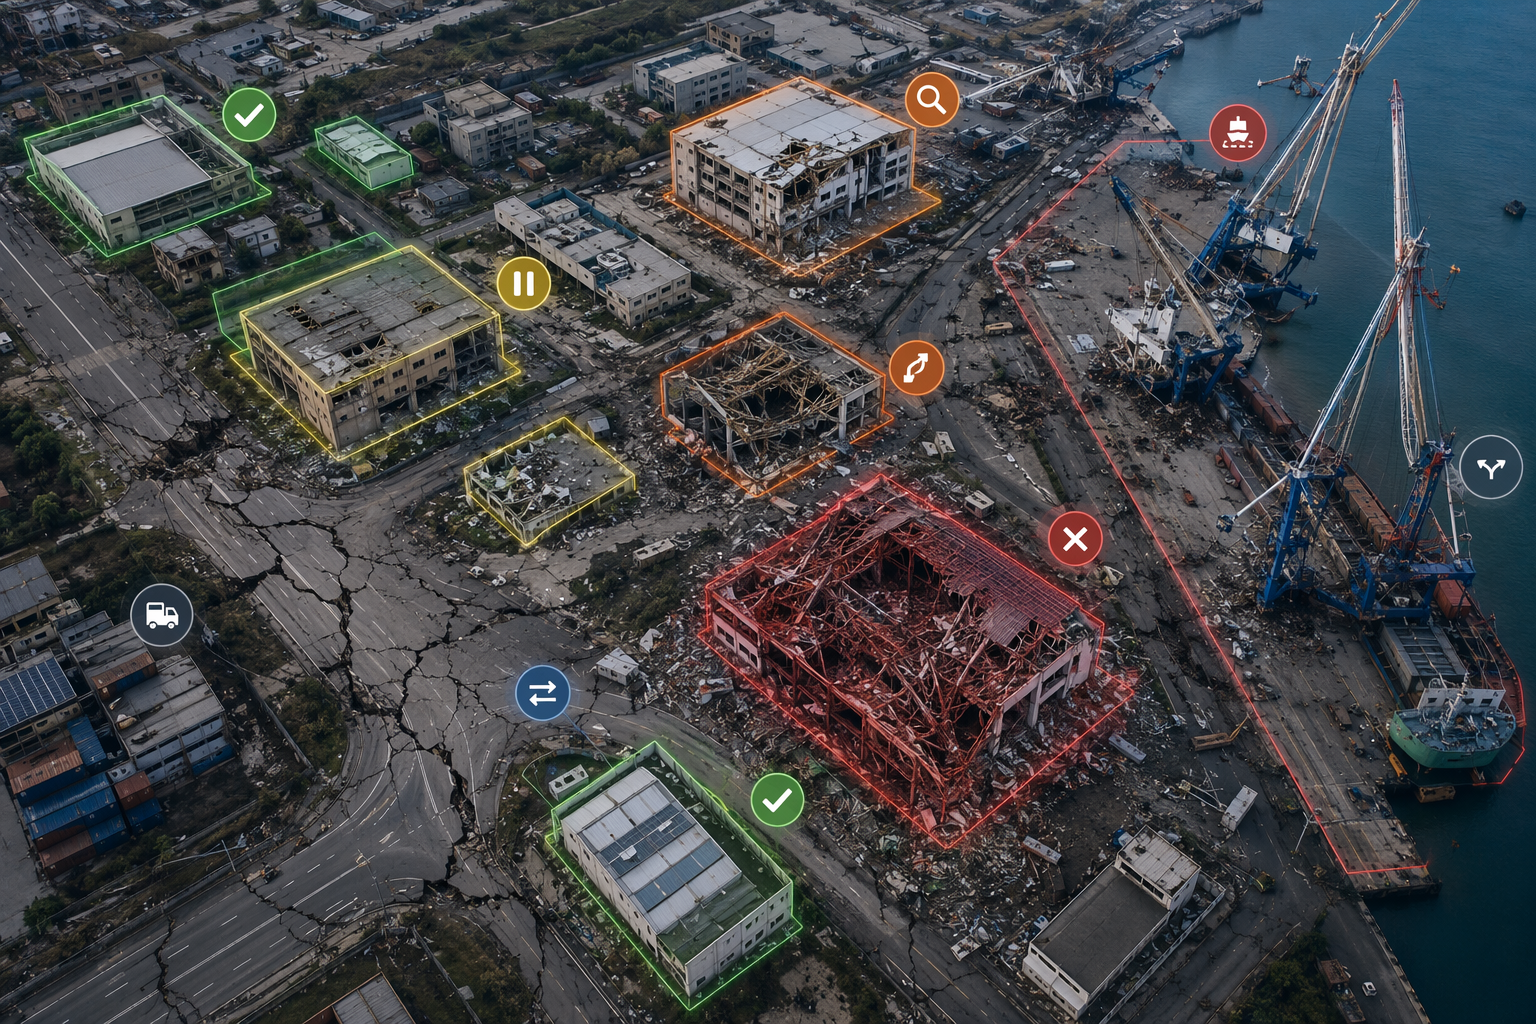
What changed in Turkey was not the idea of AI damage mapping, but its operational use
The 2023 Turkey-Syria earthquake gave AI damage assessment a more serious test than a benchmark leaderboard. The xView2 system, developed from a Defense Innovation Unit challenge, processed satellite images in about five minutes once imagery was available, and its damage maps were used by organizations including UN INSARAG, the World Bank, and the Red Cross. MIT Technology Review reported that the system’s damage classification accuracy across multiple disasters was around 85% to 90%.[1]
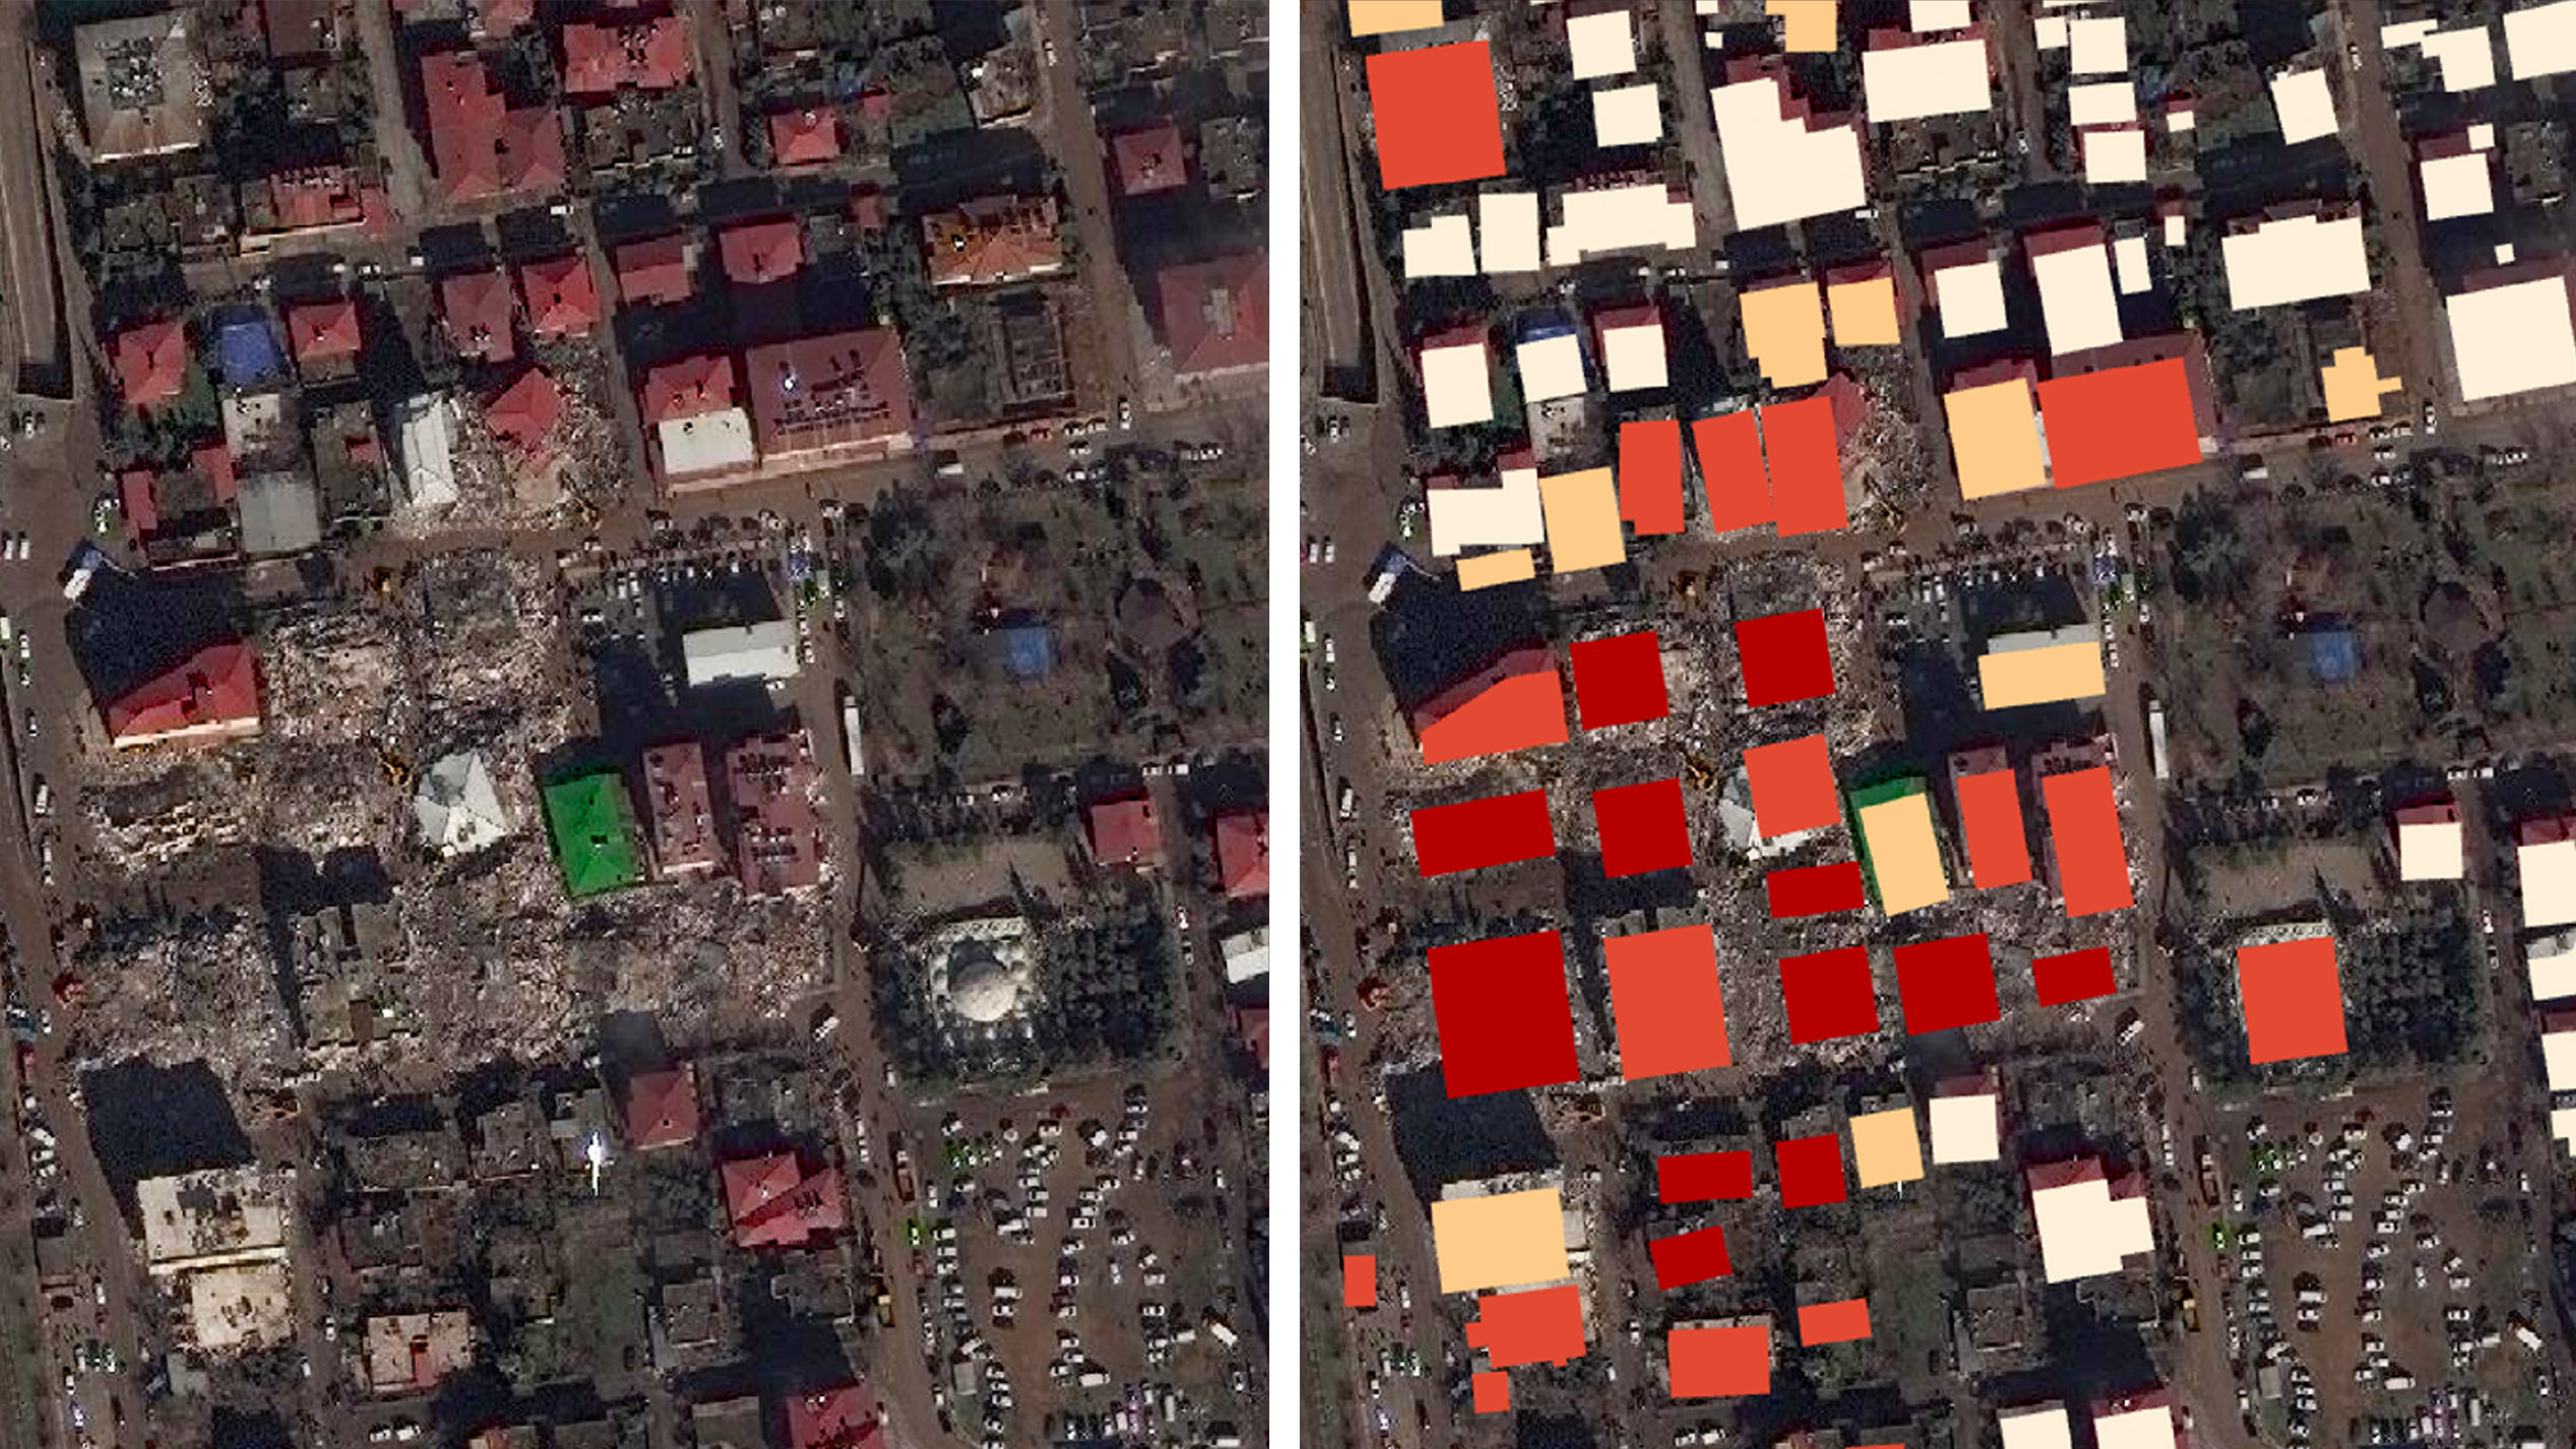
For a humanitarian response team, that can help prioritize search, shelter, and relief distribution. For a supply chain team, the same map becomes useful only after the damage signal is translated into operational categories. A collapsed distribution building, a damaged access road, and a lightly affected supplier compound may all appear in the same damage layer, but they do not create the same decision.
The five-minute runtime matters because it proves image analysis does not have to be the bottleneck. It should not be confused with five-minute situational awareness. In Turkey, first usable satellite images arrived three days after the quake, so the upstream data gap remained real even though model processing was fast once images were available.[1]
That distinction is where many AI pitches get too loose. If the first usable image arrives after the initial routing decisions have already been made, a fast model can still support the second wave of decisions: where to position replacement stock, which suppliers need inspection, and which lanes can reopen. It may not change the first convoy.
The practical workflow: from pixels to supply chain action
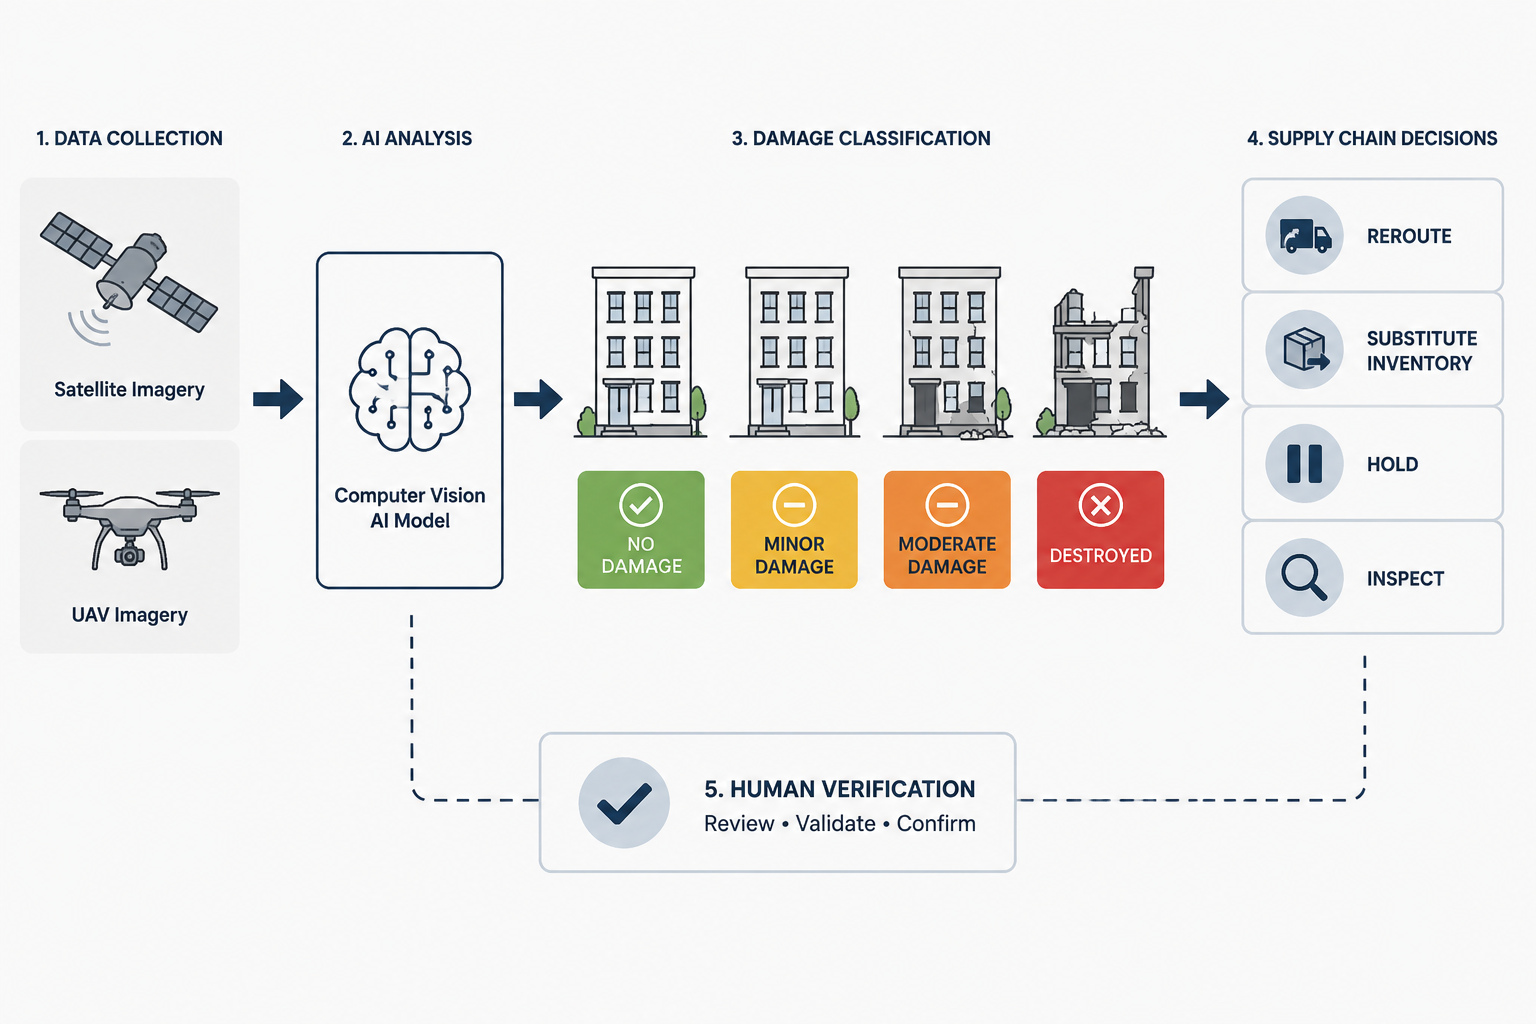
A usable post-earthquake workflow has more steps than “run AI on imagery.” It starts with asset context. The model may classify buildings across an affected region, but the supply chain team needs to know which of those buildings are DCs, supplier plants, cold-storage sites, port facilities, cross-docks, fuel depots, or road segments that constrain a route.
| Workflow point | What the AI contributes | Supply chain decision it can support |
|---|---|---|
| Imagery intake | Satellite or UAV images after the earthquake | Decide whether the region has enough visual coverage to act or needs more collection |
| Asset localization | Building, facility, or road identification in the image | Match damaged structures to warehouses, suppliers, terminals, or route constraints |
| Damage classification | Severity labels such as no damage, minor, major, or destroyed | Prioritize rerouting, inspection, substitute sourcing, or inventory redeployment |
| Business-rule translation | Damage signals joined to network data, orders, inventory, and supplier records | Convert a map layer into holds, lane changes, alternate suppliers, or exception workflows |
| Human verification | Review of uncertain, high-impact, or conflicting signals | Avoid overreacting to false damage labels or missing operational facilities |
The localization step deserves attention because it is not the same as damage classification. IBM’s review of the xView2 challenge describes a two-stage U-Net approach: first binary semantic segmentation to localize buildings, then ordinal classification to assign damage severity. The reported F1 score was 0.81 for building localization and 0.66 for damage classification, using the xBD dataset of 850,736 annotated buildings across 19 disasters.[2]
That gap between localization and classification is not academic trivia. A system may be good at finding buildings and less reliable at judging whether a particular one is moderately damaged. For supply chain use, that difference affects the safest action. If a major distribution center is clearly destroyed, the response is usually reroute and redeploy. If a supplier site is tagged as minor or major damage with lower confidence, the next step may be targeted inspection, not automatic supplier replacement.
This is where integration determines whether the model is actually useful. A damage layer sitting in a GIS viewer may help a crisis team, but procurement and logistics teams need the output joined to supplier IDs, lane plans, inventory positions, open purchase orders, carrier appointments, and customer allocation rules. Otherwise, the map still leaves someone manually asking which red boxes matter.
Reroute, hold, substitute, inspect: the decision categories matter more than the color ramp
A sensible implementation does not ask operators to interpret every model output from scratch. It predefines what a damage class means for different asset types. A destroyed bridge on a preferred route may trigger an immediate lane exception. A major-damage classification on a single-source supplier may open an alternate-source review. A moderate-damage classification on a warehouse with inventory inside may create a hold-and-inspect task before stock is counted as available.
Those rules should be conservative where false positives are expensive. A facility wrongly labeled destroyed can pull orders to a more expensive supplier, overload a backup DC, or consume scarce transport capacity. A missed damage signal can leave inventory stranded or route trucks toward blocked infrastructure. The risk is asymmetric by asset: misclassifying a port road is different from misclassifying a secondary office building at a supplier campus.
The internal planning analog is closer to AI-enabled disruption planning than to a standalone computer vision project. Damage assessment is the signal. The business value comes when that signal changes routing, sourcing, inventory, or inspection priority before slower reports arrive.
Ground truth still changes the answer
Hybrid assessment matters because overhead imagery can miss operational status. HSAT’s Turkey earthquake logistics assessment combined seismic data, satellite imagery, and on-ground data collectors, delivering a full logistics assessment in 48 hours. One of its important findings was that some factories reported by media as destroyed were actually operational.[3]
That case cuts both ways. It supports faster remote assessment, but it also shows why a supply chain team should not treat any image-derived label as the final business state of a facility. A building may show visible damage and still run limited operations. Another may look intact from above while utilities, access roads, labor availability, or interior equipment damage prevent production.
The most useful governance pattern is to reserve human verification for the decisions that carry cost or safety consequences. A low-value secondary site can wait. A high-volume supplier, sole-source material, temperature-controlled warehouse, port gate, or bridge feeding a relief and commercial corridor should be moved into a higher review queue when the model output is severe, uncertain, or contradicted by another source.
Different models see different kinds of damage
The model choice should follow the asset and damage question. A satellite-based building damage model is a reasonable fit for wide-area triage. It is less suited to façade cracks, partial collapses hidden by roof geometry, or operational conditions inside a facility. A UAV-based approach can close some of that gap, but it requires access, flight permissions, and collection capacity near the disaster zone.
Hiroshima University’s single-image convolutional neural network took a different path from before-and-after comparison. It used only post-event aerial images and reported 94% accuracy for classifying collapsed versus non-collapsed buildings. The system could classify 10,000 buildings in minutes, but the reported limitation was moderate damage: distinguishing damage levels between clearly collapsed and clearly non-collapsed remained difficult.[4]
That is a strong capability for rapid collapse screening. For supply chain decisions, it is also a warning about category design. A collapsed-versus-not-collapsed model can quickly find severe loss, but many network decisions sit in the middle: a warehouse with partial structural damage, a supplier plant with cracked walls, a road with passable but risky conditions, or a loading area that can operate only after inspection.
Ohio State’s LEGG model points at that middle problem from another direction. Published in 2026, the approach uses a LoRA fine-tuned diffusion model to generate photorealistic ground-level views from UAV orthophotos, helping detect façade cracks and partial collapses that may be invisible from satellite overhead. It was validated on about 3,000 structures from the 2023 Turkey earthquake.[5]
That does not make generative reconstruction a universal replacement for satellite damage mapping. It suggests a division of labor: satellite models for fast regional triage, UAV-supported methods for facility-level clarification, and field teams for the operational facts imagery cannot settle. A procurement team deciding whether to activate an alternate supplier may not need façade-level detail for every site. It may need that detail for the few facilities whose status changes allocation, production, or contractual commitments.
The disaster periphery is where supply chain use gets harder
Humanitarian damage mapping often concentrates on the most heavily affected zones because that is where urgent life-safety needs are clearest. Supply chain exposure does not always line up so neatly. A critical supplier, regional warehouse, inland terminal, or spare-parts depot may sit near the edge of the disaster footprint, where damage is patchier and model confidence may be less stable.
A Direct Relief and Stanford comparison reported that Microsoft AI for Good and Google models disagreed on damage extent for facilities outside the most heavily affected zones. The finding is especially relevant for supply chain nodes at the disaster periphery, where a facility may be important to a network even if it is not in the area drawing the most visible disaster attention.[6]
This is not an argument against using AI. It is an argument against buying a single score without understanding the model’s training data, image requirements, asset coverage, and uncertainty handling. If two credible models disagree around peripheral facilities, the workflow should surface the disagreement rather than hide it behind a clean dashboard status.
For a supply chain control tower, disagreement can be operationalized. Conflicting model outputs on a high-priority facility should create an inspection task, a supplier check-in, or a temporary planning assumption. Conflicting outputs on a low-priority site may simply lower confidence until better imagery arrives. The point is not to resolve every discrepancy immediately; it is to route scarce human attention to the discrepancies that can change the network plan.
Procurement integration is still emerging, but the direction is visible
Most of the strongest evidence for AI earthquake damage assessment comes from humanitarian and civil infrastructure contexts, not from mature commercial supply chain deployments. That matters. A tool built to prioritize rescue and relief is not automatically configured to answer which tier-two supplier should receive a capacity check or which purchase orders need reallocation.
There are signs of the procurement direction. The Defense Logistics Agency reported using battle damage assessment models to analyze 43,000 vendors and flag more than 19,000 as high-risk, illustrating how AI-derived risk signals can be connected to vendor records rather than left as a separate imagery product.[7]
That example should be treated as evidence of integration pattern, not as a ready-made commercial benchmark for earthquake response. The relevant lesson is that damage assessment becomes more useful when tied to master data: supplier location, part criticality, alternate-source qualification, inventory buffers, transport lanes, and contract constraints.
A buyer evaluating this use case should ask whether the vendor can ingest the organization’s actual network map and return decision-ready exceptions. “Major damage detected within the earthquake zone” is a warning. “Primary supplier for SKU family X has major-damage signal, no qualified alternate within current allocation, inspection required before release of next purchase order” is a workflow.
What to require from an AI earthquake damage assessment vendor
The evaluation should start with latency, but not stop there. Ask vendors to separate image acquisition time, preprocessing time, model runtime, human review time, and integration time into the planning system. A five-minute model can still produce a late decision if imagery arrives after the window has closed or if the output waits in an analyst queue.
- Asset fit: whether the model is trained and validated for the assets that matter to the network, such as warehouses, factories, roads, ports, terminals, or supplier campuses.
- Damage categories: whether the model distinguishes the levels that drive different actions, especially moderate damage rather than only collapse.
- Imagery plan: whether the system depends on post-event satellite availability alone or can incorporate UAV and field inputs when satellite imagery is delayed or insufficient.
- Uncertainty handling: whether the platform exposes confidence, model disagreement, and missing coverage instead of forcing a false green-yellow-red certainty.
- Workflow integration: whether outputs can trigger route exceptions, supplier checks, inventory holds, inspection tasks, or procurement alerts inside existing systems.
- Verification design: whether high-impact decisions require human review, field confirmation, or a second data source before execution.
A pilot should use historical earthquake imagery and the company’s real network footprint where possible. The test is not whether the model can produce an impressive damage map. It is whether the system would have changed the first 48 to 72 hours of decisions: which lanes were closed, which suppliers were contacted, which inventory was protected, and which assumptions were wrong.
Related disaster-planning capabilities can sit alongside this use case. Earthquake assessment is post-event infrastructure intelligence; AI hurricane supply chain planning and AI flood disruption planning tend to lean more heavily on forecast timing, exposure modeling, and pre-positioning. The operating question is different, but the integration requirement is similar: the signal has to reach the people who can still change the plan.
The grounded buying judgment
AI earthquake damage assessment is mature enough to inform faster post-quake supply chain decisions, especially when paired with satellite and UAV feeds and connected to control tower, procurement, logistics, or risk workflows. The strongest evidence supports a narrower claim than many sales decks make: AI can dramatically reduce the image-analysis portion of damage assessment once usable imagery is available, and it can help teams prioritize action before conventional assessment catches up.
It should be purchased and governed as a decision-support layer. The system can move a facility from unknown to suspected destroyed, likely operational, needs inspection, or conflicting evidence. It should not be allowed to quietly turn an uncertain visual classification into an irreversible sourcing or logistics decision without review where the stakes are high.
The evaluation question is not simply, “Can the model detect earthquake damage?” It is, “Can this system produce a reliable enough infrastructure signal, soon enough, in the locations where our network decisions are actually made?”
References
- This AI could predict 85% of building damage after disasters—and it’s already helping in Turkey, MIT Technology Review, February 20, 2023, https://www.technologyreview.com/2023/02/20/1068824/ai-actually-helpful-disaster-response-turkey-syria-earthquake/
- The xView2 AI challenge, IBM Think, https://www.ibm.com/think/insights/the-xview2-ai-challenge
- Turkey Earthquake Logistics Assessment, HSAT, https://hsat.ai/case-study-turkey-earthquake.html
- AI makes quick work of earthquake damage assessment, ASCE Civil Engineering, December 2020, https://www.asce.org/publications-and-news/civil-engineering-source/civil-engineering-magazine/issues/magazine-issue/article/2020/12/ai-makes-quick-work-of-earthquake-damage-assessment
- LEGG: LoRA-enhanced ground-view generation for building damage assessment using UAV imagery, International Journal of Remote Sensing, 2026, https://www.tandfonline.com/doi/full/10.1080/01431161.2026.2628294
- After Disaster, AI Models Support Rapid Understanding of Health Facility Damage, Direct Relief, December 2025, https://www.directrelief.org/2025/12/after-disaster-ai-models-support-rapid-understanding-of-health-facility-damage/
- Utilization of Artificial Intelligence (AI) to Illuminate Supply Chain Risk, Defense Logistics Agency, https://www.dla.mil/About-DLA/News/News-Article-View/Article/4186367/utilization-of-artificial-intelligence-ai-to-illuminate-supply-chain-risk/
Comments
Join the discussion with an anonymous comment.