Why Most AI Inventory Business Cases Fail
The typical pitch for AI inventory management software reads like a wish list: fewer stockouts, lower carrying costs, happier customers. It is not that these outcomes are wrong — it is that the business case fails to connect them to the CFO’s specific decision criteria. A vague promise of “better forecasting” does not survive a capital allocation review when competing against a new production line, a warehouse expansion, or a supplier consolidation project.
Three structural problems recur in failed business cases. First, they ignore data readiness: according to Deloitte’s 2025 Global CPO Survey, only 31% of organizations had the data infrastructure ready for AI inventory optimization without significant remediation. A business case that assumes clean, integrated data from day one is a fantasy. Second, they promise unrealistic timelines — the same Deloitte survey found that only 6% of organizations saw ROI in under a year, with most achieving satisfactory returns within two to four years. Third, they ignore the organizational friction of manual overrides: Gartner reports that 38% of organizations manually override AI recommendations more than 40% of the time. A system whose output gets ignored cannot deliver its modeled benefits.
A credible business case for AI inventory management must do three things: anchor every benefit claim to a sourced benchmark, account for the full cost of ownership including data remediation, and frame the value in terms the CFO already uses — working capital release, risk-adjusted ROI, and payback period. The framework below is designed to do exactly that.
The Five Value Levers of AI Inventory Management
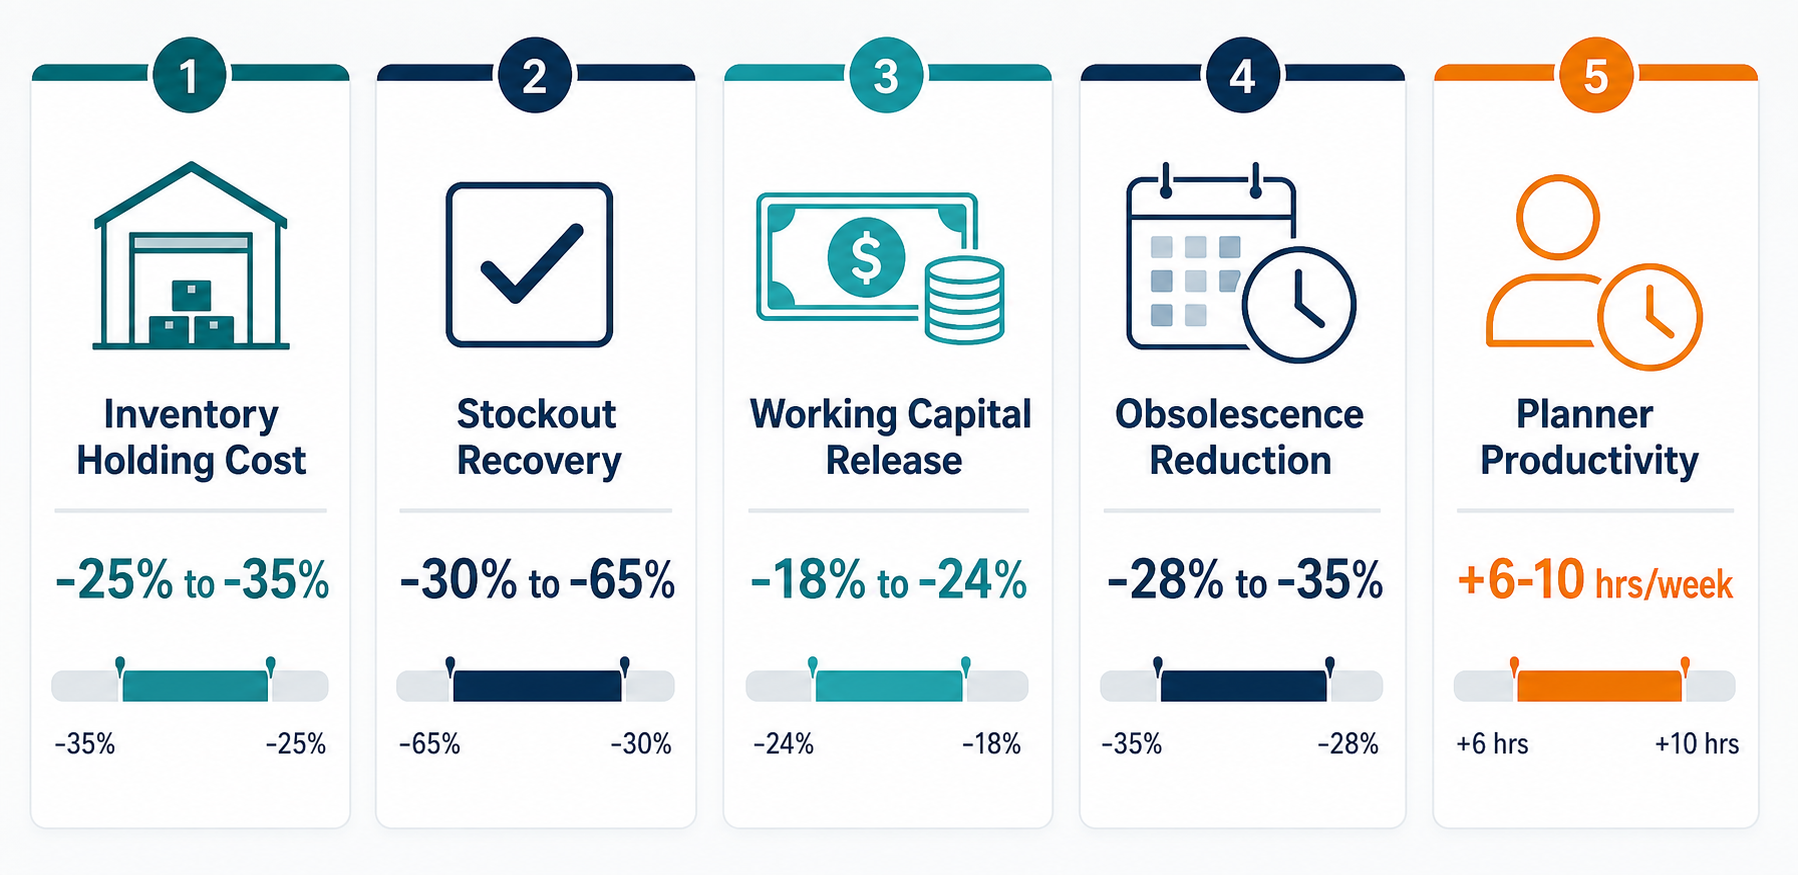
Every dollar of inventory optimization value flows through one of five channels. The table below summarizes each lever with its definition, the quantified range reported by independent analysts, and the source organization. These are not vendor claims — they are drawn from multi-company surveys and benchmark studies.
| Value Lever | Definition | Quantified Range | Source |
|---|---|---|---|
| Inventory holding cost reduction | Lower warehousing, insurance, financing, and shrinkage costs from reduced average inventory levels | 25–35% average; top-quartile up to 45% | Deloitte 2025 |
| Stockout / lost-sales recovery | Fewer stockout events and faster replenishment of out-of-stock items, recovering revenue that would otherwise be lost | 30–65% reduction in stockouts | Gartner 2025 |
| Working capital release | Cash freed by reducing the total value of inventory held across the network | 18–24% lower inventory value vs. peers | IBM IBV |
| Obsolescence / write-off reduction | Less inventory that expires, becomes obsolete, or must be discounted before sale | 28–35% reduction in write-offs | Deloitte 2025 |
| Planner productivity | Hours per week reclaimed by automating routine replenishment and exception-handling tasks | 6–10 hours/week saved per professional | IBM IBV |

These levers do not operate in isolation. A reduction in average inventory levels (lever 1) directly drives working capital release (lever 3). Fewer stockouts (lever 2) reduce the need for safety stock, which further lowers carrying costs. The compounding effect is why companies with AI-mature supply chains are 23% more profitable than their peers, according to an Accenture study of 1,148 companies across 10 industries and 15 countries.
The ROI Formula: A Worked Example
A structured ROI calculation translates the five levers into a single number the CFO can evaluate. The following worked example is adapted from a model published by ToolsGroup, a vendor in the inventory optimization space. It is not presented as a guarantee — it is a structural template you can populate with your own baseline data.
| Category | Before AI | After AI | Annual Benefit |
|---|---|---|---|
| Average inventory value | $10,000,000 | $7,500,000 | $1,200,000 (carrying cost at 15%) |
| Stockout-related lost sales | $500,000 | $200,000 | $300,000 recovered |
| Write-offs / obsolescence | $300,000 | $150,000 | $150,000 saved |
| Planner productivity (10 planners) | Baseline | 8 hrs/week reclaimed each | $100,000 (at $50/hr loaded cost) |
| Working capital benefit | N/A | 20% reduction on $10M base | $1,000,000 (at 6% cost of capital) |
| Total annual benefit | $2,750,000 |
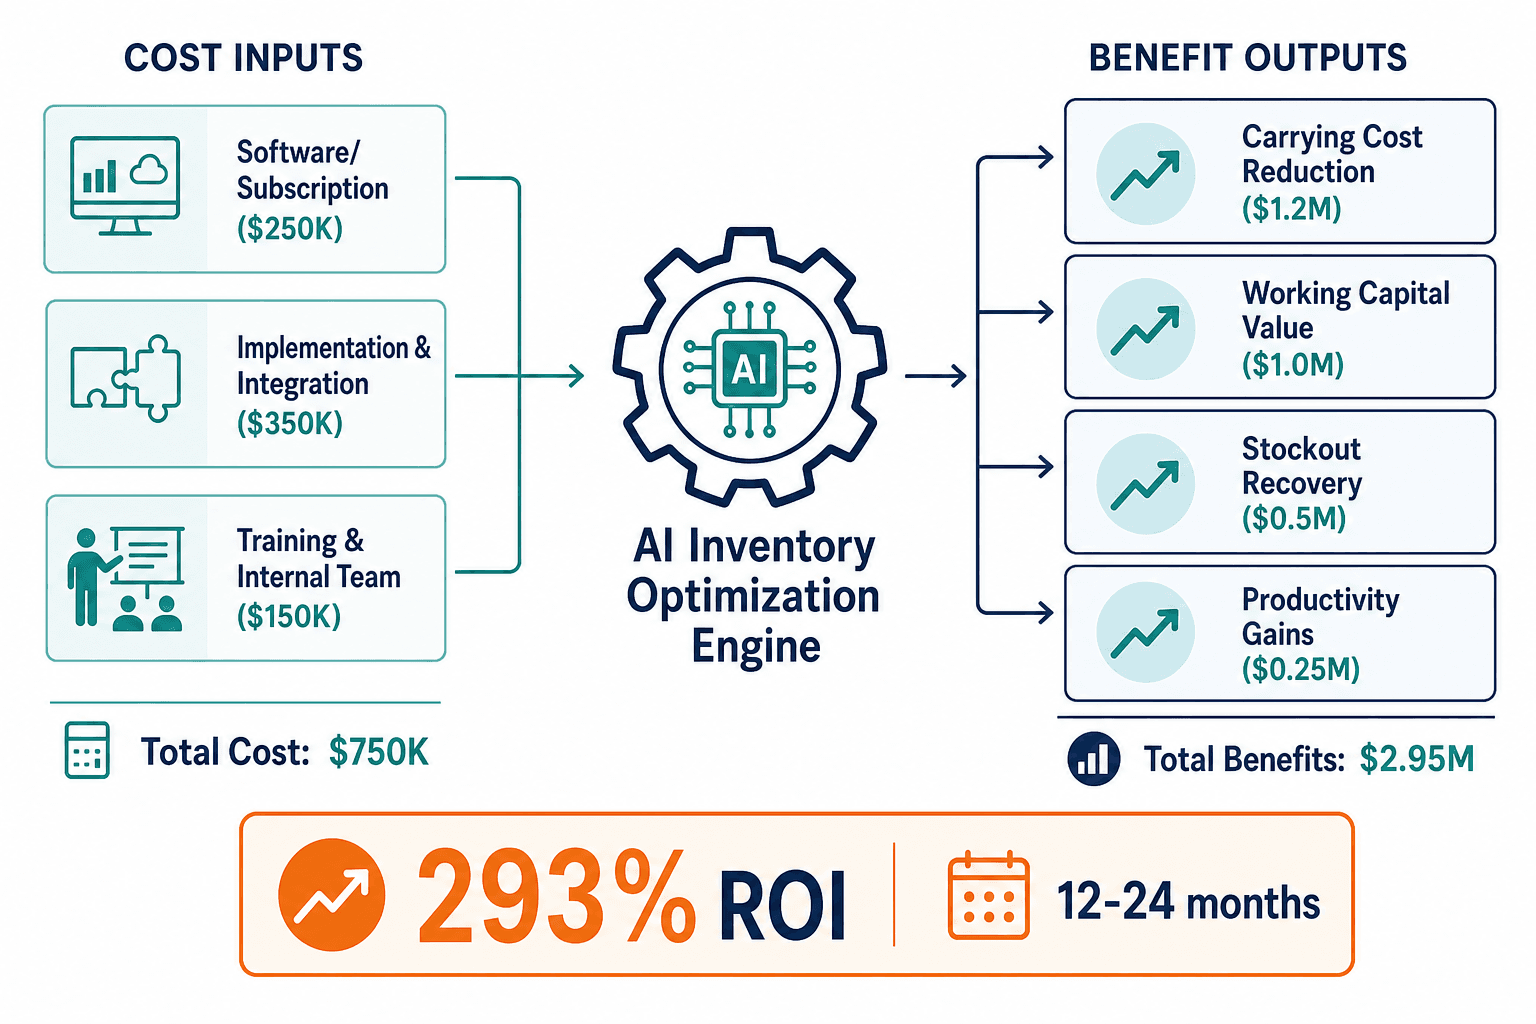
On the cost side, the ToolsGroup model assumes a total investment of $750,000, broken into software licensing ($250,000), implementation and integration services ($350,000), and training and change management ($150,000). The resulting ROI calculation:
ROI = (Annual Benefit − Total Cost) / Total Cost = ($2,750,000 − $750,000) / $750,000 = 267%
The ToolsGroup model itself calculates a 293% ROI on a $2.95M benefit versus $750K cost, using slightly different assumptions about the magnitude of each lever. The key point is not the exact percentage — it is the structure. Every benefit line item maps to one of the five levers, and every cost line item is explicit.
Cost Inputs You Must Include
Underestimating total cost of ownership is the fastest way to lose credibility with a CFO. The table below categorizes every cost input you should include in your business case, with typical ranges based on mid-market to enterprise deployments.
| Cost Category | Description | Typical Range (Year 1) |
|---|---|---|
| Software licensing | Annual SaaS subscription or perpetual license fee for the AI inventory optimization platform | $150,000 – $500,000 |
| Implementation services | Vendor or SI professional services for configuration, model tuning, and process mapping | $200,000 – $600,000 |
| ERP / WMS integration | Technical work to connect the AI platform to your existing ERP (SAP, Oracle, Microsoft Dynamics) and WMS systems | $100,000 – $300,000 |
| Data remediation | Cleaning, normalizing, and enriching historical transaction data to meet the model’s quality requirements | $50,000 – $200,000 |
| Training and change management | End-user training, process documentation, and organizational change management to reduce override rates | $50,000 – $150,000 |
| Internal team allocation | FTE time from supply chain planners, IT, and data engineering teams diverted from other projects | $100,000 – $250,000 (loaded cost) |
The data remediation line item is the most commonly omitted cost. Deloitte’s finding that only 31% of organizations have data ready for AI inventory optimization means the majority will need to invest in data cleaning and integration before the model can produce reliable outputs. If your organization falls into the 69%, budget for this cost explicitly rather than assuming your ERP data is production-ready.
The Data Readiness Qualifier: A Self-Assessment
Before presenting your ROI model to the CFO, you need to know whether your organization’s data infrastructure can support it. The following self-assessment covers the three dimensions that matter most for AI inventory optimization.
- Data quality: Do you have at least 24 months of clean, granular transaction history (SKU-location-day level)? Are stockout events recorded accurately, or are they inferred from negative inventory? If more than 10% of your SKU-location combinations have missing or inconsistent data, you will need remediation before the model can train effectively.
- Integration maturity: Is your ERP, WMS, and demand planning system already integrated through an API or middleware layer, or would the AI platform need to build connections from scratch? The cost and timeline of integration vary significantly depending on whether you run SAP, Oracle, Microsoft Dynamics, or a legacy system.
- Data governance: Who owns inventory data quality? Is there a defined process for correcting errors, handling exceptions, and maintaining master data? Organizations without a data governance function typically spend 3–6 months establishing one before the AI model can operate in production.
If your self-assessment reveals gaps, do not abandon the business case. Instead, include the data remediation cost and timeline explicitly in your ROI model. A business case that acknowledges and budgets for data readiness is more credible than one that assumes perfect data from day one.
The Timeline Reality: 12–24 Months to Satisfactory ROI
The most common disconnect between project sponsors and finance is timeline expectation. Vendor case studies often highlight 6–12 month payback periods, but independent data tells a different story. Deloitte’s 2025 survey found that only 6% of organizations saw ROI in under a year, while the majority achieved satisfactory returns within two to four years.
A realistic timeline follows a phased value curve:
- Months 1–6 (Pilot): Deploy the AI model on a limited SKU set (50–200 SKUs) in a single distribution center or region. Expect modest improvements as the model trains on your data and planners adjust to new workflows. Typical outcome: 5–10% reduction in stockouts on the pilot SKUs.
- Months 7–12 (Limited Production): Expand to 500–2,000 SKUs across multiple locations. Begin to see measurable improvements in forecast accuracy and inventory turns. Typical outcome: 10–15% reduction in average inventory levels on the expanded SKU set.
- Months 13–24 (Full Rollout): Deploy across the full SKU portfolio and all network nodes. The compounding effect of multi-echelon optimization becomes visible. Typical outcome: 18–24% reduction in total inventory value, aligning with the IBM IBV benchmark.
Presenting this phased timeline to the CFO accomplishes two things. It sets realistic expectations about when the investment will start generating returns, and it demonstrates that you have thought through the operational complexity of deployment. For additional context on how these timelines compare across supply chain functions, see our broader AI/ML in Supply Chain ROI Benchmarks and Readiness Gaps article.
Presenting to the CFO: Working Capital Release vs. Headcount Reduction
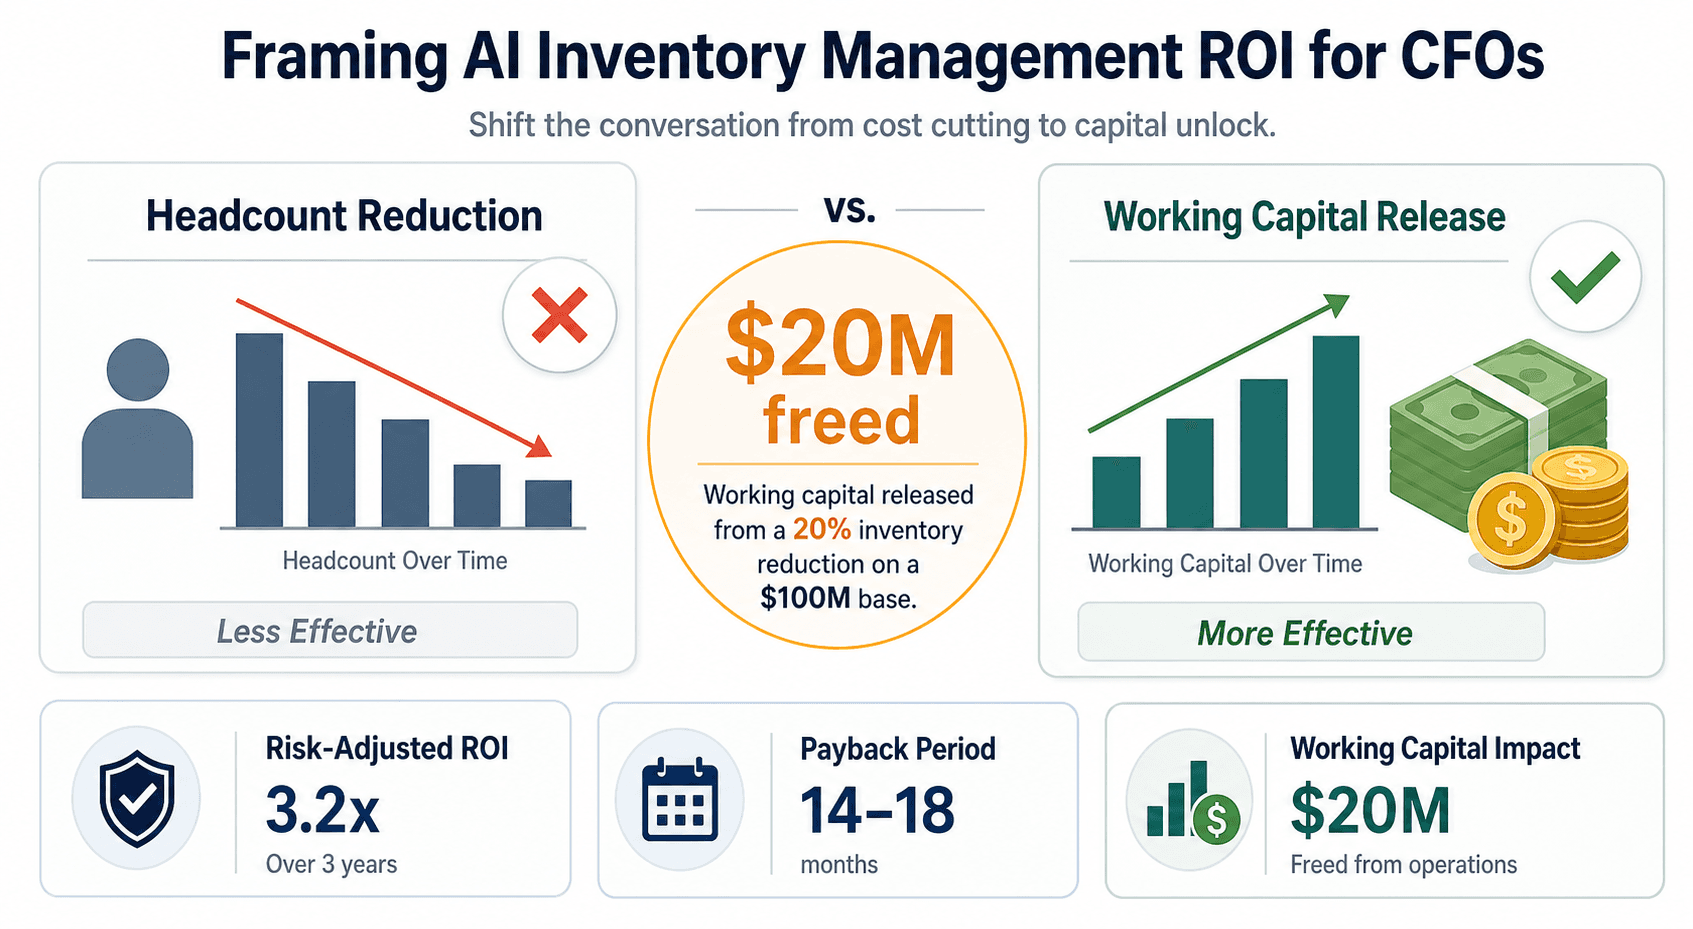
How you frame the business case matters as much as the numbers themselves. CFOs evaluate investment proposals against two criteria: impact on the balance sheet and impact on the income statement. Working capital release hits both.
Consider a company with a $100 million inventory base. A 20% reduction in average inventory — consistent with the IBM IBV benchmark of 18–24% lower inventory value — frees $20 million in working capital. At a 6% cost of capital, that $20 million generates $1.2 million in annual value before counting any direct cost reductions from lower carrying costs, fewer stockouts, or reduced write-offs.
Headcount reduction, by contrast, is a weaker argument for three reasons. First, the savings are smaller: reclaiming 6–10 hours per week per planner (IBM IBV) typically translates to avoiding future hires rather than eliminating current roles. Second, headcount reduction triggers organizational resistance that can undermine adoption and increase override rates. Third, the CFO knows that headcount savings are one-time, while working capital release recurs every year the lower inventory level is maintained.
Three metric cards to include in your CFO presentation:
- Risk-adjusted ROI: Apply a 20–30% discount to projected benefits to account for implementation risk, data quality uncertainty, and the override rate. Present both the base-case and risk-adjusted ROI side by side.
- Payback period: Based on the phased timeline above, the initial investment should be recovered within 14–18 months of full deployment. The ToolsGroup model cites payback periods of 6–12 months, but independent data suggests a more conservative 12–18 month range is realistic.
- Working capital impact: Express the working capital release as a percentage of current inventory value and as an absolute dollar figure. Show the annual value of that release at your company’s weighted average cost of capital.
Risks to Address: Override Rates, Model Degradation, and Vendor Lock-In
Every credible business case includes a risk section. For AI inventory management, three risks are material enough to affect the ROI calculation.
Manual Override Rates
Gartner’s finding that 38% of organizations override AI recommendations more than 40% of the time is not a minor footnote — it is a direct threat to every benefit lever in the business case. If planners routinely reject the model’s output, the projected inventory reduction, stockout recovery, and working capital release will not materialize. Mitigation strategies include:
- Human-in-the-loop design: Require planners to document the reason for each override, creating an audit trail that can be used to improve the model or identify training gaps.
- Override rate monitoring: Track override rates by planner, SKU category, and location. Investigate any team or category where override rates exceed 20%.
- Explainability tools: Ensure the AI platform provides clear, interpretable explanations for each recommendation. Planners are less likely to override a recommendation they understand.
Model Degradation Over Time
AI inventory models are trained on historical patterns. When those patterns change — due to a new product launch, a supplier disruption, a tariff shift, or a demand shock — model accuracy can degrade rapidly. Without ongoing monitoring and retraining, the benefits projected in the business case will erode. Budget for quarterly model retraining and annual architecture reviews as part of the ongoing cost of ownership.
Vendor Lock-In
AI inventory optimization platforms vary significantly in their integration architecture, data models, and output formats. A platform that tightly couples its optimization engine with its data ingestion layer can make it expensive to switch vendors. Mitigate this risk by:
- Requiring API-based integration rather than direct database access, so that switching vendors does not require rebuilding your entire data pipeline.
- Negotiating data portability clauses in the contract that guarantee you can export all model inputs, outputs, and configuration settings in a standard format.
- Maintaining a parallel rules-based planning process during the first 12 months of deployment, so that you can fall back to your existing process if the AI platform underperforms.
For a deeper analysis of the organizational readiness challenges that drive these risks, see our article on the AI inventory optimization strategy gap, which examines why 77% of organizations lack a formal AI deployment plan despite 94% intent to deploy.
One-Page Executive Summary Template
The following template is designed to fit on a single page. Fill in the bracketed fields with your organization’s specific data and present it as the cover page of your business case document.
| Section | Content |
|---|---|
| Problem Statement | Our current inventory planning process relies on [rules-based / spreadsheet / legacy ERP] methods that produce [X]% forecast error, resulting in [Y]% stockout rate and [Z] months of excess inventory. These inefficiencies tie up [$A] in working capital and generate [$B] in annual carrying costs. |
| Recommended Solution | Deploy an AI-driven inventory optimization platform that uses [machine learning / probabilistic forecasting / multi-echelon optimization] to improve forecast accuracy, automate replenishment decisions, and optimize safety stock levels across the network. |
| Quantified Value Levers | Inventory holding cost reduction: 25–35% (Deloitte benchmark) Stockout reduction: 30–65% (Gartner benchmark) Working capital release: 18–24% lower inventory value (IBM benchmark) Obsolescence reduction: 28–35% (Deloitte benchmark) Planner productivity: 6–10 hrs/week reclaimed (IBM benchmark) |
| Cost Summary (Year 1) | Software licensing: $[C] Implementation & integration: $[D] Data remediation: $[E] Training & change management: $[F] Internal team allocation: $[G] Total Year 1 investment: $[H] |
| ROI Timeline | Pilot (months 1–6): 5–10% stockout reduction on pilot SKUs Limited production (months 7–12): 10–15% inventory reduction on expanded SKU set Full rollout (months 13–24): 18–24% total inventory value reduction Risk-adjusted payback period: 14–18 months from full deployment |
| Risk Mitigants | Override rate monitoring and human-in-the-loop design to address the 38% manual override risk (Gartner) Quarterly model retraining to prevent accuracy degradation API-based integration and data portability clauses to prevent vendor lock-in Data readiness assessment completed: [Pass / Remediation required — $E budgeted] |
| Next Steps | 1. Approve [$H] budget for Year 1 investment 2. Initiate data readiness assessment (4–6 weeks) 3. Issue RFP to [3–5] shortlisted vendors 4. Target pilot launch: [Q1/Q2/Q3/Q4 2027] |
Comments
Join the discussion with an anonymous comment.