
Reactive air checks work badly in a large warehouse because the building does not wait for the inspection round. A handheld reading near the shipping office at 10 a.m. says little about what happens by the battery charging area after lunch, near dock doors during a rush, or in a mezzanine zone where heat and humidity collect late in the shift. By the time a worker complaint becomes a maintenance ticket, the useful question is often already lost: what changed, where did it start, and how long were people exposed?
That is where AI for supply chain air quality monitoring becomes an operations tool rather than a wellness add-on. The practical shift is from periodic spot checks to continuous readings for CO₂, PM2.5, PM10, VOCs, humidity, and temperature. Once those readings are time-stamped by zone, the system can show patterns that a supervisor walking the floor would probably miss: CO₂ drifting above 1,500 ppm, particulate spikes around a shift change, VOC readings tied to a process area, or a temperature and humidity combination that explains why one corner of the building keeps producing respiratory complaints.
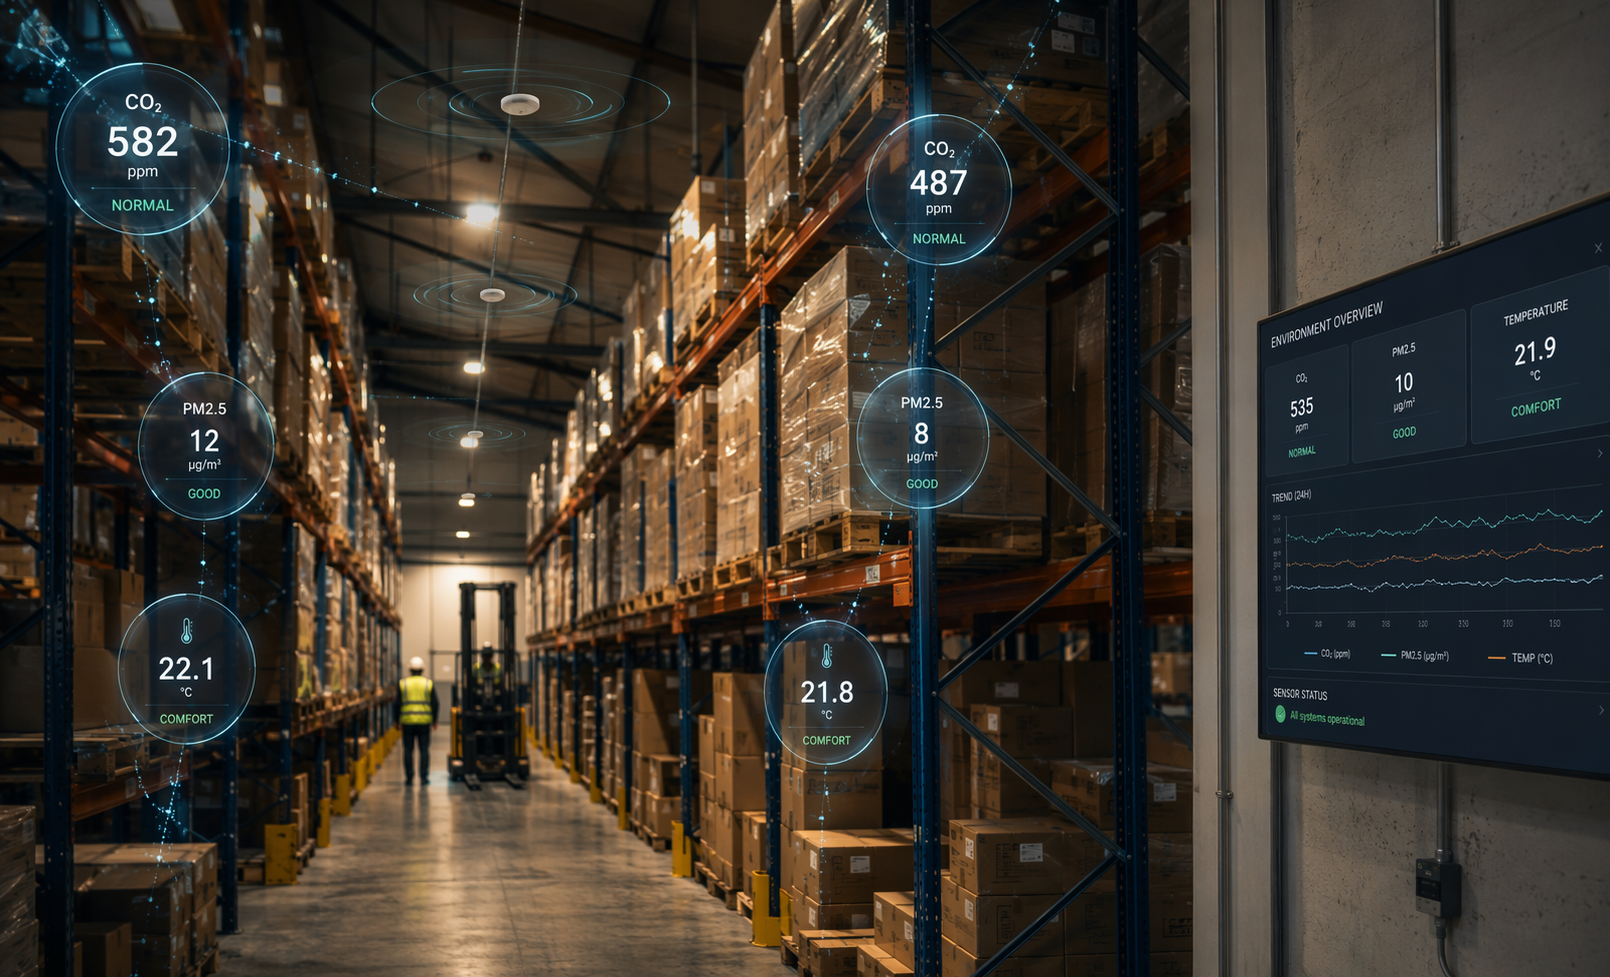
The strongest published numbers in this use case come from Envigilance deployment data: a 40–60% reduction in respiratory complaints within six months, 73% fewer emergency maintenance calls, and a multi-site ROI claim above 5:1, based on $340K in prevented losses against $67K in monitoring costs across 23 locations.[1] Those figures are worth taking seriously because they describe outcomes operators actually feel: fewer people reporting breathing problems, fewer surprise work orders, and a cost case that can survive outside a safety presentation. They also need to be read with the right label attached. This is vendor-published deployment data, not independent third-party research, so it should be treated as evidence from a specific operating context rather than a universal guarantee.
What continuous monitoring catches that spot checks miss
In a warehouse, air quality problems rarely present themselves as one clean event. They show up as a pattern across time, process, weather, building load, and human movement. A dock-heavy building may behave differently on cold mornings than on warm afternoons. A packaging zone may show particulate movement only when a line runs at a certain pace. A ventilation issue may not look serious until readings are compared across several days and matched against complaints or absenteeism.
A continuous IAQ system changes the evidence available to the facility team. Instead of logging one reading and arguing over whether it represented the shift, the team can see how conditions develop, stabilize, or repeat. Machine learning adds value when it recognizes abnormal combinations faster than a person scanning dashboards can: a zone that usually clears CO₂ after a break but no longer does, a humidity pattern that precedes complaints, or recurring particulate spikes that align with a specific operating window.
| Signal | Why it matters operationally |
|---|---|
| CO₂ | Shows whether ventilation is keeping up with occupancy and process load; high readings above 1,500 ppm were tied to an absenteeism reduction case when identified and addressed.[1] |
| PM2.5 and PM10 | Helps locate fine and coarse particulate spikes by zone, shift, or activity instead of treating dust as a general building condition. |
| VOCs | Points attention toward process areas, materials, cleaning activity, charging areas, or other sources that may not be obvious during a short inspection. |
| Humidity and temperature | Explains comfort and respiratory complaint patterns that may be caused by zone conditions rather than worker preference or isolated HVAC complaints. |
The point is not to collect more readings for their own sake. The point is to stop treating air quality as a complaint file. A reading becomes useful when it changes what someone does next: opens an investigation, adjusts airflow, changes a maintenance schedule, validates a repair, or shows that one building needs capital attention before another.
The operating loop: sensors, pattern recognition, HVAC response
A working deployment has a simple shape, even if the engineering behind it is more complex. Sensors collect live readings. The analytics layer compares those readings with normal patterns for that zone and time. The system flags anomalies or developing risks. Then a person, control system, or work-order process acts.
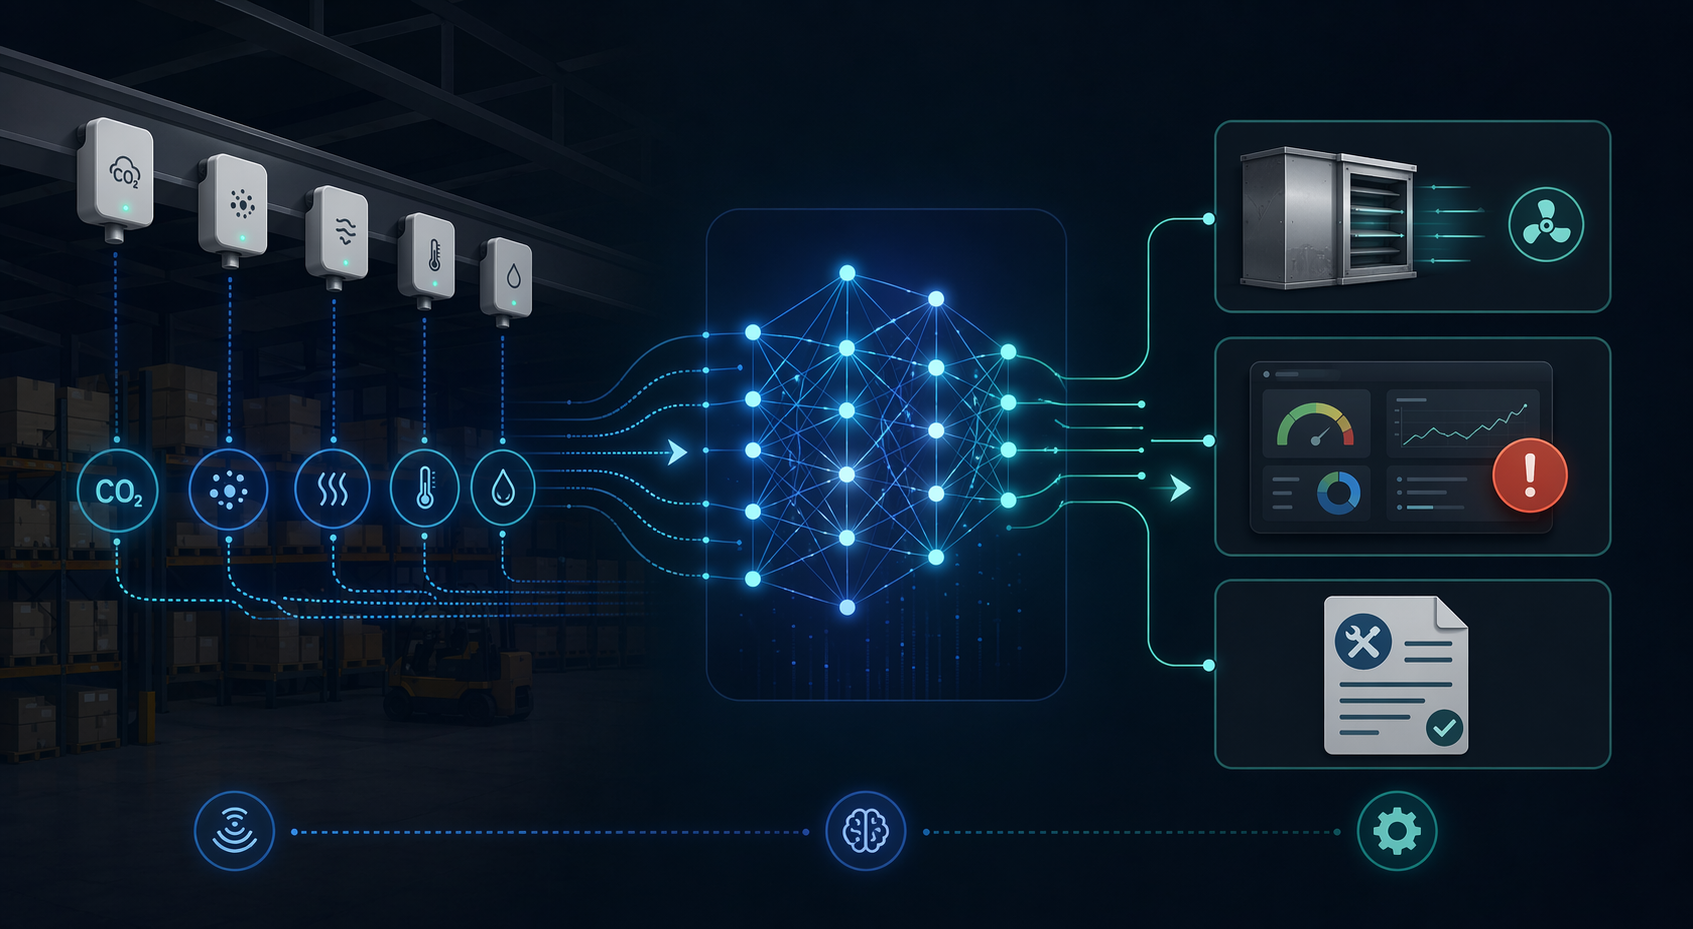
The weak link is usually not the sensor. It is the handoff. If a CO₂ alert lands in a dashboard that nobody owns, the building has a new display, not a new control process. If particulate spikes are visible but no one compares them with shift change, cleaning activity, dock cycles, or equipment movement, the data will describe the problem without reducing exposure.
The cleaner version is an operating loop with assigned responses. Facilities knows which alerts require HVAC inspection. Safety knows which patterns should trigger worker interviews or process review. Maintenance knows when a recurring anomaly becomes a preventive work order instead of another emergency call. The Envigilance data point on 73% fewer emergency maintenance calls is important for that reason: it suggests value not just from detecting unhealthy conditions, but from finding building-system trouble before it becomes urgent work.[1]
A dashboard is not enough
Warehouses already have enough systems that can be ignored. The difference with AI-enabled IAQ monitoring is whether the alerts are connected to decision rights. Someone has to decide when to adjust ventilation, when to investigate a source, when to compare readings with absence data, and when to document a corrective action for compliance purposes. Without that ownership, the system can still produce attractive trend lines while the floor keeps absorbing the same conditions.
Why the health and labor numbers matter
A 40–60% reduction in respiratory complaints is not just a safety metric. In a distribution center, it can mean fewer workers trying to finish a shift with coughing, throat irritation, headaches, or avoidable discomfort. It can also mean fewer escalations landing on supervisors and facility teams after conditions have already affected people.[1]
The reported 23% absenteeism reduction after high CO₂ levels above 1,500 ppm were identified and addressed is a different kind of signal.[1] Absence is not a pure air-quality measure; people miss work for many reasons. But in a warehouse running close to labor capacity, even a partial operational link matters. If poor ventilation contributes to fatigue, discomfort, or respiratory complaints, the cost does not stay inside the safety department. It shows up in overtime, temp labor, missed cutoffs, slower receiving, and supervisors rebuilding the plan mid-shift.
This is also where compliance enters the business case, but it should not dominate it. OSHA penalty exposure can help safety directors get attention, especially when budgets are tight. Still, the stronger argument is operational continuity: preventing avoidable exposure, reducing complaint volume, and catching ventilation or equipment issues early enough that maintenance can plan the fix.
Multi-site data turns air quality into a prioritization problem
One building can use continuous monitoring to solve local complaints. A network can use it to compare risk. That is where the 23-location ROI claim matters. Envigilance reported $340K in prevented losses against $67K in monitoring costs across 23 locations, producing ROI above 5:1.[1] The exact ratio should not be copied into another company’s budget without checking assumptions, but the structure of the value case is sound: a multi-site operator can see which facilities generate the worst patterns, which fixes hold, and which sites are drifting toward trouble.
That comparison changes the maintenance conversation. Without shared data, every building can argue that its complaints are unique. With comparable readings, leaders can separate a local process issue from a ventilation design issue, a one-time event from a recurring exposure pattern, and a comfort complaint from a measurable building condition. Capital and maintenance dollars can then move toward the sites where the evidence is strongest.
This is also where machine learning becomes more useful. A single site gives the system a baseline for that building. Multiple sites give operators a way to benchmark conditions across similar operations, climates, layouts, and processes. The analytics do not need to make dramatic predictions to be valuable. They need to show which deviations keep coming back and which buildings are consistently outside the expected range.
The conditions that make the gains believable
The published outcomes are credible only under operating conditions that many deployments fail to maintain. The first is calibration. Sensors that drift create false confidence or false alarms, and both are expensive. A warehouse team does not need a perfect laboratory instrument in every location, but it does need a calibration process that people trust, especially if readings will drive HVAC response, maintenance work, or compliance documentation.
The second condition is HVAC integration. Continuous monitoring can show that a zone is deteriorating, but the building still needs a way to respond. That may mean automated damper adjustments, revised ventilation schedules, filter checks, equipment inspection, or escalation to engineering. If IAQ data sits apart from the control system, the facility team has to bridge the gap manually every time.
- Place sensors where exposure and process variation actually occur, not only where installation is convenient.
- Define alert thresholds and response owners before the first dashboard review.
- Connect IAQ events to HVAC actions, maintenance tickets, and safety follow-up.
- Review complaint, absenteeism, and emergency maintenance trends against air-quality readings.
- Keep calibration records current enough that managers will act on the data without relitigating the measurement.
The third condition is response discipline across sites. A pilot can succeed because one facilities manager watches it closely. A network deployment has to survive turnover, peak season, weekend coverage, and budget pressure. That means the monitoring program needs documented response paths, not just enthusiastic launch meetings.
Reading ROI without fooling yourself
The 5:1 ROI figure is useful because it translates air quality into losses prevented, not just incidents counted. It also needs local math. A high-throughput distribution network with recurring complaints, emergency HVAC work, and expensive labor disruption has more room for savings than a smaller facility with stable ventilation and low complaint volume. Vendor-published ROI should start the internal model, not finish it.
A sensible business case separates direct and indirect value. Direct value includes avoided emergency maintenance, reduced complaint handling, and fewer preventable disruptions. Indirect value includes better labor availability, stronger compliance records, and faster diagnosis when a building starts behaving differently. The harder part is attribution. If absenteeism falls after ventilation fixes, air quality may be one contributor rather than the only cause. That does not make the result irrelevant; it means the claim should be stated carefully.
The most convincing internal ROI reviews will compare conditions before and after specific interventions: a ventilation adjustment after repeated CO₂ excursions, a maintenance change after particulate spikes, or a source-control action after VOC patterns appear in one area. That is more useful than a single network average because it shows which actions actually changed the building.
A bounded case for AI-driven IAQ monitoring
AI-driven air quality monitoring is one of the more practical AI use cases in warehouse operations because it does not ask managers to believe in a vague transformation story. It asks them to compare two operating modes. In one, teams wait for complaints, perform spot checks, and argue about what conditions were like between inspections. In the other, they watch exposure indicators continuously, identify recurring patterns, and connect those patterns to HVAC control, maintenance work, and site-level prioritization.
The evidence supports a bounded claim: AI-enabled IAQ monitoring can produce meaningful safety, absenteeism, maintenance, and compliance value in warehouse and distribution environments, with published deployment data showing 40–60% fewer respiratory complaints, 23% lower absenteeism after high CO₂ was addressed, 73% fewer emergency maintenance calls, and ROI above 5:1 across 23 monitored locations.[1] Those gains are most believable when the system is calibrated, tied into HVAC response, and governed as an operating process rather than installed as a passive reporting layer.
References
- Envigilance deployment data — Envigilance
Comments
Join the discussion with an anonymous comment.