
The hardest part of using AI for supply chain carbon emissions tracking is not producing a number. It is keeping that number defensible after the supplier file changes, a freight invoice arrives late, finance challenges the allocation, or an assurance reviewer asks where the activity data came from.
That is why Scope 3 has become the awkward center of supply chain sustainability work. It often represents 80–90% of a company’s total carbon footprint, yet the operating environment behind it is still thinly governed: 66% of organizations in MIT Sloan’s 2025 State of Supply Chain Sustainability research still rely on spreadsheets for Scope 3 tracking, while 70% cite lack of supplier data as a top barrier, 53% cite lack of standardized methodologies, and 52% cite calculation complexity.[1] Fiegenbaum’s 2025 review of 871 European CSRD reports found that only 9% of organizations monitor Scope 3 comprehensively.[2] Harvard Business School research in 2025 also found that 74% of S&P 500 firms revised reported emissions data, with Scope 3 the category most frequently adjusted.
AI is entering this work because the manual model is buckling. A sustainability team can ask suppliers for emissions questionnaires, export ERP spend, pull shipment records, copy factors from a database, and reconcile the result in a workbook. The problem is that every refresh reopens the same questions: which factor was used, whether the supplier response was complete, whether freight mode was inferred or known, whether a category average replaced primary data, and whether the calculation logic stayed consistent.

The useful question, then, is narrower than most platform demos make it sound. AI can make Scope 3 tracking faster, more granular, and more auditable. It cannot make missing supplier data appear, settle methodology disagreements by itself, or turn measurement into decarbonization just because a dashboard is live.
Where AI Actually Changes the Scope 3 Workflow
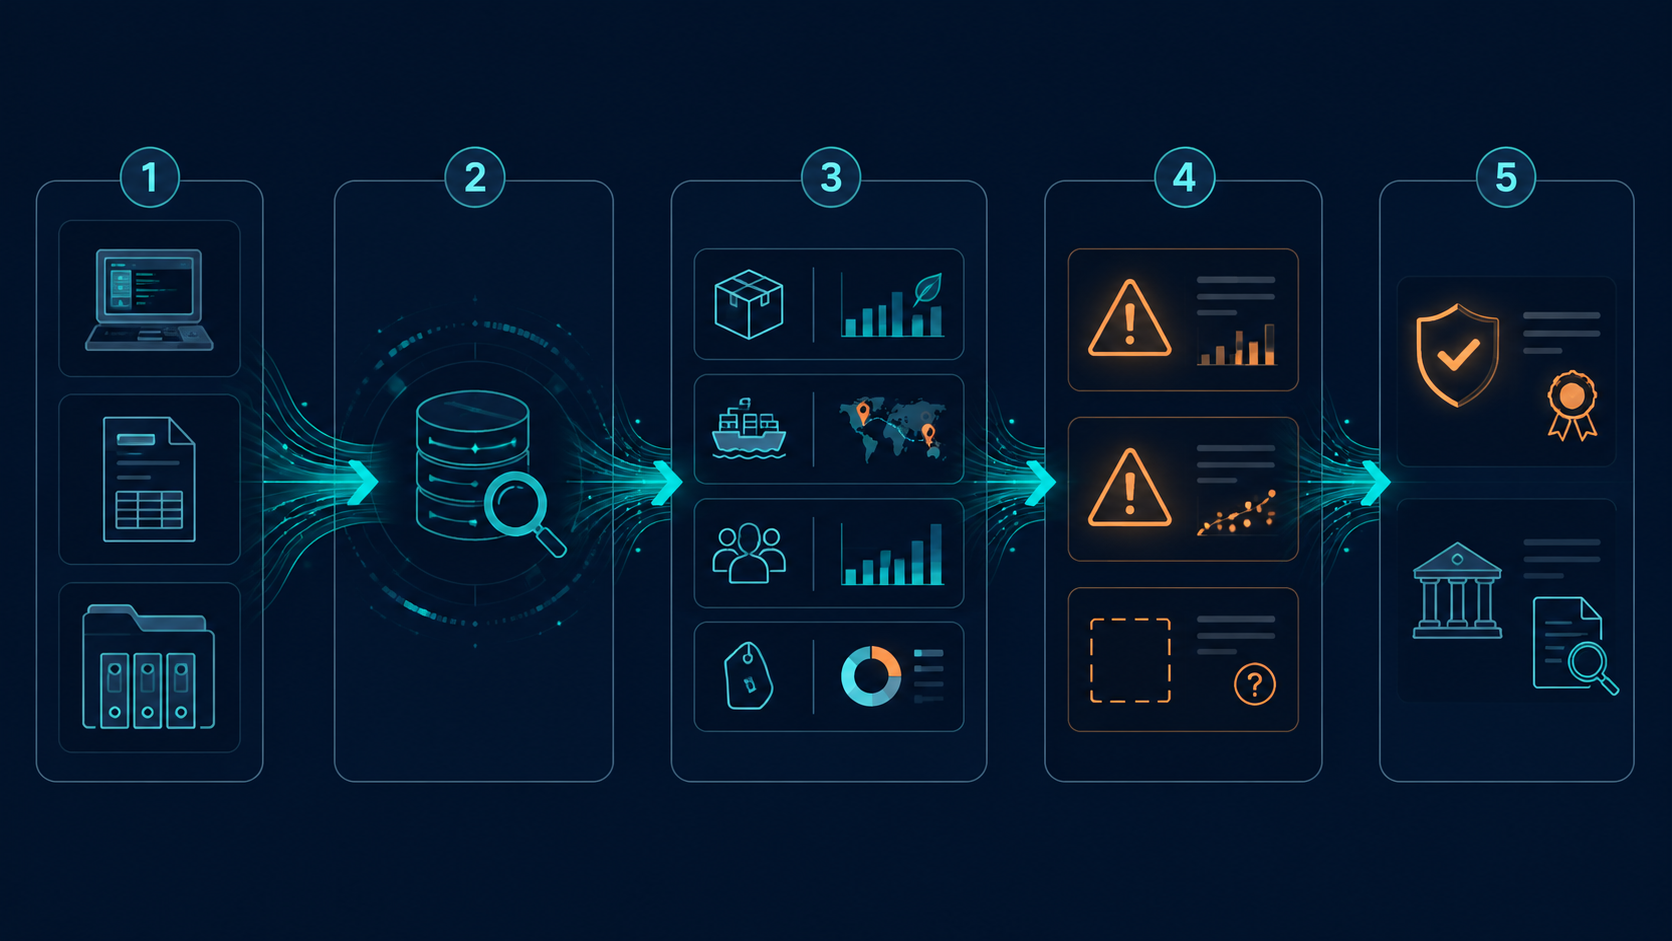
In a working Scope 3 tracking process, AI is less a single model than a calculation layer wrapped around messy operating data. The value comes from reducing the hand labor between source systems, emissions factors, calculations, exception review, and evidence storage.
| Workflow stage | What AI contributes | What still needs human governance |
|---|---|---|
| Data ingestion | Extracts activity data from ERP fields, freight invoices, procurement records, and supplier documents | Source ownership, field mapping, supplier participation, and refresh cadence |
| Emission-factor matching | Suggests factors based on product, geography, mode, fuel, supplier, material, or category signals | Methodology approval, factor hierarchy, and documentation of assumptions |
| Calculation | Applies formulas at product, lane, supplier, category, facility, or spend level | Boundary decisions, allocation rules, and version control |
| Exception handling | Flags missing values, outliers, inconsistent units, duplicate records, and stale supplier responses | Materiality thresholds and decisions about when estimates are acceptable |
| Audit trail | Preserves source links, factor versions, calculation history, and reviewer actions | Assurance preparation and sign-off accountability |
That flow matters because Scope 3 is not one data problem. Purchased goods, capital goods, upstream transportation, downstream distribution, waste, business travel, product use, and end-of-life treatment all pull from different evidence chains. A platform that can only ingest spend files may still be useful for category screening, but it will not solve freight emissions at lane level or supplier-specific product carbon work without more operational data.
Data ingestion is where spreadsheet replacement becomes credible
The first operational gain is usually not the carbon calculation itself. It is the reduction in remedial data work: copying invoice rows, normalizing supplier names, reconciling units, chasing missing shipment details, and proving which source was used.
For logistics emissions, freight audit data is a natural starting point because invoices already contain clues that carbon models need: shipment date, origin, destination, carrier, charge type, mode, weight, and sometimes fuel or service level. TraxTech describes an Emissions IQ approach that uses existing freight audit invoices and ERP data to automate logistics carbon tracking rather than requiring companies to build a separate data collection process from scratch.[4]
For purchased goods, the ingestion problem is usually less tidy. Supplier questionnaires arrive half complete. Product specifications sit in PDFs. Certificates, bills of materials, and energy statements may be scanned, emailed, or uploaded into portals with inconsistent naming. Vision-language OCR and document extraction pipelines can pull usable fields from unstructured supplier materials, as Omdena describes in its multi-agent supply chain carbon footprint work.[6] That does not make every field trustworthy, but it changes the review job from manual transcription to exception management.
The distinction is important. Automation is meaningful when it removes repeated reconciliation work and preserves provenance. If a user still has to inspect every row, rebuild formulas outside the system, and screenshot evidence for assurance, the dashboard has mostly moved the spreadsheet problem into a nicer interface.
Emission-factor matching is the technical hinge
Once activity data is usable, the next hard step is matching it to the right emissions factor. This is where AI can materially improve over manual search, especially when a procurement category, product description, freight mode, supplier location, and unit of measure all point to different levels of specificity.
Large factor libraries are part of the appeal. Net0 describes Scope 3 systems drawing from libraries with roughly 50,000 to more than 200,000 emissions factors, depending on the platform and database coverage.[5] The useful capability is not simply having a large library; it is ranking plausible matches, surfacing confidence, showing why a factor was selected, and allowing a reviewer to approve, override, or lock a factor hierarchy.
A defensible matching process usually needs a hierarchy. Primary supplier product carbon data should outrank supplier-specific activity estimates. Supplier-specific data should outrank regional industry averages. Physical activity data should usually outrank spend-based approximations when the physical data is complete enough. The platform can recommend; the company still has to decide which hierarchy applies, document it, and keep it stable enough for year-over-year comparison.
This is also where API-based calculation layers fit. Fiegenbaum cites Climatiq as an API-centric platform that processes more than 1 billion carbon calculations annually and raised a €10 million Series A in 2025.[2] For companies embedding carbon calculations into procurement, product, logistics, or ERP workflows, an API layer can be more useful than another reporting portal, because it lets emissions logic run where operational decisions are already made.
The calculation has to stay traceable
After ingestion and factor matching, the calculation layer can produce emissions views by product, shipment lane, supplier, category, business unit, facility, or customer. That granularity is where Scope 3 tracking starts becoming useful to procurement and supply chain teams rather than only sustainability reporting.
A category manager does not need one annual Scope 3 total to negotiate a lower-carbon material substitution. A logistics manager does not need a corporate average to compare lanes or carriers. Finance does not need a black-box number that changes without explanation. Each of those users needs the calculation to retain a link back to activity data, factor version, assumptions, and approvals.
That traceability becomes more important as assurance expectations rise. AI can help assemble evidence packs, maintain version history, and flag records with missing source documentation. It should not be treated as the assurance owner. Human review still has to decide whether an estimate is acceptable, whether supplier evidence is sufficient, and whether the methodology is consistent with the company’s reporting boundary.
What Production Examples Show, and What They Do Not
The case evidence is now broad enough to show that AI-enabled Scope 3 tracking is not theoretical. It is not yet broad enough to treat every vendor-published savings number as a benchmark.
Omdena reports a supply chain carbon reduction solution that delivered a 10% carbon reduction and $5 million in annual savings.[6] Carbon GPT reports a manufacturing supply chain case with a 30% reduction, equal to 360,000 tCO2e, $15 million in savings, and primary supplier data coverage rising from 10% to 85% of spend.[7] Those are useful production signals, especially because they tie emissions work to supplier data coverage and operating savings. They should still be read as vendor-published cases, not neutral averages.
In logistics, Intangles describes AI route optimization and fleet analytics that can reduce fuel wastage by up to 15%.[8] That sits adjacent to Scope 3 tracking rather than replacing it: lower fuel use can reduce emissions, but the tracking system still has to capture activity data, calculate emissions consistently, and separate measured reductions from modeled estimates.
Other named deployments and examples, including General Mills using CO2 AI, Yamato Holdings working toward a 42% reduction target, and Chartwells reporting that 96–97% of its emissions sit in Scope 3, point to the same pattern: the strongest use cases are tied to specific operating decisions, not just annual disclosure. The more closely emissions data is connected to sourcing, freight, product, or menu decisions, the more likely it is to move beyond reporting.
The Measurement-Without-Action Gap
Digital adoption is moving faster than reduction discipline. In the BCG and CO2 AI Climate Survey 2025, 89% of companies reported using or seeking digital solutions for Scope 3 tracking, but only 41% had concrete reduction targets.[3] That gap is the part procurement and sustainability teams should not gloss over.
A system can reveal that a supplier, lane, category, or material is emissions-intensive. It can rank hotspots and estimate abatement scenarios. It can make supplier-specific data visible where a spreadsheet only carried a spend-based average. None of that guarantees a sourcing change, contract requirement, mode shift, product redesign, or supplier investment.
This matters for ROI. The return does not come from knowing the carbon number more elegantly. It comes when cleaner data shortens reporting cycles, reduces audit rework, improves supplier engagement, supports lower-carbon sourcing, identifies logistics efficiency, or avoids compliance scrambling. Readers comparing this use case with other supply chain AI investments can use ChainSignal’s Supply Chain AI ROI analysis and broader AI supply chain ROI comparison to place Scope 3 tracking beside forecasting, inventory, logistics, and procurement applications.
The Limits AI Does Not Remove
The common caveat is “dirty data in, dirty data out.” In Scope 3, that phrase is too small. The issue is not only dirty data. It is absent data, reluctant suppliers, incompatible methodologies, stale product information, mismatched units, inconsistent boundaries, and a habit of treating spend-based estimates as if they were supplier-specific facts.
AI can identify missing supplier responses, detect duplicates, flag values that look inconsistent with shipment weight or procurement volume, and show where category averages are being overused. It cannot force a strategic supplier to disclose energy mix, process emissions, recycled content, or facility-level production data. It cannot make two suppliers use the same product carbon accounting method unless the buyer sets that expectation and enforces it.
Supplier engagement therefore has to sit next to the technology plan. That means deciding which suppliers need primary data first, which categories can temporarily use secondary factors, how questionnaires will be validated, how procurement will escalate non-response, and how supplier improvements will be reflected without breaking comparability.
Audit readiness has the same shape. A platform can preserve evidence and make review easier, but assurance still depends on whether the company can explain its reporting boundary, calculation methodology, factor selection, source hierarchy, controls, and changes from the prior period. As regulatory regimes move toward more demanding assurance, the gap between “we have a number” and “we can defend the number” becomes operationally expensive.
The AI energy paradox also belongs in governance, not as a reason to dismiss the use case. AI workloads can consume 7–8x more energy than traditional computing workloads, and the IEA projects data center electricity demand to double by 2030. For Scope 3 tracking, the practical question is net benefit: whether the system’s emissions and cost are justified by reduced rework, better decisions, and real abatement. Teams should ask vendors how they manage model efficiency, cloud infrastructure, calculation frequency, and reporting on their own operational footprint.
How to Judge a Scope 3 AI Tool
The vendor market is already crowded enough that a long catalog is less helpful than a clean evaluation lens. Representative platforms and providers include CO2 AI, Carbmee, Climatiq, Net0, TraxTech, Carbon GPT, CarbonBright, and Mavarick. They do not all solve the same layer of the problem. Some are stronger as calculation APIs, some as enterprise carbon accounting platforms, some as logistics data layers, and some as supplier engagement or product carbon systems.
- Data coverage: Which ERP, procurement, freight audit, supplier portal, PLM, and document sources can the tool ingest without custom work?
- Factor governance: Which emissions factor databases are supported, how are matches ranked, and can users approve or override factor selection?
- Supplier data model: Can the platform distinguish primary supplier data from secondary estimates and track supplier response quality over time?
- Audit trail: Does every calculation preserve source data, factor version, assumption, reviewer action, and methodology change?
- Decision integration: Can emissions data feed sourcing, logistics, product, and finance workflows, or does it remain isolated in sustainability reporting?
- Operating burden: After implementation, who still cleans exceptions, chases suppliers, reconciles invoices, and prepares assurance evidence?
For shortlisting, the better path is to separate vendor archetypes before comparing features. ChainSignal’s supply chain AI vendor directory is useful for that first cut. Teams already in buying mode should pair it with The 2026 AI Supply Chain Tool Buyer’s Guide and ChainSignal’s framework for evaluating AI tools for supply chain management.
Use-Case Verdict
Scope 3 carbon emissions tracking with AI is a Growing use case. It has credible production deployments, a clear operational pain point, and a practical workflow that can reduce manual data handling, improve factor matching, expose data gaps, and strengthen audit trails.
It is not Mature because the bottleneck is not only computation. The hardest work still sits upstream with supplier participation, data quality, methodology governance, and assurance discipline. The teams that get the most value will not be the ones that buy the most polished carbon dashboard. They will be the ones that use AI to make Scope 3 evidence easier to collect, easier to challenge, and easier to connect to actual sourcing and logistics decisions.
References
- Supply chain sustainability: Top ways firms track Scope 3 emissions, MIT Sloan, 2025.
- AI Real-Time Tracking Scope 3 Emissions Supply Chains, Fiegenbaum, 2025.
- Climate Survey 2025, CO2 AI, 2025.
- AI-Powered Carbon Emissions Tracking in Logistics, TraxTech.
- Scope 3, Net0.
- AI-Powered Solution to Reduce Carbon Footprint in Supply Chains, Omdena.
- Manufacturing Supply Chain, Carbon GPT.
- AI-Powered Carbon Tracking: The Key to Sustainable Logistics, Intangles.
Comments
Join the discussion with an anonymous comment.