
AI for restaurant supply chain optimization has moved past the pilot vocabulary, but the operating results are still uneven. Deloitte’s restaurant executive survey found that 55% of respondents used AI daily in inventory management, and 36% expected AI to improve procurement processes.[1] Qu’s 2025 data, by contrast, found that only 9% of limited-service brands reported meaningful AI impact, while 33% cited data fragmentation as a blocker.[2]
That gap is where the real evaluation starts. A chain can have an AI module inside its inventory platform and still have managers overriding orders because pack sizes are wrong, prep yields are stale, supplier lead times are missing, or the POS feed is late. The question is not whether AI can reduce waste or improve ordering. It is where the evidence is strong enough, the workflow is stable enough, and the data is clean enough for the recommendation to survive contact with Tuesday morning prep.
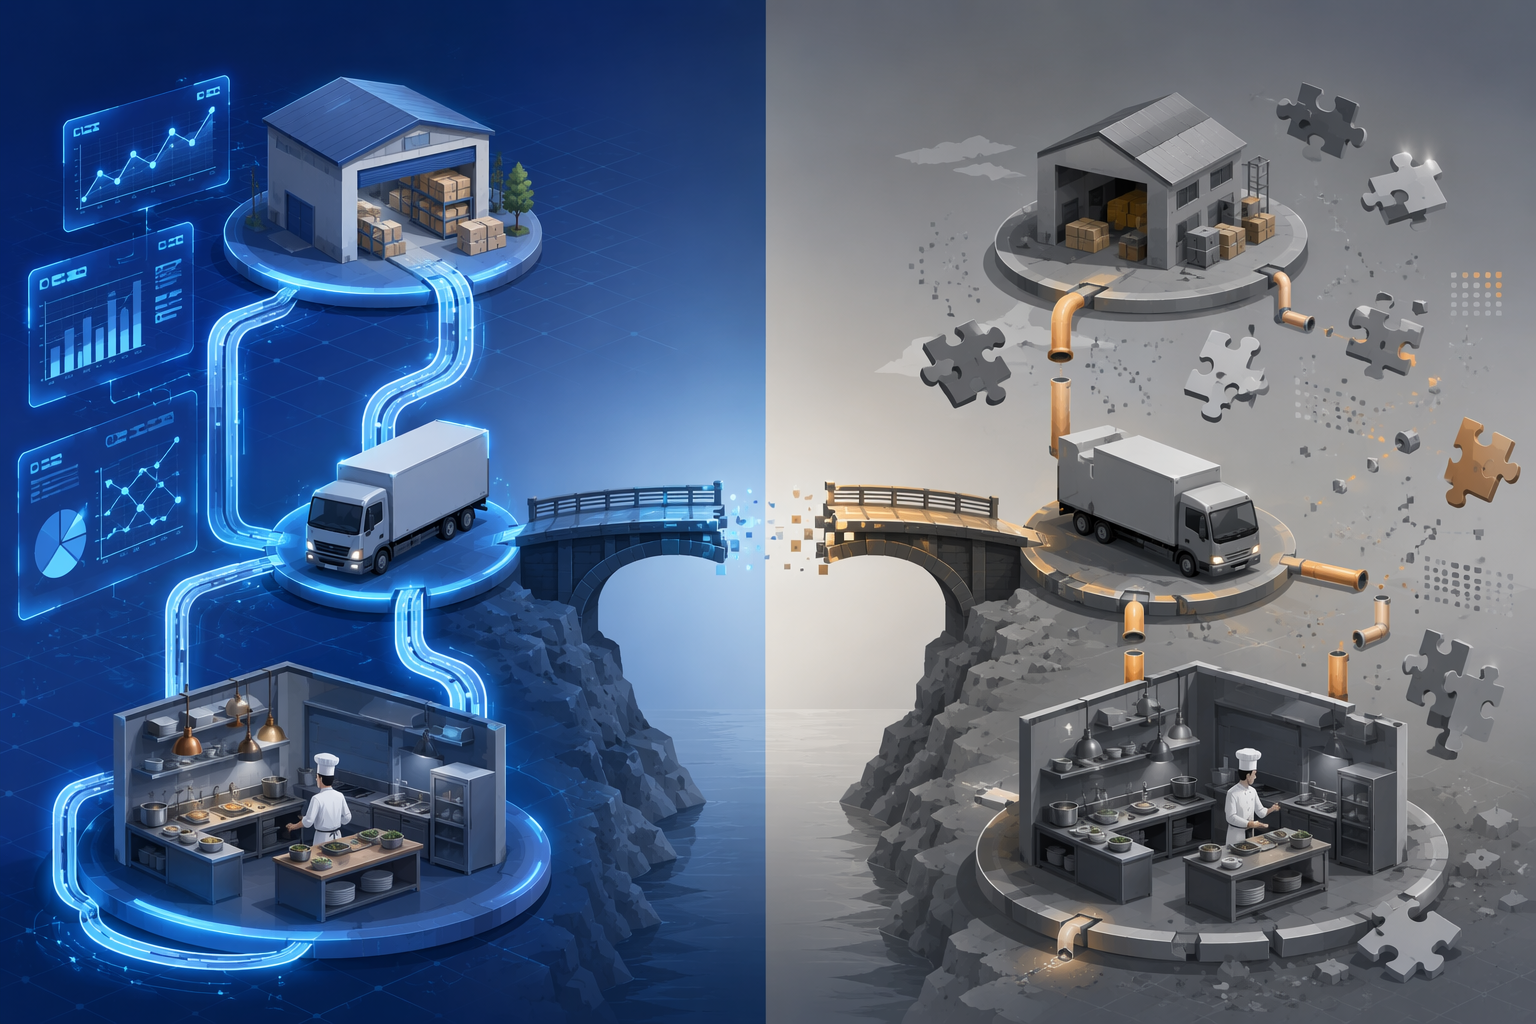
The strongest public evidence sits in demand forecasting and inventory optimization. Procurement automation is becoming easier to justify where ordering still depends on repetitive supplier calls and manual entry. Logistics and distribution matter, especially for commissaries, distributors, and franchise networks, but the restaurant-specific public evidence is thinner and should be treated as earlier-stage.
The Use-Case Map
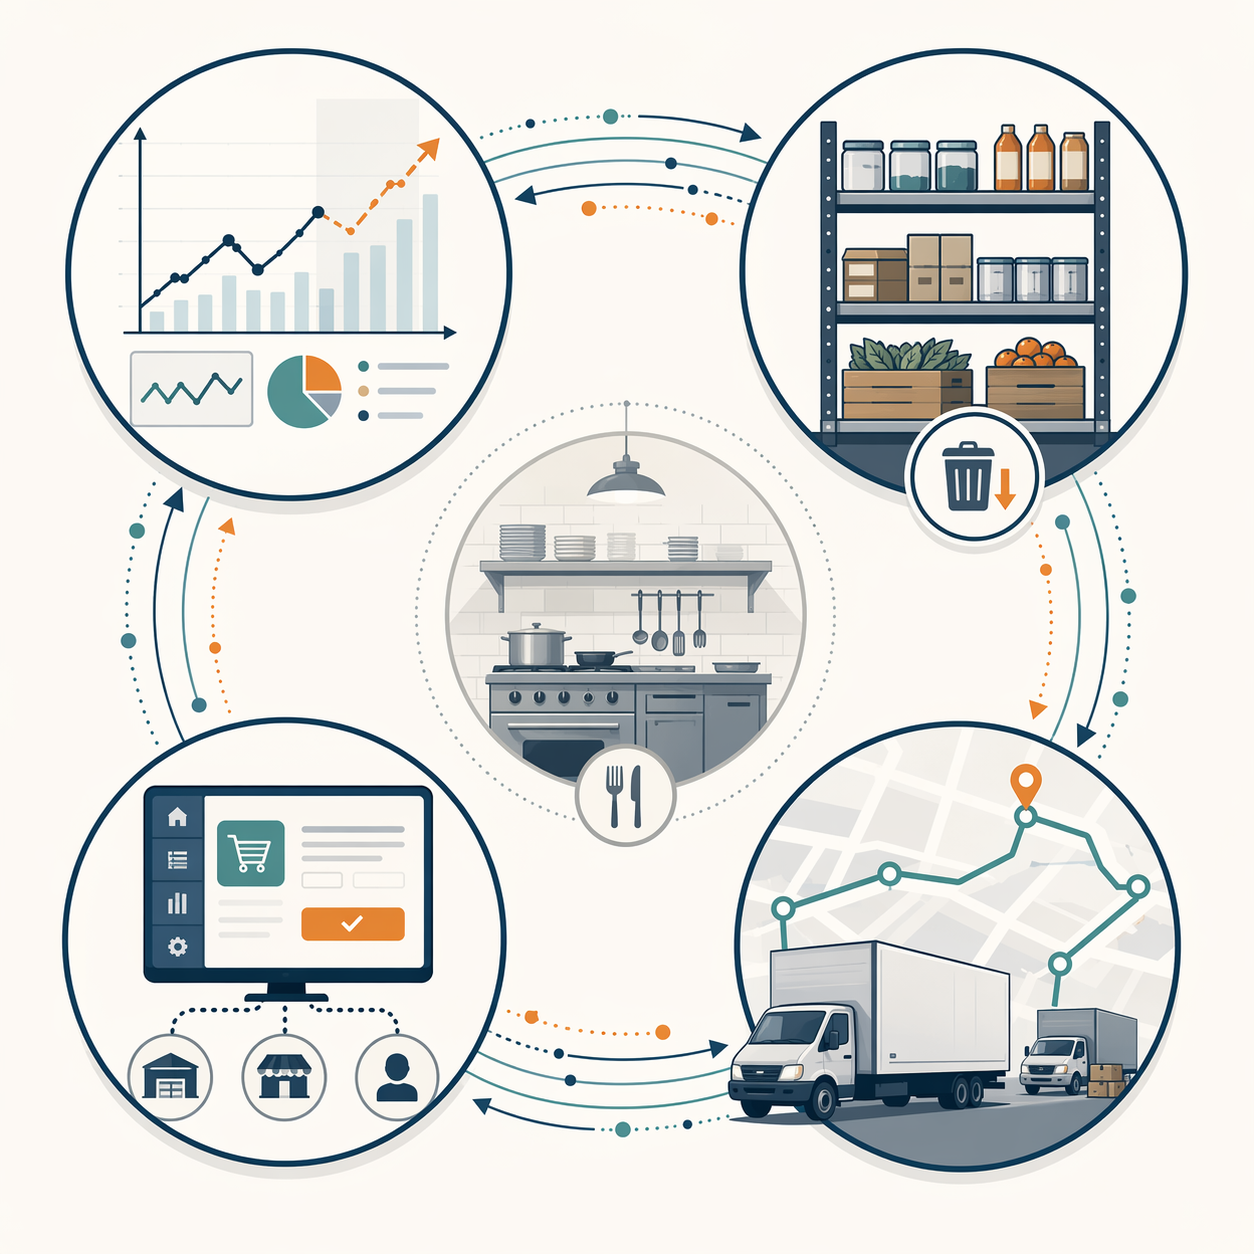
The same AI label covers very different operating problems. Forecasting asks what demand will be. Inventory optimization decides how much product should be on hand. Procurement automation reduces the human work of placing and confirming orders. Logistics and distribution decide how product moves through the network. Those distinctions matter because the evidence, risk, and payback timing are not the same.
| Function | What AI Is Doing | Documented Outcomes | 2026 Maturity | Implementation Constraint |
|---|---|---|---|---|
| Demand forecasting | Uses POS movement, time patterns, store history, and sometimes external variables to predict demand at store or interval level | Vendor and case evidence includes 15–20% forecast-accuracy improvement and customer-reported 96–98% forecast accuracy in specific settings.[3][5] | Established for POS-based forecasting; growing for multi-variable forecasting | Requires reliable POS feeds, item mapping, store calendars, promotion history, and manager trust |
| Inventory optimization | Turns forecasts into replenishment recommendations, safety stock, ordering cadence, and inventory targets | Reported outcomes include 7% inventory reduction while sustaining 90%+ service levels and 11% food cost savings in named deployments.[4][6] | Established for automated reordering; growing for perishability-aware optimization | Requires accurate on-hand counts, pack sizes, yields, lead times, substitutions, and waste capture |
| Procurement automation | Automates routine supplier ordering, order intake, confirmations, and exception handling | Deloitte found 36% of restaurant executives expected AI to improve procurement; Choco-related throughput figures are promising but should be treated cautiously because the specific comparison is secondhand.[1][8] | Growing for order-entry automation; emerging for supplier scoring | Requires supplier integration, product catalogs, approval rules, and exception workflows |
| Logistics and distribution | Optimizes replenishment timing, distribution planning, routing, and network constraints | Restaurant-specific public evidence is more limited; distributor and large-brand examples suggest value but do not yet support broad claims across chains.[6][7] | Emerging for restaurant-specific optimization; more mature in adjacent supply chain planning | Requires delivery windows, route constraints, cold-chain rules, store receiving capacity, and distributor data |
Demand Forecasting: The First Place To Look For Measurable Value
Forecasting has the cleanest starting point because restaurants already generate the main input every day: POS movement. The better systems do not just extrapolate last Tuesday. They adjust for store-level history, item velocity, daypart patterns, holidays, promotions, delivery-channel mix, local seasonality, and sometimes weather or event signals. The output matters only if it changes an operating decision: prep quantity, par level, order quantity, labor schedule, production batch, or opening routine.
Onix published a 2026 case study for “one of the world’s largest fast-food restaurant chains,” reporting a 20% improvement in demand forecast accuracy, 15% staffing optimization, and 30% infrastructure cost reduction after a Google Cloud data platform migration.[3] The chain is not explicitly named in the source, so any McDonald’s attribution should remain an inference rather than a stated fact. The case is still useful because it connects forecast improvement to data-platform work, not just to a forecasting screen.
That distinction shows up in store operations. If the model can see item-level velocity by unit and interval, it can tell a high-volume urban store something different from a suburban drive-thru, even when both carry the same menu. If it cannot see clean product mappings, closed days, stockouts, or promotion periods, it may learn the wrong pattern with impressive confidence.
Nory’s published customer examples show the type of granular outcome operators care about, though the figures are self-reported through the vendor. Badiani reported 96% daily forecast accuracy and a 3% operating cost reduction; Black Sheep Coffee reported 98% forecasting at 15-minute intervals.[5] Those are not the same metric as waste reduction or food cost savings. They show the forecasting layer can become precise enough to influence labor, production, and replenishment decisions when the chain’s transaction data and store routines support it.
Business Insider’s July 2025 reporting on Juici Patties offers a useful example because the AI finding was not a generic “sell more” recommendation. The chain, which had more than 70 locations, found that some stores were opening later than actual customer demand justified; after adjusting opening times, the company saw a “consistent increase in daily sales,” according to the report.[7] That is forecasting value turning into an operating change, not a dashboard metric looking for a home.
Where Forecasting Breaks
The failure mode is usually not that the algorithm cannot calculate a pattern. It is that the pattern it calculates does not match store reality. Menu items get renamed without clean historical mapping. Limited-time offers distort baseline demand. A stockout records as low demand. Weather matters for one concept and barely moves another. Franchisees place manual orders outside the system. A forecast can look accurate in aggregate while still missing the item that ruins service on the line.
For 2026 investment decisions, POS-based forecasting belongs in the established tier. Multi-variable forecasting is growing: it can add value, but it needs disciplined master data and enough historical observations to separate signal from noise. A chain with inconsistent item hierarchies should fix that before expecting a forecast engine to explain why mozzarella waste rose in one region and chicken shortages hit another.
Inventory Optimization: Where Forecasts Become Cash, Waste, Or Stockouts
Inventory optimization is where AI either earns its place or gets quietly ignored. A forecast says expected demand. Inventory optimization translates that forecast into order quantities, reorder points, safety stock, shelf-life exposure, and service-level tradeoffs. The operator does not experience it as “AI.” They experience it as fewer emergency transfers, fewer spoiled cases in the walk-in, fewer line checks that end in a text to the district manager, and fewer end-of-period explanations to finance.
Deloitte’s 55% daily-use figure for inventory management gives this function broad adoption credibility.[1] It does not prove effectiveness by itself. Daily use can mean a system is embedded in ordering routines; it can also mean a team opens the tool every morning and still overrides half the recommendations. The stronger evidence comes from cases that tie inventory changes to service levels, food cost, or waste.
ToolsGroup’s case involving Suministros & Alimentos, a distributor serving McDonald’s across Central America, reported a 7% inventory reduction while sustaining service levels above 90%.[6] That combination matters. Inventory savings without a service-level guardrail can simply mean the network got leaner and stores absorbed the pain. A result that pairs lower inventory with maintained service gives supply chain leaders a more useful benchmark.
Loman’s FranGlobal deployment is more aggressive on restaurant-facing economics. The vendor reported a 35% waste reduction, 11% food cost savings, and a projected $1.98 million per year from an 8-month pilot across more than 300 locations.[4] Those figures are vendor-published and not independently audited in the available material, so they should not be copied directly into a board deck as expected ROI. They are still directionally useful because they show the outcome stack that matters: waste, food cost, and scaled annual value.
Nory’s CUPP example reported a 60% waste reduction, again through vendor-published customer material.[5] PreciTaste has also circulated a 50% waste reduction claim, cited through Checkmate’s coverage of AI supply chain optimization.[9] Read together with Loman’s 35% figure, these examples support the idea that double-digit waste reduction is plausible in specific operating contexts. They do not support a blanket claim that every chain can remove half its waste with software.
The Inventory Data That Decides Whether The Model Is Believable
The hard part is not only demand. It is the messy conversion from what stores sell to what they buy and use. A burger chain sells finished items but orders buns, patties, cheese, produce, packaging, sauces, and fryer oil. A coffee chain sells beverages but consumes milk, syrups, cups, lids, toppings, espresso, and cleaning supplies. AI cannot optimize what the chain cannot translate.
- Recipe and bill-of-material accuracy: item sales must convert into ingredient demand.
- Pack size and unit-of-measure discipline: the system must know the difference between each, case, sleeve, pound, and portion.
- Shelf-life and yield assumptions: perishability, trim loss, thaw rules, and prep batches change the true inventory risk.
- Supplier lead times and delivery calendars: a perfect order suggestion is useless if it misses the route day.
- Waste and transfer capture: stores need a consistent way to record what was discarded, comped, donated, transferred, or counted out.
This is why automated reordering is more mature than dynamic shelf-life prediction. Reordering can work from forecast, par, lead time, and current stock. Dynamic shelf-life prediction needs more granular signals about product age, temperature handling, prep timing, storage conditions, and actual discard behavior. It is promising, but it is not equally ready across restaurant formats.
Procurement Automation: Less Time On Routine Orders, More Attention On Exceptions
Procurement automation has a narrower but real value case. In many restaurant networks, especially those working with regional suppliers or fragmented distributors, people still spend time turning emails, calls, voicemails, portal entries, and standing orders into purchase records. AI can reduce the repetitive handling: extract order intent, match items to catalogs, check minimums, flag substitutions, confirm quantities, and route exceptions to a buyer or store manager.
Deloitte’s finding that 36% of restaurant executives expected AI to improve procurement suggests operators already see the use case.[1] That expectation should be separated from proven savings. Procurement automation can improve speed and accuracy before it materially lowers cost of goods. The first measurable benefit may be fewer touches per order, fewer missed confirmations, faster supplier response, or cleaner purchase-order data.
Choco’s enterprise food supply chain material around VoiceAgent points to this direction, but the most eye-catching throughput comparison needs careful attribution. The figures that describe 1,200 orders per hour versus 12 manually, and a reduction from 5 minutes to 5 seconds per order, appear in secondary coverage rather than Choco’s primary Gulfood material available in the research set.[8] Those numbers are useful as a signal of what order-intake automation is trying to solve, not as independently verified restaurant-chain economics.
The more mature procurement applications are order entry, catalog matching, and confirmation workflows. Supplier scoring is emerging. It can become valuable when a chain has enough clean history on fill rates, substitutions, late deliveries, quality issues, credit activity, and price variance. Without that history, supplier scoring risks becoming a polished way to rank incomplete anecdotes.
Logistics And Distribution: Important, But Less Proven In Public Restaurant Evidence
Logistics and distribution are obvious candidates for AI: route planning, delivery timing, inventory positioning, cold-chain monitoring, dock scheduling, store receiving windows, commissary production, and exception recovery all have data-heavy decisions. The caution is that public restaurant-specific evidence is not as deep as it is for forecasting and inventory.
ToolsGroup’s Suministros & Alimentos case is relevant because it sits between restaurant demand and distribution planning, with the reported 7% inventory reduction and 90%+ service levels tied to a distributor serving McDonald’s across Central America.[6] Business Insider also reported that major fast-food companies, including McDonald’s, Taco Bell, and Yum Brands, have been using AI in supply chain efficiency efforts, but the public article is broader than a controlled logistics-outcome study.[7]
For a restaurant chain, logistics AI becomes believable when it accounts for the constraints operators actually live with: delivery windows that avoid lunch rush, freezer and cooler capacity, truck temperature zones, case cube, route-day minimums, emergency replenishment rules, commissary batch timing, and franchisee receiving discipline. A route that is mathematically efficient but arrives during a store’s peak order period is not optimized in any useful sense.
This area belongs in the emerging tier for restaurant-specific evaluation. It may be quite mature inside large distributors, third-party logistics networks, or enterprise planning systems, but a multi-location restaurant operator should ask for evidence that maps to its own distribution structure: direct-store delivery, commissary replenishment, broadline distribution, franchise-owned inventory, or a hybrid model.
How To Judge The Evidence Before Funding A Rollout
The published outcome range is attractive. Across the available restaurant and adjacent food-service cases, waste reduction claims run from 10–60% in specific contexts, inventory savings include 7–11%, and forecast-accuracy improvement reaches 15–20% in reported deployments.[3][4][5][6][9] The range is not a forecast. It is a menu of observed or claimed outcomes from different functions, vendors, chain sizes, data conditions, and source types.
| Evidence Type | How Much Weight To Give It | What To Ask Before Using It Internally |
|---|---|---|
| Independent survey | High for adoption and sentiment; limited for direct ROI | What was the sample, geography, date, and respondent profile? |
| Named customer case study | Useful for operating examples; stronger when metrics and baseline are clear | Was the result audited, and what changed besides the software? |
| Vendor-published metric | Useful as a directional benchmark; not enough for board-ready ROI by itself | What is the denominator, time window, and control period? |
| Analyst-cited or distributor case | Strong when service levels and inventory outcomes are reported together | Does the network resemble our own stores, suppliers, and distribution model? |
| Secondhand throughput claim | Interesting for process potential; weak for financial modeling | Can the primary source confirm the metric and operating context? |
A practical AI business case should therefore benchmark by use case, not by vendor promise. Forecast accuracy can be tested against historical POS and actual sales. Inventory optimization can be piloted against waste, stockout rate, inventory value, food cost, service level, and manager override rate. Procurement automation can be measured by touches per order, cycle time, order-entry errors, and exception volume. Logistics can be measured by on-time delivery, route cost, fill rate, emergency drops, and receiving disruption.
The override rate deserves more attention than it usually gets. If store managers override 60% of recommendations, the chain has either a trust problem, a data problem, a workflow problem, or a model problem. The answer changes the fix. Training will not solve bad pack-size data. Better data will not solve a recommendation that arrives after the order cutoff.
The Readiness Questions That Separate A Pilot From An Operating Result
Qu’s finding that only 9% of limited-service brands reported meaningful AI impact, while 33% cited data fragmentation, explains why adoption and results do not move together.[2] Fragmentation is not an abstract IT complaint. It means the POS, inventory platform, supplier catalog, accounting system, labor scheduler, menu database, distributor feed, and franchise reporting layer disagree often enough that the model cannot confidently close the loop.
Before investing, a restaurant supply chain team should be able to answer a few unglamorous questions.
- Can item-level POS history be mapped cleanly to ingredients, pack sizes, and supplier SKUs?
- Are stockouts, waste, transfers, substitutions, and manual orders captured consistently across stores?
- Does the system know delivery calendars, order cutoffs, lead times, and receiving constraints by location?
- Who reviews recommendations, who can override them, and how are overrides analyzed?
- Will success be measured against service levels as well as inventory reduction or waste reduction?
Chains that need a broader supply chain AI ROI benchmark can compare these restaurant-specific use cases with ChainSignal’s cross-functional supply chain AI ROI reference. Teams still working through master data, system integration, or inventory visibility should start with the data-readiness guide for AI inventory optimization before treating a vendor case metric as their own expected result.
AI is credible enough for multi-location restaurant chains to evaluate now, especially in forecasting and inventory optimization. The investment case gets weaker when the metric is detached from source quality, workflow adoption, and data readiness. The chains most likely to see value are not the ones that buy the most ambitious model first; they are the ones that can connect the recommendation to ordering behavior, service levels, waste capture, and the person who has to explain why product was thrown away.
References
- How AI Is Revolutionizing Restaurants, Deloitte Consumer Industry Center, 2025
- AI for Restaurants ROI 2026, Restaurant365
- Onix Powers Real-Time AI-Driven Decision-Making for One of the World’s Largest Fast-Food Restaurant Chains, Onix, 2026
- AI Transforms Restaurant Supply Chains in 2024, Loman
- What Is AI Inventory Management?, Nory
- Optimize Food Supply Chain with AI-Driven Planning, ToolsGroup
- Fast-Food Chains Are Using AI to Make Their Supply Chains More Efficient, Business Insider, July 2025
- AI in the Enterprise Food Supply Chain, Choco
- Benefits of AI Supply Chain Optimization for Restaurants, Checkmate
Comments
Join the discussion with an anonymous comment.