
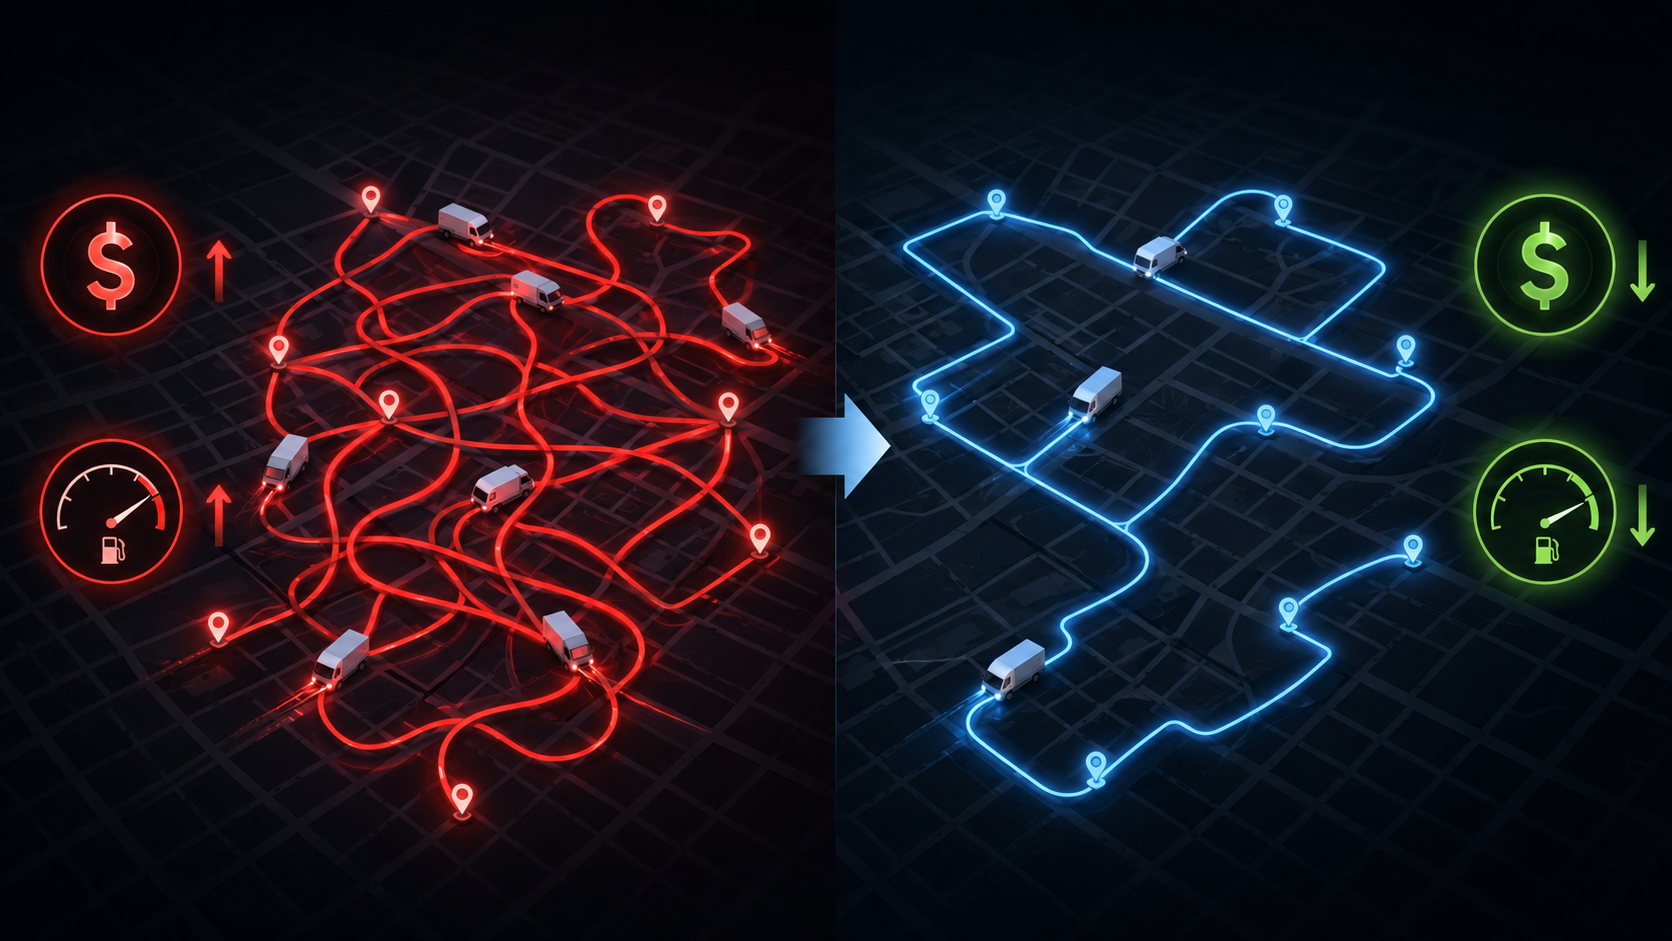
AI for last-mile delivery route optimization earns attention because the last mile is where delivery budgets leak in plain sight. Last-mile delivery accounts for roughly 41–53% of total shipping costs, and the average cost per delivery is about $10.10 against roughly $8.08 charged to the customer or recipient.[1][2] That gap is not an abstract efficiency problem. It shows up as overtime after a late dispatch, fuel burned on avoidable miles, failed stops that come back tomorrow, customer-service escalations, and managers explaining why the plan looked good at 5:45 a.m. but collapsed by lunch.
The strongest business case for AI route optimization starts there, not with the algorithm. If a delivery operation cannot show where cost is concentrated and which service failures create rework, it is hard to defend any ROI number. If it can, the benchmark range is compelling: several current advisory and vendor sources report 15–30% cost reductions, 20% fuel savings, 25% faster deliveries, and measurable payback within 3–6 months when deployments are aimed at high-impact use cases.[2][3][4] Those figures are useful enough for an approval memo, but they should be treated as benchmarks to test against, not savings to paste into a budget line.
What the ROI Evidence Actually Supports
The evidence for AI route optimization is stronger than many supply chain AI claims because the operating metrics are visible. Miles, stops per route, fuel, on-time delivery, failed delivery, driver hours, and reattempts are already measured in most delivery organizations, even if they sit in too many systems. That makes route optimization a better candidate for financial validation than AI use cases where benefits are softer or attribution is harder.
The caveat is that the evidence is layered, not uniform. A board-ready case should not treat every number as equal. UPS ORION is the large-scale proof point. The Shanghai urban testbed is a controlled performance result. HelloFresh, Crisp, DHL/Wise Systems, and UniUni/Shein are named operating examples with different delivery shapes. The repeated 15–30% cost-reduction range is directionally useful, but some of the same numbers appear across vendor and advisory materials, so independent confirmation is not always as clean as the citation count suggests.
| Evidence type | What it shows | How to use it in a business case |
|---|---|---|
| Enterprise-scale benchmark | UPS ORION reported $300–400 million in annual savings, 100 million miles avoided, and 10 million gallons of fuel saved. | Use as proof that routing discipline can matter at very large scale, while dating the data and avoiding direct extrapolation. |
| Controlled urban study | The Shanghai testbed reported major movement in on-time delivery, cost, and congestion exposure. | Use for dense urban dynamic routing scenarios, not as a universal last-mile benchmark. |
| Named-company outcomes | HelloFresh, Crisp, DHL/Wise Systems, and UniUni/Shein show different operational benefits. | Use as pattern evidence by operating model, not as one-to-one ROI guarantees. |
| Compiled ROI ranges | Multiple sources report 15–30% cost reduction and 3–6 month payback. | Use as a planning range, then validate against internal baseline and pilot data. |
UPS ORION Is Still Useful, But It Is Not a Shortcut
UPS ORION remains the benchmark people reach for because the numbers are large enough to survive executive scrutiny. The INFORMS case reported annual savings of $300–400 million, 100 million miles avoided, and 10 million gallons of fuel saved from the routing system.[5] At that scale, a small improvement per route becomes a material operating result.
It is also an older benchmark. The INFORMS data cited in the research brief comes from 2015–2016, and it reflects an unusually large, mature delivery network.[5] That does not make it irrelevant. It makes it a proof of what disciplined route optimization can become when embedded into daily operations, driver workflows, and network planning. It should not be used to imply that a regional fleet, grocery delivery network, parcel startup, or B2B distributor will see the same savings profile.
The operating lesson is more valuable than the headline dollar amount. UPS did not save hundreds of millions because a model produced elegant routes in isolation. The savings depended on applying routing logic across a large network where miles, service commitments, driver practices, and dispatch execution could be repeatedly measured. For a smaller organization, the comparable question is not “Can we copy UPS?” It is “Where do we have enough route density, recurring waste, and execution control for optimization to change actual cost?”
The Shanghai Testbed Shows What Dynamic Routing Can Move
The Shanghai urban testbed is useful because it reports specific operational changes under controlled conditions. In the 2025 study cited in the research brief, dynamic AI routing improved on-time delivery from 68.1% to 92.8%, reduced total operational cost by 24.3%, and cut congestion exposure by 54.4%.[6][7] Those are not vague productivity claims. They connect routing decisions to service reliability, cost, and exposure to traffic conditions.
The boundary matters. This is evidence for dense urban dynamic routing, especially where congestion and changing conditions can make a static morning plan obsolete. It is not automatically evidence for rural routes, low-density suburban delivery, specialized cold-chain constraints, multi-depot networks, or operations where driver availability and customer time windows are the real limiting factors.
For a business case, the Shanghai result belongs beside the use case, not above it. If the first pilot targets a congested metro area where routes are rebuilt during the day and late deliveries trigger reattempts, the study is relevant. If the first pilot targets predictable industrial routes with stable appointment windows, it is less persuasive.
Named Outcomes Help When They Match Your Operating Shape
The supporting company examples are most useful when they are sorted by the kind of operating problem they represent. HelloFresh achieved a 16% transport cost reduction, while Crisp reported a 23% driving-distance reduction and a 13% overall cost reduction.[2] Those figures point to savings from better stop sequencing, route density, and distance reduction, but they do not prove that every food, grocery, or recurring delivery network will land in the same range.
DHL’s work with Wise Systems shows a different shape: operational speed and planning capacity. The cited materials describe 120-stop routes sequenced in seconds and 90–95% volume forecasting accuracy.[3][8] That matters in operations where dispatch planning time is itself a bottleneck, or where late-arriving order volume forces planners to choose between speed and route quality.
UniUni and Shein sit in another category. The cited example reports delivery shortened from 10–14 days to 4–5 days.[7] That is a service-speed result, not a pure cost result. It may support a business case where faster delivery improves customer promise, capacity utilization, or competitive position, but it should not be converted into a cost-saving percentage without internal financial data.
This is where many ROI decks get sloppy. A company with a reattempt problem borrows a distance-reduction case. A fleet with driver shortage issues borrows a fuel-savings benchmark. A same-day delivery team borrows an enterprise parcel example. The better move is to match the case evidence to the operating shape: high mileage, late dispatch, high failed delivery, poor route density, volatile order intake, or congested urban execution.
The Market Is Growing, But Market Size Does Not Prove ROI
The market context explains why vendors and investors are crowding into the category. The AI-enabled last-mile delivery market was estimated at $1.56 billion in 2025 and projected to reach $1.80 billion in 2026, a 15.4% CAGR.[9] The broader last-mile delivery market is estimated at about $207 billion.[10]
Those numbers are useful for orientation, not justification. A large market does not mean a specific deployment will pay back. The ROI case has to come from cost leakage inside the delivery operation: excess miles, failed stops, avoidable overtime, poor vehicle utilization, customer-service load, and dispatch effort.
Build the Business Case From Cost Leakage, Not Software Features
A credible business case for last mile delivery route optimization AI should move from baseline to pilot evidence. The path is simple, but the work is not always easy because the required data often lives across order management, transportation management, telematics, proof-of-delivery tools, customer-service records, spreadsheets, and driver apps.
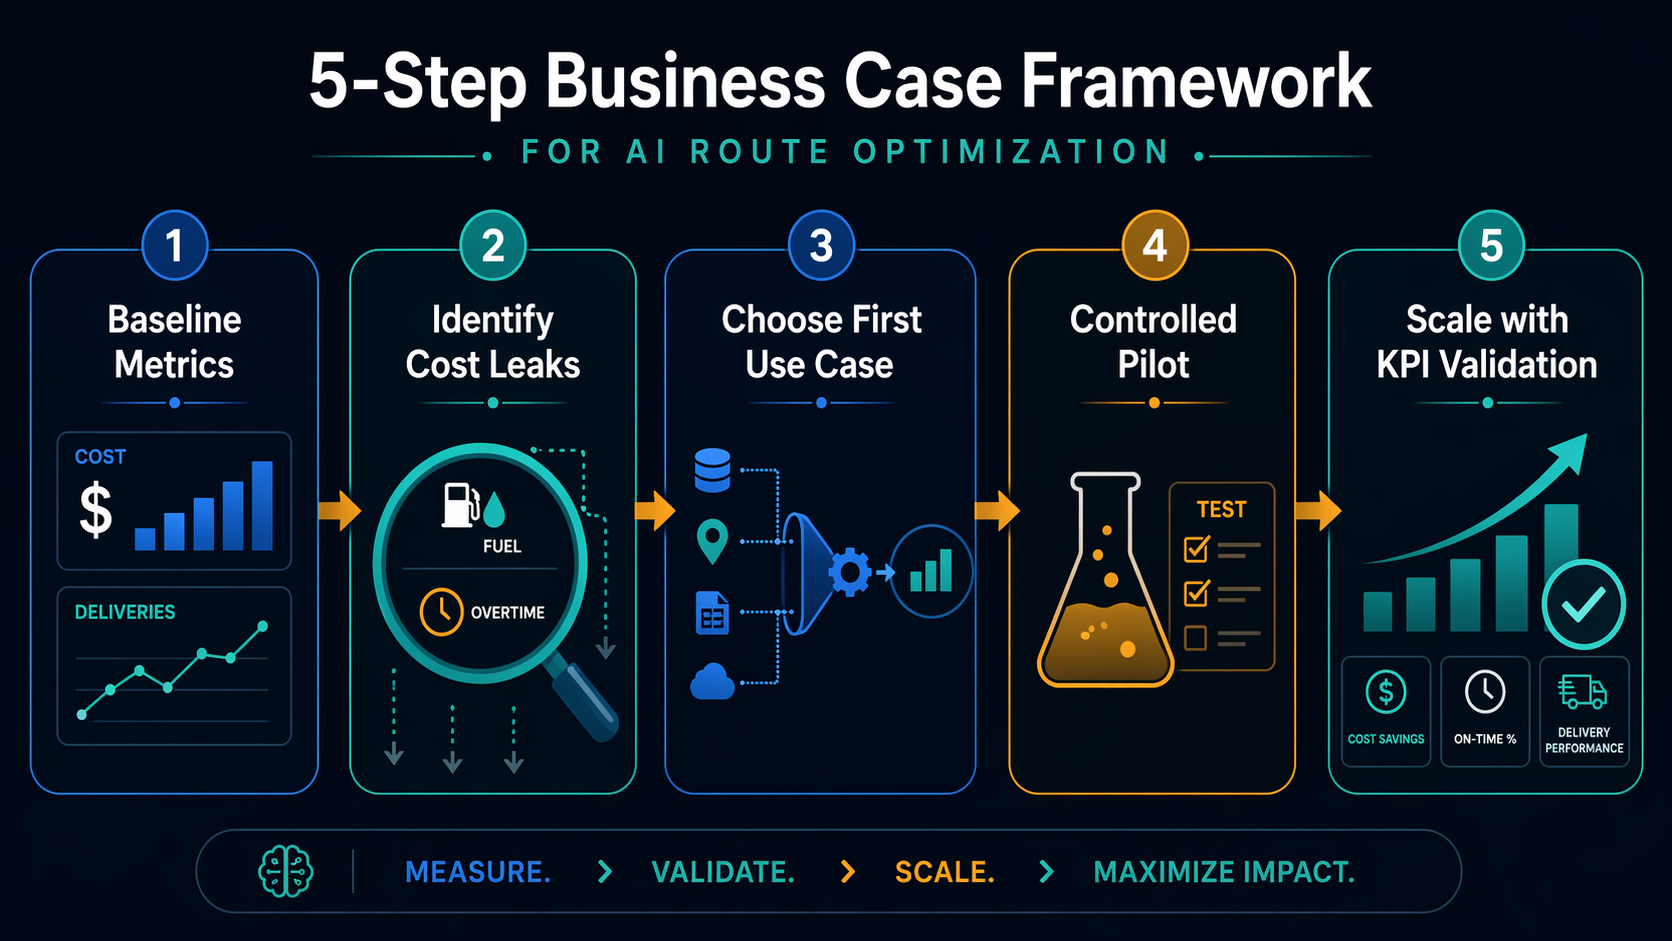
| Step | Decision to make | Evidence needed before budget approval |
|---|---|---|
| Baseline metrics | Define the current cost and service position. | Cost per delivery, miles per stop, fuel, driver hours, overtime, on-time rate, failed delivery, reattempts, dispatch planning time. |
| Identify cost leaks | Find the waste that routing can actually influence. | The cost of late route changes, poor sequencing, low vehicle utilization, failed stops, excess miles, and avoidable manual planning. |
| Choose the first use case | Start where impact is measurable and data is clean enough. | A route group, region, customer segment, or delivery mode with stable inputs and visible cost leakage. |
| Run a controlled pilot | Compare AI-assisted routing against the current planning method. | Predefined KPIs, a clean control period or comparison group, and agreement on how exceptions will be counted. |
| Scale with KPI validation | Expand only after the pilot shows operational and financial movement. | Validated savings, service impact, dispatcher adoption, driver feedback, integration readiness, and exception-handling process. |
Start With the Baseline the CFO Will Challenge
The baseline should include both direct and operationally adjacent costs. Direct costs include fuel, driver time, contractor payments, vehicle utilization, and overtime. Adjacent costs include failed delivery, reattempts, customer-service contacts, credits, dispatch planning time, and supervisor intervention. If those are excluded, the business case may understate the real leakage; if they are estimated without discipline, finance will discount the whole model.
The baseline also needs service metrics because route optimization can shift cost and service at the same time. A lower-cost plan that misses appointment windows is not a saving. A faster plan that depends on unpaid driver waiting time is not a clean productivity gain. A route plan that looks efficient before proof-of-delivery data arrives may be hiding failed stops that return to the network tomorrow.
Separate Addressable Waste From General Delivery Cost
Not every last-mile cost is addressable by route optimization. Rent, some fixed fleet costs, customer promise design, product handling constraints, and regional labor rates may sit outside the routing decision. The business case should isolate the portion AI can plausibly influence: miles, route sequencing, stop clustering, dispatch time, dynamic rerouting, vehicle assignment, time-window feasibility, and exception response.
This is where the 15–30% benchmark becomes more useful. It should be applied to the addressable cost pool, not automatically to total logistics cost or total shipping cost. If the addressable pool is narrow, the project may still be worthwhile, but the dollar impact will be smaller than a headline percentage suggests.
Pick the First Use Case Where the Data Can Hold the Weight
The first use case should not be the most politically visible route group if its data is a mess. It should be the place where the operating pain is real, the baseline is measurable, and the data needed for routing is reliable enough to run the plan repeatedly. That usually means clean addresses, accurate order cutoffs, usable delivery windows, current vehicle constraints, driver availability, service-time assumptions, and proof-of-delivery feedback.
Data readiness does not eliminate implementation risk. Dispatchers still need to trust the plan, drivers still need a workable sequence, customer service still needs visibility when exceptions occur, and managers still need to know when to override the system. But if the data layer is weak, the implementation conversation never gets a fair test. The tool spends its first month explaining bad inputs instead of improving routes.
Run a Pilot That Can Survive Skepticism
A controlled pilot should define its comparison before the first route is optimized. The cleanest version compares a selected region, fleet group, or delivery mode against its own historical baseline and, where possible, against a similar group still using the current planning process. The pilot should also define how it treats demand changes, weather, seasonality, driver absences, order cutoff changes, and customer-requested exceptions.
The KPI list should be short enough to govern decisions. Cost per delivery, miles per successful stop, on-time delivery, failed delivery, reattempt rate, driver hours, overtime, fuel, dispatch planning time, and customer-service escalations are usually enough. Adding more metrics can make the dashboard look mature while making the decision less clear.
The payback expectation should also be stated carefully. Current sources report 3–6 month measurable payback for organizations deploying against high-impact use cases.[3][4] That window is plausible when the integration is narrow, the use case is well chosen, and the cost leak is already visible. It is less plausible if the project requires broad system replacement, major master-data cleanup, union or contractor workflow changes, or a full network redesign before routes improve.
Scale Only After the Operating Behavior Changes
A successful pilot is not just a better route plan on a screen. It changes the morning dispatch routine, the way late orders are handled, the way driver constraints are captured, the way customer service sees delivery risk, and the way managers review exceptions. If dispatchers rebuild the AI plan every day before release, the project has not yet delivered operating discipline, even if the software demo looks strong.
Scaling should therefore depend on KPI validation and workflow stability. Before adding regions, vehicles, or delivery categories, confirm that the pilot moved the agreed metrics, that users can explain when and why they override the system, and that proof-of-delivery data flows back into route planning. The savings range becomes more believable when the process closes the loop.
How to Use the 15–30% Range Without Overpromising
The 15–30% cost-reduction range is best used as a benchmark band with a caveat attached. The caveat should say what cost base the percentage applies to, which use case is in scope, which data inputs are ready, and which benefits are excluded until proven. A finance team can work with that. A single blended savings percentage across all delivery operations invites a harder challenge.
A practical approval memo might frame three cases. The conservative case applies savings only to excess miles, dispatch time, and reattempts in the pilot region. The expected case applies the benchmark range to the agreed addressable delivery-cost pool after pilot validation. The upside case includes broader rollout, higher route density, and service-related benefits only after internal evidence supports them. The point is not to make the spreadsheet timid; it is to keep the assumptions visible.
The same discipline applies to fuel and delivery-speed claims. A 20% fuel-saving benchmark is relevant when avoidable miles and poor sequencing drive fuel use.[2] A 25% faster-delivery benchmark is relevant when route order, congestion, and dispatch timing affect cycle time.[2] Neither should be used as a universal improvement factor across routes where the binding constraint is customer availability, loading capacity, or fixed appointment windows.
Where the ROI Is Most Believable
AI route optimization has the strongest ROI case when four conditions line up: a large addressable delivery-cost base, repeated routing decisions, visible service failures, and data clean enough to support daily planning. Dense urban delivery with congestion exposure, multi-stop parcel or grocery routes, recurring B2B distribution, and fleets with high manual dispatch effort often fit that profile.
The case is weaker when delivery volume is low, routes are already stable and manually optimized, addresses are unreliable, proof-of-delivery data is delayed, customer time windows are constantly overridden, or the operation cannot act on route recommendations. In those environments, the first investment may still be routing-related, but it may look more like data cleanup, process redesign, or dispatch visibility before full AI optimization.
That distinction matters because it keeps the project from becoming a technology purchase in search of a savings story. The best first use case is usually not the most complex one. It is the one where a better plan can be executed, measured, and repeated without heroic intervention every morning.
A Calibrated ROI Judgment
AI last-mile route optimization is one of the stronger ROI cases in supply chain AI because the cost base is large, the metrics are observable, and the evidence includes enterprise-scale results, controlled-study results, and named-company outcomes. The UPS ORION benchmark shows the size of the prize at scale.[5] The Shanghai testbed shows what dynamic routing can move in a dense urban setting.[6][7] The company examples show that benefits can appear as cost reduction, distance reduction, planning speed, forecast accuracy, or faster delivery depending on the operating model.[2][3][7][8]
The right conclusion is not “buy AI route optimization.” It is to build the business case around the highest-leak, cleanest-data use case and test the documented 15–30% cost-reduction range against internal pilot results.[2][3][4] If the operation can show the baseline, isolate addressable waste, run a controlled pilot, and validate KPI movement before scaling, the ROI case is credible. If those operating conditions are hidden, the same benchmark becomes a promise the delivery team may be left to defend later.
References
- Capgemini Research last-mile delivery cost research, Capgemini Research.
- FleetRabbit 2026 trends, FleetRabbit, 2026.
- Locus 2026 route optimization ROI research, Locus, 2026.
- RTS Labs 2026 AI route optimization research, RTS Labs, 2026.
- Optimizing Delivery Routes, INFORMS.
- 2025 Shanghai urban dynamic routing study, Scientific Reports, 2025.
- NextBillion.ai last-mile route optimization research, NextBillion.ai, May 2026.
- DHL US Wise Systems operational article, DHL US, September 2023.
- AI-enabled last-mile delivery market report, The Business Research Company.
- Last-mile delivery market research, Coherent Market Insights.
Comments
Join the discussion with an anonymous comment.