
Air cargo schedules are supply chain commitments with wings attached. A departure time decides when freight is available for build-up, whether a shipment can make a connection, which crew can legally operate the sector, whether a tail is clear of maintenance, how much fuel the route will burn, and whether a customer-service team spends tomorrow explaining an exception. That is the practical frame for AI flight scheduling optimization in supply chain decisions: not whether an algorithm can draw a better route map, but whether it changes an operating choice before freight misses its handoff.
The evidence is now strong enough to evaluate, but not tidy enough to overstate. Cargo-specific market research reports 8–12% cargo utilization improvements and 5–8% revenue increases per shipment from air cargo optimization AI, while estimating the air cargo optimization AI market at $2.1 billion in 2025 and projecting $7.8 billion by 2034 at a 14.8% CAGR.[1] IATA-cited material says AI-driven predictive analytics can improve air freight operational efficiency by up to 20%, with route optimization reducing fuel consumption by up to 10% and delays by 15%.[2] A secondary-cited PatSnap deployment claim points to up to 40% fewer cargo handling delays through intelligent coordination, but the method is not independently verified in the materials available here, so it is useful as a signal rather than a benchmark.

What the Schedule Actually Optimizes
In cargo operations, flight scheduling is too often described as if the main object were a timetable. The better unit of analysis is the handoff. Freight is tendered, accepted, screened, built, loaded, flown, recovered, broken down, transferred, and delivered. A schedule that looks efficient in block hours can still fail if it creates a narrow warehouse recovery window or pushes a high-priority connection beyond cut-off.
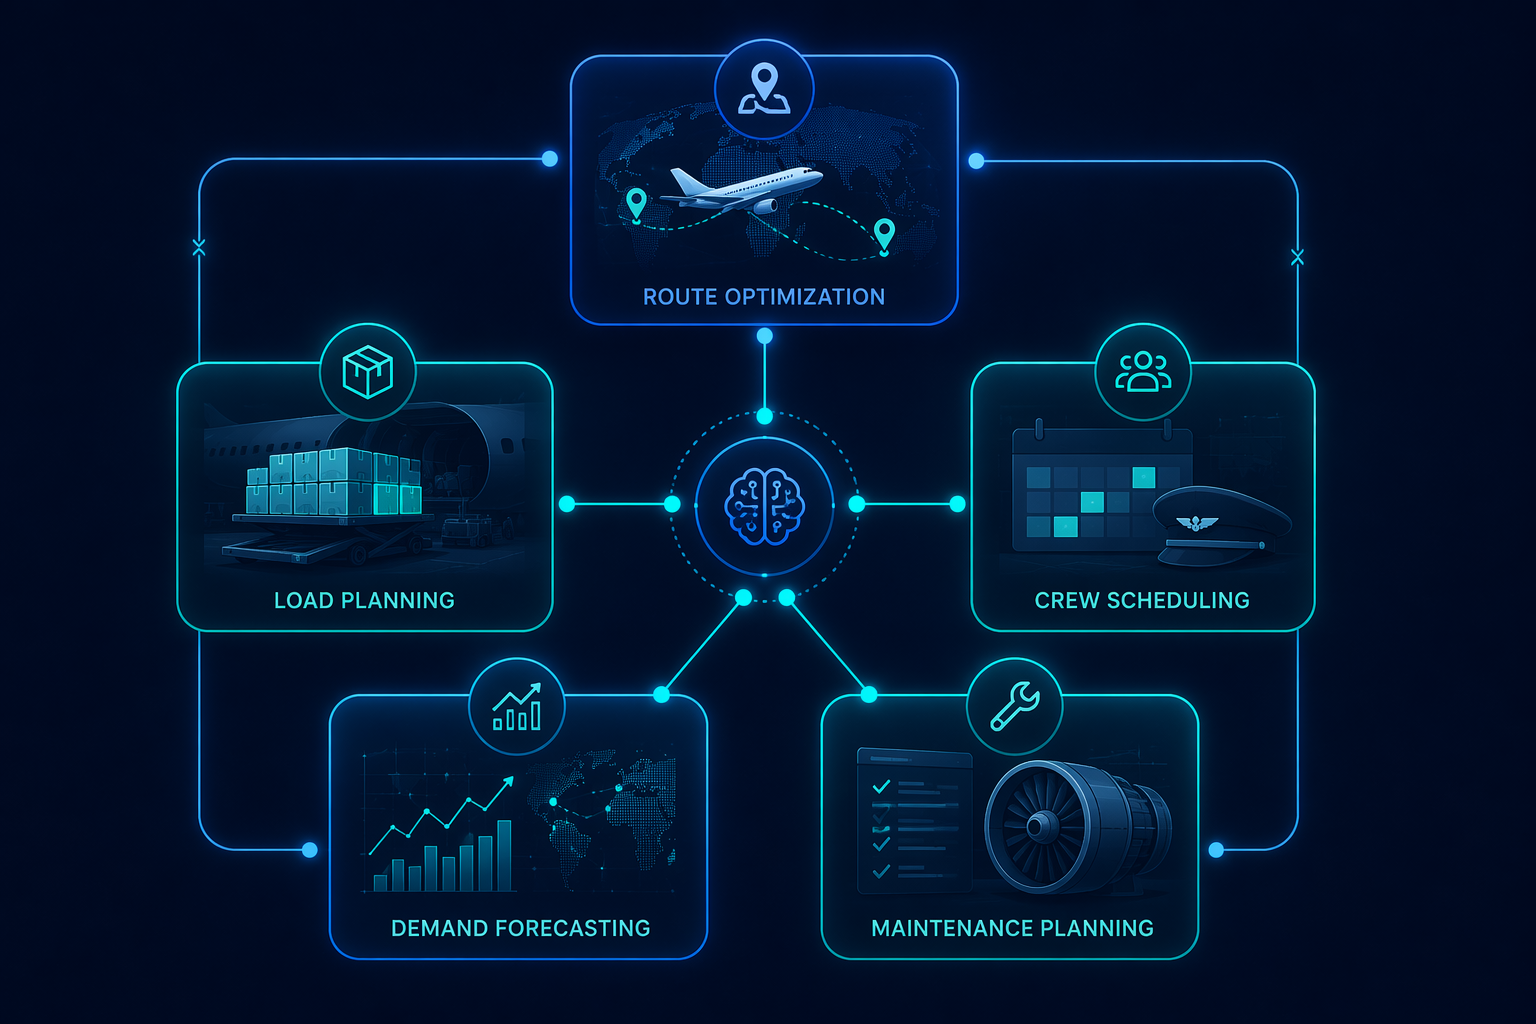
AI scheduling tools usually work across five planning layers. The important point is not that each layer uses a different model. It is that each layer removes a different kind of failure from the schedule before the control room has to improvise around it.
| Application layer | Operational decision | Supply chain consequence |
|---|---|---|
| Route optimization | Which path, altitude, timing, and connection structure best satisfy operating constraints | Fuel exposure, flight time, delay risk, and connection reliability |
| Load planning | Which freight moves on which flight, in which position, under weight, volume, priority, and handling constraints | Utilization, spill, recovery workload, special cargo integrity, and service performance |
| Crew scheduling | Which crew pairings make the schedule legal and recoverable | Whether the planned flight can actually operate without last-minute crew-driven disruption |
| Demand forecasting | Where capacity should be positioned before bookings fully materialize | Backlog risk, empty capacity, spot-market exposure, and missed revenue |
| Maintenance planning | When aircraft can be assigned without creating avoidable technical conflicts | Tail availability, recovery cost, and confidence in promised uplift |
Route Optimization: Where the Most Visible Savings Appear
Route optimization is the easiest layer to see because it touches flight time, fuel, weather avoidance, congestion, and downstream arrival reliability. A cargo operator does not need a perfect route to benefit. It needs a route that arrives inside the handling window often enough to protect the next handoff, while avoiding fuel burn that quietly erodes margin on dense long-haul lanes.
The strongest public examples still lean passenger-heavy. Alaska Airlines’ Flyways AI deployment, as reported through AIAA Aerospace America via eNest, saved 6,866 metric tons of CO2 and reduced average flight time by 2.7 minutes per flight.[3] Those are not cargo utilization results, and they should not be treated as such. They do show that AI-generated routing recommendations can produce measured time and emissions effects in airline operations, which matters for freight where a few minutes can protect a sort window or preserve a tight truck departure.
For cargo, the more direct metric is fuel per ton-kilometer and delay exposure. IATA-cited air freight material reports that route optimization can reduce fuel consumption by up to 10% and delays by 15%.[2] A logistics leader should read that as an upper-bound claim from industry-facing material, not as a guaranteed lane-level result. The value depends on route length, weather variability, airspace flexibility, airport congestion, payload density, and the operator’s ability to accept recommendations before dispatch options close.
The supply chain mechanism is straightforward. If the model proposes a departure, routing, or recovery sequence that keeps the aircraft inside the next handling window, the benefit does not end at the airport. It can reduce premium trucking, customer-service escalations, rebooking work, detention exposure, and inventory exceptions at the consignee. That is why delay reduction belongs in the same conversation as fuel savings, even when the fuel number is easier to quantify.
Load Planning: The Cargo-Specific Layer That Deserves More Scrutiny
Load planning is where passenger-derived scheduling evidence stops being enough. Freight is not seats. It has weight, cube, contour, priority, temperature, dangerous goods restrictions, screening status, ULD availability, build sequence, and destination handling constraints. A cargo schedule can be mathematically elegant and still leave money on the ramp if it fails the load plan.
MarketIntelo’s cargo-specific figures are therefore worth attention: 8–12% utilization improvement and 5–8% revenue increase per shipment are precisely the kind of claims that map to measures a head of air freight would recognize.[1] Utilization can improve because the optimizer sees feasible combinations that manual planning may miss, especially when shipments differ by density, shape, priority, connection time, and handling requirements. Revenue can improve when higher-yield cargo is protected, low-yield displacement is made explicit, and capacity is released with a clearer view of actual constraints.
The 40% cargo handling delay reduction attributed to PatSnap through a secondary citation belongs in the same bucket: important, plausible in direction, but not settled as a generalizable result. Handling delays can fall when the system coordinates flight timing, load readiness, warehouse labor, equipment, and connection priorities. But without independent method detail, the figure should trigger a diligence question rather than become a business-case constant.
A useful evaluation question is not simply, “Does the tool optimize loads?” It is, “Can it show which accepted freight moves, which freight spills, which ULDs are constrained, and which customer promise changes when the flight plan changes?” If the answer is buried in a black-box score, the planner still has to rebuild the operational logic manually when disruption hits.
Crew, Demand, and Maintenance Make the Schedule Executable
Crew scheduling is not the headline supply chain use case, but it is one of the fastest ways for a good schedule to become unusable. An aircraft with cargo, fuel, and a slot still does not move if the crew pairing fails legality or recovery constraints. AI scheduling evidence from passenger networks is relevant here because crew and fleet constraints are shared operating realities, even when the cargo commercial problem differs.
KPMG’s Aviation 2030 material reports that Optifly has seen 5–8% utilization gains, and that Ryanair achieved a 38% seat capacity increase across its Italian network using AI scheduling.[4] The Ryanair figure is a passenger capacity result, not an air cargo utilization result. Its relevance is narrower: it suggests AI scheduling can alter network capacity decisions at scale when the operator trusts the planning output and can execute the changes.
Demand forecasting sits one step upstream. In air cargo, late-booking volatility can make a static schedule either too timid or too expensive. Forecasting helps decide where to position capacity before demand is fully visible: which lanes need extra uplift, which departures can tolerate lower capacity, and where a missed forecast would create a backlog that must be cleared through premium recovery.
Maintenance planning is the quieter constraint. It turns a proposed schedule from commercially attractive to mechanically feasible. The supply chain impact shows up when fewer flights are canceled, fewer aircraft swaps break load assumptions, and recovery planners are not forced to choose between a maintenance requirement and a customer-critical uplift. Optimization-based disruption recovery has been reported to reduce disruption costs by 20–30%, a figure that points directly to the value of recovery planning when the published schedule has already been damaged.[5]
What Named Deployments Actually Prove
The deployment record is useful, but it needs labels. Alaska Airlines is a routing and emissions/time example with passenger-airline origins. Ryanair and Optifly are scheduling and utilization examples from passenger network contexts. BoldIQ is closer to logistics and charter scheduling. Lufthansa Cargo is the most relevant operating signal because it puts AI-proposed scenarios in front of controllers who must accept or reject them under real constraints.
BoldIQ’s case material reports that an air charter client unlocked $90 million in annual value and that a logistics operator achieved $2.4 million in annual savings.[6] Those are vendor-published case figures, so they should be treated as source-attributed commercial evidence rather than independent proof. Still, charter and logistics scheduling are closer to the cargo control-room problem than a seat-capacity example because the operator is often solving around irregular demand, asset availability, crew constraints, and time-sensitive commitments.
The Lufthansa material is more interesting for an operational reason than a marketing one: controllers reportedly accept AI-proposed scenarios in 90% of decisions, and Lufthansa Group projects roughly 50,000 tonnes of annual CO2 reduction through AI-optimized operations. Acceptance does not prove the model is always right. It does suggest the recommendations are credible enough to survive the judgment of people who understand the messiness of daily operations.
That acceptance point matters. Many optimization projects fail not because the math is weak, but because the proposed action arrives too late, ignores a local constraint, or cannot explain why one shipment, aircraft, or crew pairing was favored over another. A tool that controllers regularly accept has crossed a practical threshold: it is not just calculating; it is entering the decision cycle.
The Evidence Map for Supply Chain Leaders
| Reported outcome | Best-supported mechanism | How to read it |
|---|---|---|
| 8–12% cargo utilization improvement | Better matching of freight, capacity, weight, cube, priority, and handling constraints | Cargo-specific and directly relevant, but still source-attributed market research |
| Up to 40% fewer cargo handling delays | Coordination across flight timing, warehouse readiness, equipment, and connection windows | Attention-worthy, but secondary-cited and not independently method-verified |
| Up to 10% fuel reduction and 15% delay reduction | Route optimization and predictive analytics applied to air freight operations | Relevant to cargo, but likely varies heavily by lane and operating environment |
| Up to 20% operational efficiency gain | Predictive analytics reducing avoidable planning and recovery waste | Useful upper-bound indicator, not a guaranteed operating result |
| 20–30% disruption cost reduction | Optimization-based recovery after schedule disruption | Strongly relevant to control-room economics, especially where recovery costs are visible |
| 5–8% utilization gains and 38% passenger seat capacity increase | Network scheduling and capacity allocation | Useful by analogy; not cargo proof |
The cleanest cargo business case connects utilization, delay, fuel, and disruption cost in one operating model. If a tool only promises “better scheduling,” the claim is too vague. If it can show higher payload utilization without creating handling bottlenecks, lower fuel burn without breaking service commitments, and faster recovery when weather or maintenance damages the plan, it is addressing the schedule as a supply chain asset.
This is also where internal comparisons help. Air cargo is not the only logistics domain where AI scheduling has to coordinate scarce assets, weather exposure, and expensive delay. The same evaluation discipline appears in AI offshore wind logistics optimization: the model is only valuable when it changes asset movements, waiting time, and recovery cost, not when it merely produces a more elegant plan.
Implementation Is Becoming Easier, But Not Easy
The buyer market is forming around deployable products rather than isolated experiments. DataIntelo estimates the combined airline schedule and air cargo optimization AI markets at $5.3 billion in 2025, and reports that cloud-based deployments account for 57.3% of new contracts, reducing implementation timelines from 18 months to 6–9 months.[7] Those are proprietary market estimates, not audited adoption figures, but they point to a real packaging shift: buyers are increasingly evaluating cloud-delivered scheduling systems instead of building every optimization layer from scratch.
Cloud deployment does not remove the hard part. A cargo operator still needs clean enough data on bookings, capacity, ULDs, flight status, crew constraints, maintenance events, cut-off times, warehouse milestones, and service commitments. It also needs integration with the systems where decisions are accepted: cargo management, flight operations, crew management, maintenance planning, revenue management, and customer visibility platforms.
For organizations still sorting through cloud readiness, a phased approach matters more than a dramatic platform promise. A cloud migration roadmap for supply chain AI is a useful companion question here because scheduling optimization depends on timely, trusted, cross-functional data. If flight operations has one version of the schedule and cargo handling has another, the optimizer will inherit the disagreement.
- Data readiness: booking, shipment, load, ULD, warehouse, crew, maintenance, and flight-event data must be accurate enough to support operating decisions.
- Decision ownership: controllers, planners, and commercial teams need clear rules for when the AI recommendation overrides the current plan.
- Explainability: the system should show why freight was accepted, spilled, rerouted, or protected.
- Recovery design: the value case should include disruption handling, not just pre-planned schedule optimization.
- Evidence separation: cargo-specific proof should be separated from passenger-derived scheduling results in the business case.
When to Evaluate Now, and When to Wait
A cargo operator should evaluate AI flight scheduling optimization now if schedule recovery cost is visible, utilization is constrained by complex shipment mix, or delay penalties regularly propagate beyond the airport. The stronger candidates are networks with enough frequency, disruption, and planning complexity for optimization to find choices a manual process misses. A single-lane operation with stable demand and generous handling windows may not see the same return.
The diligence standard should be specific. Ask vendors to attribute every outcome claim by source, operating context, and measurement window. Ask whether utilization means weight, cube, revenue, aircraft hours, or some blended internal metric. Ask whether delay reduction refers to departure delay, arrival delay, handling delay, missed connection, or customer-delivery exception. Ask whether a reported gain came from live operations, simulation, pilot, or a passenger network later generalized to cargo.
The use case has crossed the line from speculative to assessable. The best evidence points to measurable cargo utilization, fuel, delay, and recovery benefits; the weaker evidence borrows from passenger aviation or vendor-published case material. That is not a reason to dismiss it. It is a reason to run a structured assessment with cargo-specific proof requirements, source-attributed outcome claims, and enough operational detail to know whether the recommendation will still make sense at 2 a.m. when the connection is closing.
References
- Air Cargo Optimization AI Market, MarketIntelo.
- Artificial Intelligence in Air Freight: Transforming the Industry, Expedock, 2025.
- AI-Powered Route Optimization for Air Cargo, eNest, 2024.
- AI Flight Scheduling FS Aviation 2030, KPMG.
- Optimizing the Skies: How Decision Optimization is Reshaping Aviation, Cresco International.
- Industries Optimized Scheduling, BoldIQ.
- Airline Schedule Optimization AI Market, DataIntelo.
Comments
Join the discussion with an anonymous comment.