
The useful question is not whether AI can see a bridge closure before a transportation agency announces it. Same-day lane-closure notices are often already too late for a carrier that has drivers staged, appointment windows booked, and a dispatch board built around SR 16. The better question is whether the warning signs existed before the notice, whether they were public or commercially ingestible, and whether a monitoring system could have turned them into a routing decision without alarming every time an aging bridge appeared in a database.
For the westbound Tacoma Narrows Bridge, the answer is more credible than a generic “AI predicts infrastructure failure” pitch. The 1950 westbound span had five emergency repairs in 2024, three in 2025, and additional disruption into early 2026 tied to the same recurring joint failure pattern, according to WSDOT repair notices and local reporting summarized in the available record.[1][2] That is not a single black-swan closure. It is a corridor asset repeatedly emitting the same maintenance signal.
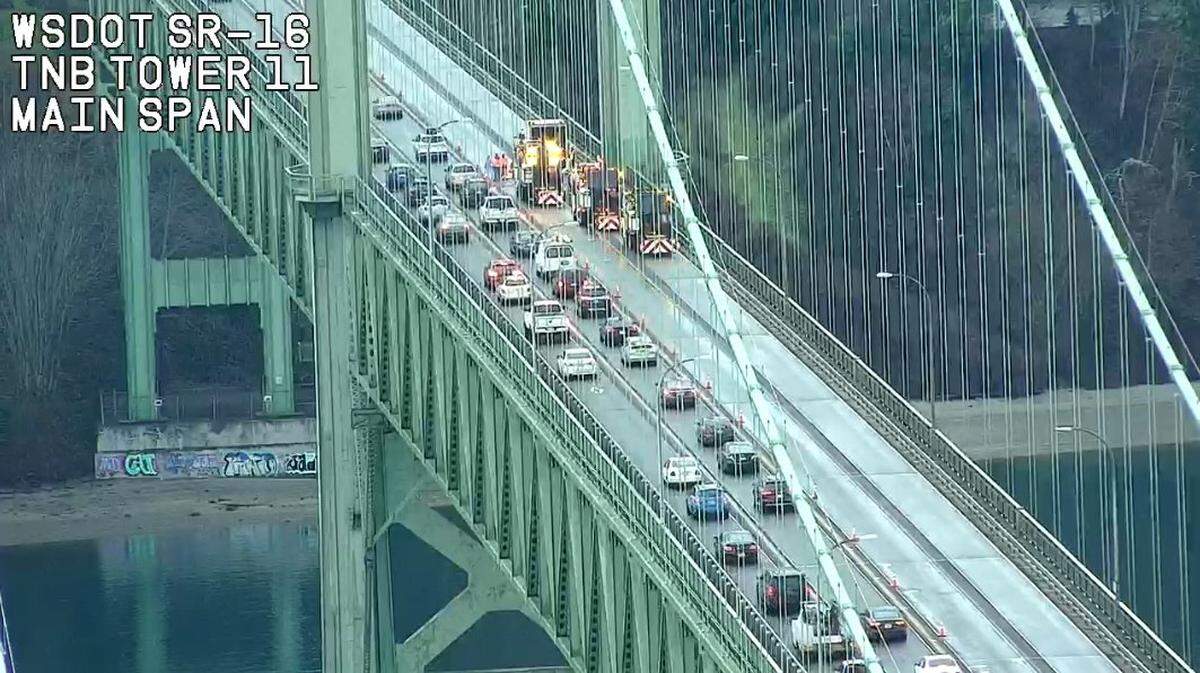
The Pattern Was More Important Than Any One Closure
WSDOT’s May 2024 notice reduced westbound SR 16 across the Tacoma Narrows Bridge to two lanes for emergency repairs, with crews responding to a bridge joint issue.[1] A September 2025 WSDOT notice again reduced the westbound bridge to two lanes for emergency repairs, again tied to work on the bridge deck joint.[2] For a driver, the event is a lane reduction. For a logistics risk team, the more important detail is recurrence: same span, same direction, same class of repair.
That distinction matters because a model does not need to know the exact hour a lane will close to be useful. It needs to recognize that the probability of a disruptive maintenance event on a specific corridor has risen enough to justify a different routing posture. That could mean earlier tendering, a pre-approved alternate route, a customer-facing appointment buffer, or a rule that certain loads avoid the bridge during likely repair windows.
The bridge context supports that kind of risk posture. The westbound Tacoma Narrows Bridge is on WSDOT’s Critical Bridge Needs list in the top 10%, carries about 45,000 westbound vehicles per day, and has a minimum repair backlog estimated at $180 million.[3] The same reporting notes that a practical alternate route can add about 15 miles through the SR 3/Purdy corridor.[3] Those facts do not mean WSDOT has declared the bridge unsafe. They do mean the corridor has high exposure, limited routing flexibility, and a maintenance profile that deserves more attention than a normal map layer.
There is also an important asset distinction that supply chain systems can blur if the data model is sloppy. The recurring repair problem described here concerns the westbound 1950 Tacoma Narrows span. The eastbound 2007 span is a different bridge with a different history and funding structure. A corridor-level dashboard that collapses both spans into one “Tacoma Narrows Bridge” object may be fine for a consumer map. It is not precise enough for freight risk scoring.
Critical Bridge Needs classification also needs careful handling. It is a prioritization and funding signal, not a synonym for “poor condition” or an agency safety declaration. For supply chain monitoring, the label does not prove imminent failure; it raises the baseline attention level when it appears alongside repeated emergency repairs, high daily traffic exposure, limited detour options, and deferred preservation needs.
What an AI Monitor Would Have to Watch
A useful AI system for Tacoma Narrows would not start with news alerts. News is usually confirmation that the corridor is already degrading. The system would start with asset records and maintenance signals that are dull enough to be missed in daily dispatch work: bridge condition reports, inspection schedules, critical-needs rankings, work orders or repair notices when available, historical joint repair events, traffic sensor feeds, and preservation funding signals.

The mechanics are not exotic. It is a data-matching problem with operational consequences.
| Signal | What It Adds to the Decision |
|---|---|
| WSDOT condition reports and inspection schedules | Asset status, inspection cadence, and whether a bridge deserves elevated monitoring |
| Historical emergency repair notices | Evidence that the same joint issue has produced repeated lane reductions |
| Critical Bridge Needs ranking and repair backlog | A baseline indicator that the asset is competing for significant preservation work |
| Traffic sensor feeds | Exposure by time of day, congestion buildup, and whether a closure would hit peak corridor stress |
| Maintenance budget and preservation funding signals | Whether known repair needs are likely to persist rather than disappear after one work window |
Once those feeds are normalized, the model can compare current conditions against the sequence that preceded prior repairs. If bridge joint repair notices tend to cluster after specific inspection findings, repeated short-term fixes, traffic stress, or seasonal maintenance windows, the system can raise the corridor score before the next public lane-closure notice. The output does not have to be a dramatic prediction. A useful alert might say: westbound Tacoma Narrows risk elevated for the next operating window; use pre-approved SR 3/Purdy contingency only for loads with tight appointment penalties; avoid unnecessary reroutes for flexible freight until WSDOT confirms lane restrictions.
That last clause matters. A model that cries wolf every time an old bridge appears in a risk register will be ignored. The Tacoma Narrows case is interesting because the signal is not “old bridge.” It is old westbound span plus repeated same-joint emergency repairs plus top-tier critical-needs status plus a large repair backlog plus heavy daily exposure plus limited alternate routing. Each added signal narrows the alert from a vague infrastructure concern to a corridor-specific operating risk.
The Alert Has to Arrive Before Dispatch Is Locked
For supply chain teams, the lead time threshold is practical. A same-day WSDOT closure notice can help a driver already approaching the bridge. It may not help a carrier redesign routes, notify receivers, consolidate drops, or decide which freight is worth detouring. AI monitoring earns its keep only if it moves the decision point earlier: from “lane closed now” to “this corridor deserves contingency routing before tomorrow’s dispatch is committed.”
The system should therefore separate three outputs that are often blurred in vendor demos: a bridge risk score, a likely disruption window, and reroute timing guidance. A score alone is interesting but passive. A closure probability without business rules is hard to act on. Reroute guidance without a traceable signal chain becomes an expensive guess. The dispatcher needs to know what changed and why.
- Risk score: the westbound span is elevated because recurring joint repair signals are accumulating.
- Likely window: the risk applies to a specific operating period, not an indefinite warning.
- Reroute trigger: use the alternate route only when appointment penalties, load criticality, or customer commitments justify the added mileage.
- Traceability: show the condition, repair, traffic, and funding signals behind the recommendation.
Why the Business Case Is Not Just Avoiding Delay
The cost of a bridge closure is not only the extra miles on a detour. Geotab ITS found that bridge closures increased harsh driving events by 1,750% and peak travel times on alternate routes by 70.8%.[4] Those measures translate into problems dispatch teams recognize immediately: driver safety risk, service deterioration, late arrivals, more exception handling, and less reliable customer communication.
Those figures are useful because they give AI monitoring a harder ROI frame. If a model can reduce the number of loads exposed to a high-risk closure window, the benefit is not limited to avoiding one late truck. It can reduce the concentration of freight pushed onto strained alternate routes, where harsh driving and travel-time spikes are part of the operating consequence. The model still has to prove that its alerts arrive early enough and are selective enough, but the operational damage is measurable.
The West Seattle Bridge closure shows what adaptation looks like once a bridge disruption becomes a standing freight constraint. The Urban Freight Lab documented carrier responses that included reduced route frequency, consolidated deliveries, and in some cases refusal to serve the peninsula during the closure.[5] Tacoma Narrows is not the same case; it is not being treated here as a long-term full closure. The comparison is narrower: when a bridge becomes operationally unreliable, carriers change service patterns, not just driving directions.
The Statewide Context Raises the Baseline Risk
Washington’s bridge inventory adds context without becoming a second case study. As of June 2025, 9.9% of Washington’s 3,427 state bridges were in poor condition, up from 8.5% in June 2024, and 342 bridges exceeded their 75-year design life.[6] The same reporting said WSDOT had only 40% of the preservation funding it needed.[6] Those numbers do not prove any specific Tacoma Narrows closure. They do explain why maintenance backlogs and critical-needs signals should sit inside a logistics risk model rather than outside it.
A conventional supply chain visibility platform may already watch weather, port congestion, labor actions, border crossings, vessel arrivals, and road incidents. That is necessary, but it misses a quieter class of risk: infrastructure assets with repeated maintenance symptoms before the public closure event. The Tacoma Narrows Bridge belongs in that category because the westbound joint repair cycle was visible before each individual disruption became a lane restriction.
Where Control Towers and Digital Twins Fit
Control towers, digital twin planners, and supply chain risk mapping platforms can all support this use case, but only if they ingest the right layer of infrastructure data. A control tower can surface the alert and connect it to shipments. A digital twin can test whether a detour protects appointment performance or simply moves congestion elsewhere. A risk mapping platform can maintain the bridge-level knowledge graph that distinguishes the westbound 1950 span from the eastbound 2007 span.
The implementation question is not whether the tool advertises AI. It is whether the tool can join low-glamour public records to freight operations: inspection schedules to corridor objects, repair notices to recurring failure modes, traffic feeds to departure windows, and budget signals to persistence of risk. If those joins are missing, the platform may still be useful for disruptions that are already visible in news and traffic feeds. It will be weaker at detecting the kind of maintenance pattern Tacoma Narrows showed.
A Practical Tacoma Narrows Alert
A credible alert would avoid false precision. It would not say, “The westbound Tacoma Narrows Bridge will close at 9:12 a.m.” It would say something closer to this: recurring joint repair pattern detected on the westbound 1950 span; asset appears on high-priority bridge needs lists; westbound exposure is about 45,000 vehicles per day; alternate routing adds meaningful mileage through SR 3/Purdy; monitor WSDOT maintenance notices and apply contingency routing rules for time-critical freight.[3]
That alert is less flashy than a deterministic prediction. It is also closer to how operations teams make decisions. They rarely need certainty. They need enough confidence to decide whether the cost of early rerouting is lower than the cost of waiting for an official notice.
Market Forecasts Are Context, Not Proof
Infrastructure risk is also moving from an engineering concern into supply chain planning. Everstream Analytics forecast that at least one multibillion-dollar supply chain disruption from failing infrastructure would occur in 2026.[7] That is a forecast, not evidence that a specific bridge will fail or close. Its value here is market context: more risk teams are being asked to treat infrastructure condition as a live operational variable.
Gartner’s 2026 prediction points in the same direction from the automation side. Gartner said that by 2031, 60% of supply chain disruptions will be resolved without human intervention, and that 55% of supply chain leaders identify AI or agentic AI as the top driver of future performance.[8] That does not remove the need for human judgment in a Tacoma Narrows reroute decision. It does suggest that disruption monitoring systems will increasingly be judged by whether they can act on specialized signals, not just describe visible events.
The Vendor Test
A supply chain team evaluating AI monitoring for the Tacoma Narrows Bridge should ask for a traceable demonstration, not a generic resilience deck. Give the vendor the westbound span, the repair history, and the corridor constraint. Then ask what the platform would have known before each WSDOT lane-reduction notice and what operational recommendation it would have made.
- Can the system ingest WSDOT bridge condition reports and inspection schedules, or only news and traffic alerts?
- Can it distinguish the westbound 1950 Tacoma Narrows span from the eastbound 2007 span?
- Can it connect repeated joint repairs to a recurring failure pattern rather than treating each notice as isolated?
- Can it use traffic sensor feeds to show when a closure would matter most for freight operations?
- Can it explain when not to reroute, so dispatch does not absorb unnecessary miles from false positives?
For corridors like Tacoma Narrows, AI can support earlier contingency routing before same-day closure notices. The defensible promise is narrow: it can identify recurring infrastructure failure patterns soon enough to change selected freight decisions, provided the monitoring stack watches obscure public infrastructure signals that ordinary supply chain visibility tools tend to miss. If a platform cannot consume bridge condition reports, inspection schedules, maintenance priority lists, and traffic feeds, it is not really monitoring the risk that made the Tacoma Narrows Bridge operationally interesting in the first place.
References
- Westbound SR 16 Tacoma Narrows Bridge reduced to two lanes for emergency repairs May 13, WSDOT, 2024
- Emergency repairs reduce westbound Tacoma Narrows Bridge to two lanes Sept. 19-20, WSDOT, 2025
- What will it cost to fix 76-year-old Tacoma Narrows Bridge?, The Olympian
- Geotab ITS Study Shows Impact of U.S. Bridge Closures on Freight and Supply Chains, Work Truck Online
- Understanding and Mitigating Freight-Related Impacts from the West Seattle Bridge Closure, Urban Freight Lab
- Washington bridge condition and preservation funding report, The Center Square
- Are You Prepared for the Supply Chain Disruptions of 2026?, Everstream Analytics
- Gartner Predicts 60% of Supply Chain Disruptions Will Be Resolved Without Human Intervention by 2031, Gartner, 2026
Comments
Join the discussion with an anonymous comment.