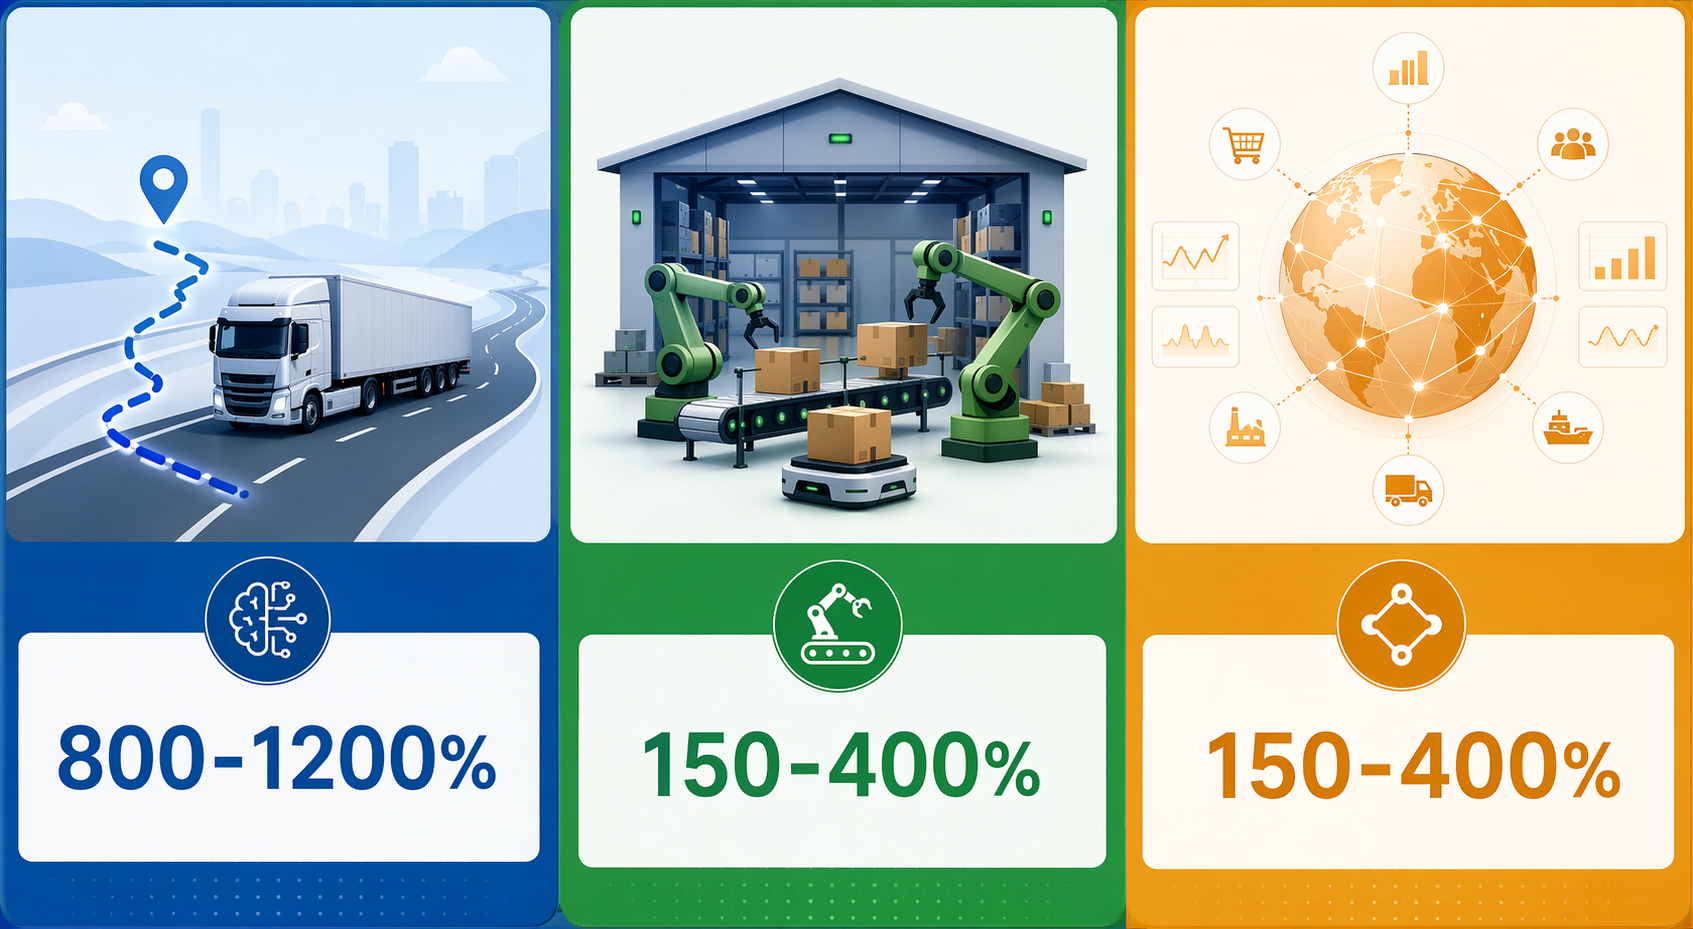
The first budget question in logistics and AI is not whether AI can improve a network. It is which improvement can survive a finance review after the demo assumptions are stripped out. Industry benchmarks put average logistics AI ROI at roughly 190%, but that average hides a wide spread: route optimization on large fleets is cited at 800–1,200% over three years, warehouse automation commonly falls in the 150–400% range, and supply chain orchestration use cases sit across similarly broad bands depending on data quality and operating scope.[1]
Those numbers are not absurd on their face. Logistics has a cost structure where small percentage gains repeat. A routing decision repeats across vehicles, drivers, dispatchers, depots, fuel purchases, customer windows, and operating days. A warehouse labor improvement repeats across pick waves, shifts, aisles, and exception queues. In a mid-market 3PL running on a 4–7% net margin, a 2–3% total cost reduction can change the economics of the account base, not just polish an operating metric.[2]

The defensible case still needs a haircut. The same research base that supports high-return use cases also points to the common failure mode: integration work, data harmonization, and workflow redesign arrive late in the spreadsheet. Deloitte’s 2025 AI ROI work found that only 6% of organizations see AI ROI in under a year, with most satisfactory returns appearing over a 2–4 year window; it also places integration costs at 30–40% of total project cost and warns that omitting them can understate true investment by 40–60%.[3]
Start with the cost base, not the model
A useful AI ROI comparison in logistics starts with where money actually leaves the business. Transport and warehousing have different levers, which is why a single “AI in logistics” return number is too blunt for budget approval.
| Use case | Benchmark ROI range | Main cost lever | Where the case is strongest |
|---|---|---|---|
| Route optimization | 800–1,200% over three years for 500+ vehicle fleets | Fuel, miles, asset utilization, dispatcher workload | Large fleets with frequent routing decisions and usable transport data |
| Warehouse automation | 150–400%; AI-directed picking cited at 250–400%, computer vision sorting at 200–350% | Labor productivity, pick accuracy, sorting throughput | Labor-intensive facilities with repeatable workflows and enough volume to amortize change |
| Supply chain orchestration | Demand sensing 200–350%; risk monitoring 150–400% | Inventory, service levels, exception response, planning labor | Networks where better coordination reduces buffers, expediting, or disruption cost |
McKinsey’s distribution operations benchmarks give a second way to sanity-check the spread. It reports that AI-enabled distribution operations can reduce logistics costs by 5–20%, reduce inventory by 20–30%, and reduce procurement spend by 5–15%.[4] Those are operating improvements, not automatic shareholder returns. Whether they become ROI depends on implementation cost, adoption, operating discipline, and whether the savings hit a budget line that finance can actually remove or redeploy.

Why route optimization can support the highest ROI case
Route optimization earns the most attention because it connects directly to a high-exposure cost line. Fuel represents 25–35% of transport costs, so a 5–10% reduction through AI-assisted routing can move a visible part of the P&L rather than a soft productivity estimate.[1] The larger the fleet, the more that improvement repeats. A better routing engine does not save once; it influences route plans every day, across every vehicle included in scope.
That is the logic behind the cited 800–1,200% three-year return range for route optimization on fleets with more than 500 vehicles.[1] It is best read as a large-fleet benchmark, not a universal promise. The economics look different for a carrier with strong telematics, clean order data, and dispatch compliance than for a fragmented regional network still reconciling addresses, time windows, equipment constraints, and driver rules across disconnected systems.
The route case is also one of the easiest for finance to interrogate. The benefits can be tied to miles avoided, fuel purchased, vehicle utilization, overtime, empty running, customer-window adherence, and dispatch headcount pressure. Some of those benefits are cashable; others are capacity release or service protection. Mixing them together is how an impressive operating case becomes a fragile ROI case.
For a large fleet, the strongest business case usually separates three buckets: direct cost reduction, asset productivity, and service impact. Direct cost reduction covers fuel and mileage-related expense. Asset productivity covers whether the same fleet can handle more volume or defer vehicle additions. Service impact covers fewer late deliveries, fewer manual interventions, and better exception handling. The model becomes more credible when each bucket is measured separately and only the cashable portion is counted in payback.
Warehouse automation has a different ROI engine
Warehouse AI usually does not have the same dramatic benchmark ceiling as large-fleet routing, but its cost base is just as tangible. Labor accounts for 50–70% of warehouse costs, which makes productivity, accuracy, and throughput the main financial levers.[1] AI-directed picking is cited at 250–400% ROI, while computer vision sorting is cited at 200–350%.[1]
The warehouse case depends heavily on whether the system changes the labor model or merely adds another planning layer. AI-directed picking can improve travel paths, batching, slotting decisions, and task sequencing. Computer vision sorting can reduce manual inspection and speed exception identification. Those gains matter most where volume is dense, processes are repeatable, and supervisors can change shift plans around the new workflow.
A common mistake is to treat labor efficiency as if every saved minute immediately becomes removed cost. In practice, some savings appear as lower overtime, better peak handling, lower temporary labor dependency, or more volume through the same building. Those are valuable, but they are not identical. A finance-ready warehouse automation case should state which labor line changes, when it changes, and who is accountable for converting productivity into budget impact.
Warehouse AI can also carry more operational disruption than the benchmark number suggests. Picking logic changes how associates move. Vision systems change exception handling. Supervisors need new dashboards, new escalation rules, and sometimes new incentive structures. If the project plan prices the software but not the workflow redesign, the ROI will look clean until the first site rollout.
Supply chain orchestration is broader, so the proof has to be narrower
Supply chain orchestration covers a wider coordination problem: demand sensing, risk monitoring, inventory positioning, procurement signals, and exception management. The benchmark ranges are attractive, with demand sensing cited at 200–350% ROI and risk monitoring at 150–400%.[1] The difficulty is that the financial path is less direct than fuel saved or picks per labor hour.
Demand sensing may reduce inventory or improve availability. Risk monitoring may reduce expediting, lost sales, or disruption response time. McKinsey’s reported 20–30% inventory reduction in AI-enabled distribution operations is relevant here, but inventory improvement depends on planning authority, supplier behavior, service-level policy, and the organization’s willingness to change buffers.[4]
This is also where broader digital maturity can masquerade as AI causality. Accenture reported in July 2024, based on a study of 1,148 companies, that companies with next-generation supply chain capabilities are 23% more profitable and six times as likely to use AI widely.[5] That is a useful signal: AI-mature supply chains appear to outperform. It should not be presented as proof that AI alone caused the profitability gap. Stronger data foundations, better process discipline, and management maturity are likely part of the same package.
The integration line item is not a footnote
Most weak AI business cases in logistics fail in the same place: they price the visible technology and underprice the connective tissue. A route optimization system needs order data, customer time windows, vehicle constraints, driver rules, depot calendars, live traffic or telematics feeds, and exception feedback. A warehouse AI system needs WMS integration, labor standards, location data, item attributes, scan discipline, and supervisor workflows. A demand sensing system needs master data alignment, planning calendars, sales signals, inventory records, and governance over forecast overrides.
Deloitte’s estimate that integration accounts for 30–40% of total project cost is therefore not an accounting detail; it is often the difference between an approvable and a misleading business case.[3] Data pipelines, ontology harmonization, and workflow redesign are not optional extras when the AI output has to direct trucks, labor, or inventory decisions.

A practical review test is simple: if the business case has separate rows for software subscription, implementation services, internal operations time, IT integration, data cleanup, change management, and post-go-live support, it is at least looking at the real work. If integration is buried inside a single implementation estimate, the project may still be good, but the ROI number is not yet boardroom-safe.
Pilot savings need a scale discount
A pilot is usually run where the odds are favorable: a cooperative site, a manageable lane group, available vendor support, motivated supervisors, and enough attention from leadership to clear obstacles quickly. Full deployment has to absorb exceptions, weaker data, resistant teams, regional variation, and competing priorities. Treating the pilot as a small version of the whole network is where many AI ROI cases become inflated.
The research brief’s recommended safeguard is to apply a 70–80% scaling factor when moving from pilot savings to full-scale projections. In plain terms, a pilot result should usually be discounted before it is multiplied across the network. That does not mean the pilot was false. It means production is less controlled than the test environment.
For example, if a hypothetical routing pilot shows a strong fuel and mileage reduction on a selected group of lanes, the executive case should not simply multiply that saving by every truck in the fleet. It should first ask which depots have comparable data quality, which customer windows are flexible enough for the algorithm to optimize, where dispatchers will follow recommendations, and where regional constraints will dilute the result. The 70–80% scaling factor is a disciplined way to reflect that dilution without pretending to know every site-level issue in advance.
The same logic applies in warehouses. A successful picking pilot in one building may not translate cleanly to facilities with different SKU profiles, slotting discipline, labor mix, automation levels, or supervisor routines. The pilot should earn confidence, not remove skepticism.
A finance-ready ROI case for logistics and AI
The strongest business cases do not start with the highest benchmark. They match the use case to the cost base and then show how the improvement repeats across the operating network.
- For route optimization, tie savings to fuel, miles, vehicle utilization, dispatch workload, and service performance. Use the 800–1,200% benchmark only where fleet scale, data maturity, and routing frequency make that range plausible.
- For warehouse automation, tie savings to labor cost, throughput, overtime, temporary labor, accuracy, and capacity release. Be explicit about whether productivity becomes lower cost or higher volume through the same operation.
- For supply chain orchestration, tie value to inventory, expediting, disruption response, service levels, and planning productivity. Avoid crediting AI for broad digital maturity unless the operating mechanism is clear.
- For every use case, include integration as a major cost category and discount pilot savings before projecting full deployment.
The timeline should also match the investment profile. A high three-year ROI does not imply a fast payback inside the first budget year. Deloitte’s finding that most organizations achieve satisfactory AI returns within 2–4 years is a useful guardrail for executive expectations.[3] If the organization needs payback in less than twelve months, the case should explain why this project is an exception rather than hiding the timing risk.
Logistics AI ROI is real because operating leverage compounds across fuel, labor, inventory, and asset utilization. The believable case is narrower than the headline number: choose the use case that attacks the right cost base, size the network effect honestly, include integration work, and discount pilot savings before scaling them across the business.
References
- Thinking.inc synthesis citing Gartner Supply Chain Technology Report 2025, Thinking.inc / Gartner, 2025.
- European Logistics Association 2025, European Logistics Association, 2025.
- Deloitte 2025 AI ROI timeline and integration cost benchmarks, Deloitte, 2025.
- Harnessing the Power of AI in Distribution Operations, McKinsey, May 2024.
- Companies with next-generation supply chain capabilities achieve 23% greater profitability, Accenture, July 2024.
Comments
Join the discussion with an anonymous comment.