Why Q2 2026 Makes This Snapshot Timely
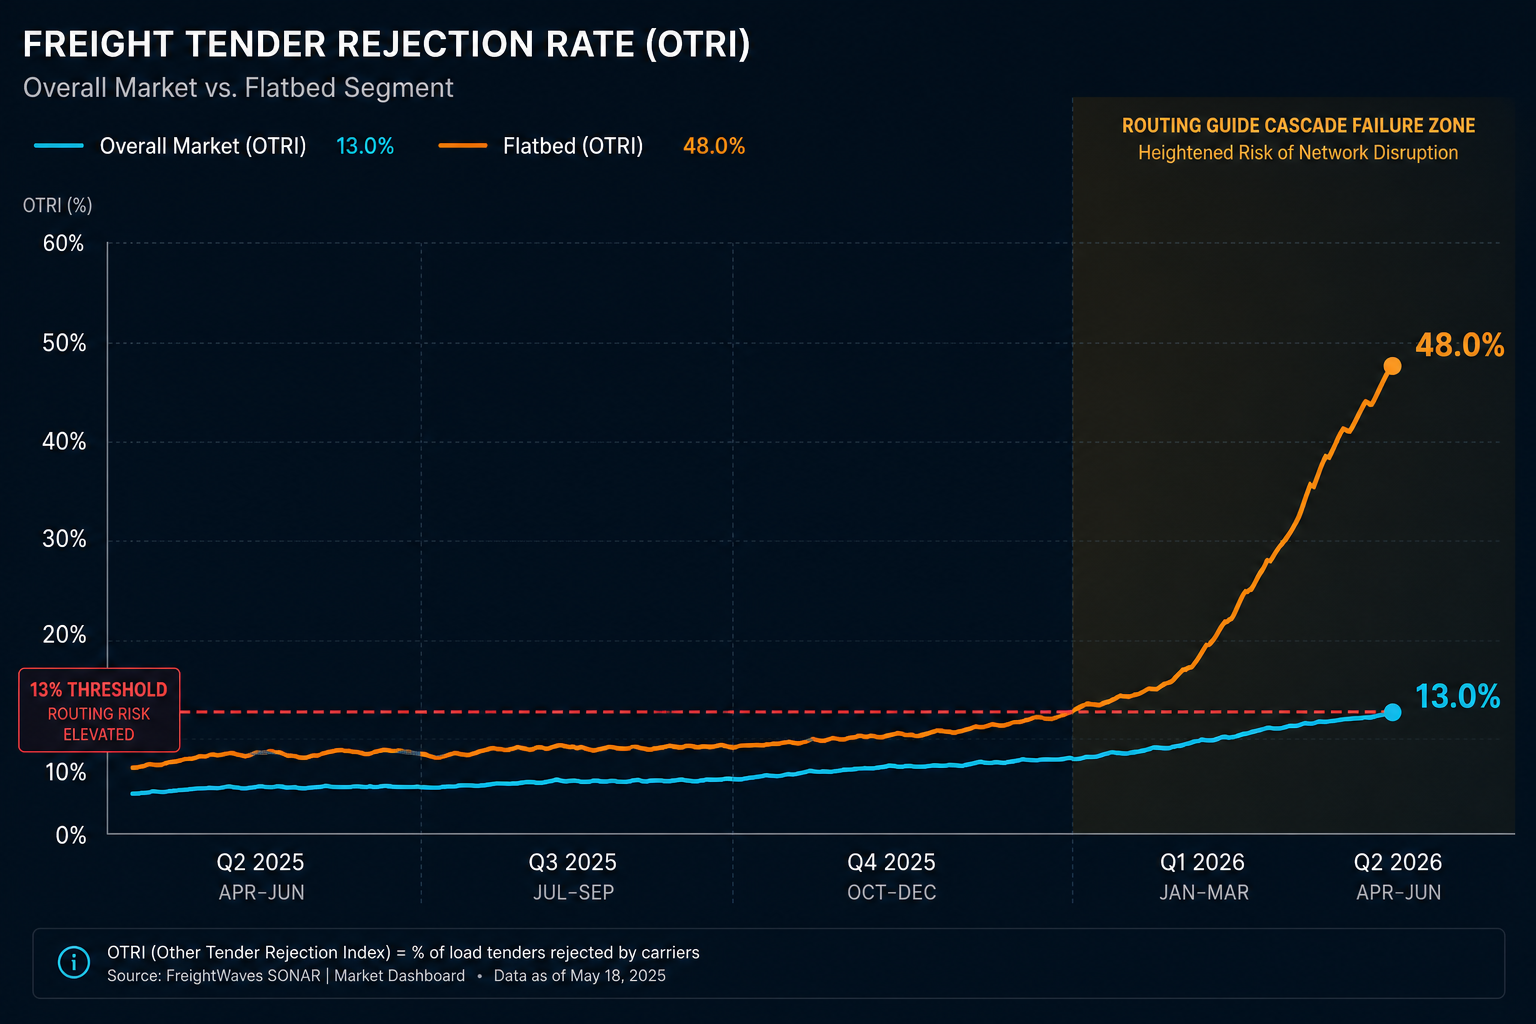
Tender rejection rates are not a lagging indicator in 2026 — they are a live operational crisis for shippers with routing guides built on 2024 contract rates. In March 2026, the Flatbed Outbound Tender Rejection Index spiked to 48.74% according to FreightWaves SONAR data. The broader freight capacity index contracted to 41.0 in early 2026, down from 55.1 in 2025 (Logistics Managers' Index, February 2026). That is not a softening — it is a structural shift in carrier leverage.
The trajectory was visible a year earlier. By June 2025, the national average OTRI had climbed to 6.67% — the threshold where rejections begin putting inflationary pressure on spot rates. Southeast markets crossed 10% that month, with Atlanta at 8.89%, Chicago at 7.07%, and Dallas at 6.86%. Contract rates negotiated in the soft market of 2024 were already flagged as vulnerable to routing guide failure if tightening continued.
By Q1 2026, tightening had accelerated well past those thresholds. At 13%+ nationally and flatbed approaching 50%, routing guide cascade failure — where primary carriers reject, backups reject, and loads fall to expensive spot coverage — is not a theoretical risk. It is a weekly operational event for high-volume shippers on affected lanes.
This is the market environment in which TMS vendors are marketing AI rate prediction and rejection modeling. The question for practitioners is not whether these capabilities exist — nearly every major platform now claims them — but whether the implementations behind those claims are built on the data architecture and signal integration required to function at lane level in a high-rejection market.
Three Distinct Capabilities Bundled as 'AI Rate Intelligence'
Most TMS vendor pitches compress three technically distinct problems into a single "AI rate intelligence" label. Practitioners evaluating vendor claims need to identify which of these capabilities a platform actually supports — because the data requirements, model architecture, and operational outputs differ substantially across all three.
| Capability | What It Does | Output Type | Primary Data Input |
|---|---|---|---|
| Rate Benchmarking | Compares a quoted or contracted rate against historical market data for that lane | Descriptive — was this rate above or below market? | Historical shipment and rate records; market rate databases (DAT, Greenscreens) |
| Predictive Rate Forecasting | Projects future rate levels for a lane over a defined horizon (days to weeks) | Forward-looking regression — expected rate range with confidence interval | Historical rates + external signals: spot indices, OTRI, load-to-truck ratios, seasonal patterns |
| Rejection Probability Modeling | Estimates the likelihood a specific carrier will reject a tender on a specific lane given current market conditions | Classification output — probability score per carrier-lane combination | Historical tender acceptance/rejection data + real-time OTRI + carrier-specific performance signals |
Rate benchmarking is the most widely deployed capability and the least differentiated — most TMS platforms with any market data integration can produce it. Predictive rate forecasting requires external signal integration and validated forward-looking models. Rejection probability modeling is the most operationally valuable in a high-OTRI environment and the least commonly implemented at lane level with verifiable accuracy.
A fourth tier — agentic AI response — is emerging in a small number of platforms. This goes beyond prediction to autonomous action: automatically re-tendering to backup carriers, adjusting rate offers, or initiating spot market coverage within configured guardrails. Practitioners should evaluate whether a vendor's "agentic" positioning means recommendation-only or execution-authorized — the operational and governance implications differ substantially.
Vendor Capability Matrix: What Is Verifiable in Q2 2026
The following matrix covers named TMS platforms with capability evidence graded by verification level. "Verified" means the capability is confirmed by independent analyst coverage, documented deployment metrics, or published product specifications. "Vendor-reported" means the capability is stated in vendor documentation or marketing materials but lacks independent validation at lane level. "Not confirmed" means the capability was not substantiated by available sources for this snapshot.
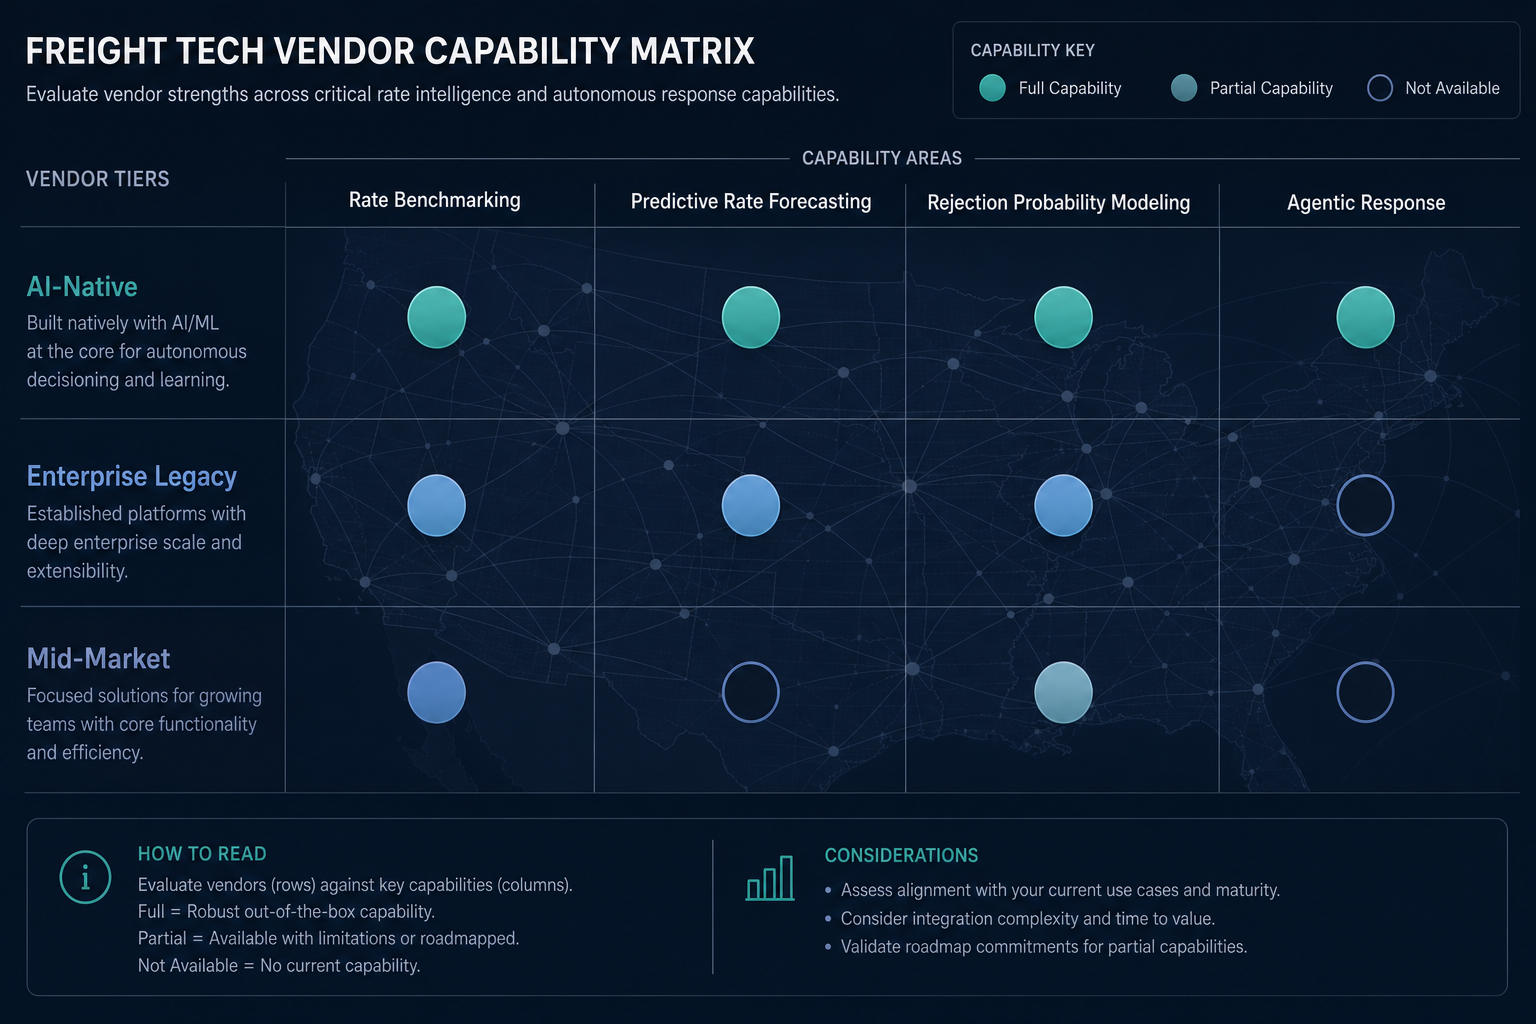
| Platform | Rate Benchmarking | Predictive Rate Forecasting | Rejection Probability Modeling | Agentic Response | Primary Market Focus | Verification Level |
|---|---|---|---|---|---|---|
| project44 Intelligent TMS | Yes — live market data via 259K carrier network | Yes — lane-level, external signal-integrated | Yes — integrated with Procurement Agent workflow | Yes — Procurement Agent (March 2026 launch) | Global shippers, enterprise | Verified: deployment metrics published |
| Oracle OTM | Yes — via market data integrations | Yes — ML-based transit time and scenario modeling | Not confirmed at lane level | Partial — AI Agents for planning workflows | Enterprise, multimodal | Verified: Gartner MQ Leader (19th year, April 2026); lane-level rejection probability not confirmed |
| Trimble TMS | Yes — automated tender grading | Yes — load forecasting up to one week ahead | Not confirmed at lane level | Not confirmed | Enterprise fleet operators | Vendor-reported: 7 AI modules; lane-level rejection probability not confirmed by independent sources |
| McLeod Software | Yes — via MPact freight matching | Vendor-reported | Partial — RespondAI for automated tender response (acceptance/rejection decision support) | Partial — RespondAI automates response execution | Large-to-mid carriers and brokers | Vendor-reported |
| Rose Rocket / TMS.ai | Yes — DataBot for automated data processing | Vendor-reported | Vendor-reported | Partial — context-aware AI workflows | Mid-market brokers and carriers | Vendor-reported; rebranded late 2025 |
| Numeo TMS | Vendor-reported | Vendor-reported | Not the primary use case | Yes — agentic dispatch, load matching, broker negotiation | Small-to-mid carriers | Vendor-reported; carrier-side focus, not shipper-side rate prediction |
| Blue Yonder TMS | — | — | — | — | Enterprise | Verifiable AI capability detail not available for this snapshot |
project44 Intelligent TMS
project44 has the most verifiable external data architecture of any platform in this snapshot. Its logistics data graph connects over 259,000 carriers, processes data from 1.5 billion shipments annually across 186 countries, and validates more than 700 million logistics events daily. This data density is what distinguishes its predictive layer from TMS platforms operating on self-contained shipment histories.
The Procurement Agent launched in March 2026 within the Intelligent TMS platform, automating carrier selection, rate benchmarking, and negotiations using live market conditions and carrier performance data. Early deployment metrics reported by project44 include a 4.1% reduction in freight spend, up to 75% reduction in sourcing cycle times, and a 70% reduction in manual coordination effort. These are early-deployment figures from a limited production rollout, not a mature average across the installed base — but they represent the most specific verifiable outcome data available for any platform in this category.
Organizations can configure the agent's authority — setting rate thresholds, carrier eligibility, and contract parameters — with the option to start in recommendation-only mode before enabling autonomous execution. This is a meaningful distinction: the agentic capability is guardrail-configurable, not open-ended.
Oracle OTM
Oracle was named a Leader in the 2026 Gartner Magic Quadrant for Transportation Management Systems for the 19th consecutive year, positioned highest for both Ability to Execute and Completeness of Vision. Its AI capabilities in OTM include AI Agents for automating decisions and streamlining workflows, more accurate transit time predictions via machine learning, and AI-driven what-if scenario modeling for logistics networks.
What Oracle's Gartner positioning does not confirm is native lane-level tender rejection probability modeling. The AI Agents described in Oracle's published materials focus on planning, optimization, and transit time prediction — capabilities that are analytically verified but distinct from the real-time rejection risk classification that practitioners need in a 13%+ OTRI environment. Practitioners should probe Oracle specifically on this capability in RFP processes and not assume Gartner MQ leadership position implies lane-level rejection modeling.
Trimble TMS
Trimble's TMS platform includes seven AI modules: Order, Capacity, Supply:Demand, Status, Back Office, and Control Center components. The Supply:Demand and Capacity modules address load forecasting up to one week ahead and automated tender grading. These are verifiable capabilities from vendor documentation. However, lane-level rejection probability modeling — as a classification output estimating per-carrier rejection likelihood given current market conditions — is not confirmed by independent sources for the Trimble platform.
Trimble's 2026 Transportation Pulse Report, based on surveys of 230+ shipper and carrier/LSP executives, provides useful market context: 44% of shippers are already using AI in transportation planning and optimization, and 43% cite enhanced predictive capabilities as the top benefit of combining AI with a network-connected TMS versus a siloed one. This is market research data — it characterizes adoption intent, not Trimble's specific product capability.
McLeod Software, Rose Rocket / TMS.ai, and Numeo TMS
McLeod Software's RespondAI automates tender response decisions for carriers and brokers, and its MPact product addresses AI freight matching. These are carrier- and broker-side capabilities rather than shipper-side rate prediction tools. RespondAI represents a form of agentic response at the acceptance/rejection decision layer, but it is oriented toward the carrier deciding whether to accept a load — not toward the shipper predicting whether a carrier will reject.
Rose Rocket rebranded as TMS.ai in late 2025, positioning itself as a fourth-generation AI-native platform with DataBot for automated data processing and context-aware AI for mid-market brokers and carriers. Capability claims are vendor-reported and not yet independently validated at the lane-level accuracy standard this snapshot applies.
Numeo TMS leads with agentic dispatch, load matching, and broker negotiation for small-to-mid-sized carriers. Its positioning is carrier-side operational automation rather than shipper-side rate prediction and rejection risk modeling. It is included here for completeness as an AI-native entrant, but its primary use case is not aligned with the shipper-side evaluation criteria this snapshot addresses.
External Market Signal Architecture: The Factual Differentiator
The gap between a TMS that predicts rejection risk and one that reports historical acceptance rates comes down to a single architectural question: what external market signals does the platform ingest in real time, and how are those signals integrated into the prediction model?
A model trained only on a shipper's own tender history will systematically underperform in market inflection points — precisely the moments when accurate prediction matters most. When OTRI shifts from 7% to 13% nationally, a model without live OTRI integration has no mechanism to update its rejection probability estimates until the shipper's own rejection data accumulates. That lag can represent weeks of routing guide exposure.
| Signal Type | What It Measures | Operational Value for Rejection Modeling | Available in Named Platforms |
|---|---|---|---|
| OTRI (FreightWaves SONAR) | Percentage of contract tenders rejected by carriers in a given market/lane | Leading indicator: rising OTRI precedes spot rate increases by days; signals routing guide stress before failures accumulate | project44 (verified via data network); others require third-party connector |
| Load-to-Truck Ratio (DAT) | Ratio of available loads to available trucks on a lane | Capacity tightness indicator: high ratios correlate with increased rejection probability | DAT API integration; availability varies by platform |
| DAT Ratecast | Forward-looking rate forecast for specific lanes | Predictive rate benchmarking with published validation methodology | DAT API integration; not natively embedded in most TMS platforms |
| Carrier Authority Data | Active carrier authority activations and revocations (FMCSA) | Capacity supply signal: net carrier exits tighten available capacity | Varies; project44 network tracks carrier-level data at scale |
| MSA-Level Freight Aggregates | Regional freight volume and rate data aggregated at Metropolitan Statistical Area level | More stable than zip-code-level data for model training; captures regional economic trends | Emerging practice; not widely disclosed by TMS vendors |
project44's data architecture is the most verifiable in this category. Its logistics data graph, processing 700 million logistics events daily across 259,000 carriers, provides a real-time market signal layer that most TMS platforms cannot replicate from internal data alone. The practical implication is that project44's rejection probability estimates can update based on current carrier behavior across the network — not just the shipper's own tender history.
DAT's Ratecast product provides a useful benchmark for what a validated AI rate forecasting claim should look like. DAT validates Ratecast using median absolute error — measuring the median absolute percent difference between forecasted and actual rates — and reports accuracy above 95% across more than 7 million daily predictions. This is the standard practitioners should apply when evaluating any vendor's accuracy claim: a named validation methodology, a specified error metric, and a disclosed prediction volume.
MSA-level data aggregation is emerging as a more stable input for AI rate models than zip-code-level data. The practical reason: zip-code-level freight data is sparse on many lanes, producing noisy model inputs that degrade accuracy. MSA-level aggregation provides larger, less noisy datasets that capture regional economic trends while retaining enough geographic specificity to be operationally useful. This is an implementation detail worth probing in vendor evaluations — a platform claiming lane-level prediction should be asked whether its geographic granularity is zip-code, MSA, or market-level.
Data Requirements by Capability Tier
The minimum data conditions required for each capability tier are not uniform. Practitioners deploying or evaluating these capabilities need to assess their own data readiness before expecting vendor AI features to function as described.
For reliable seasonal pattern recognition in rate forecasting, a minimum of 12 to 24 months of clean historical shipment data is required — 24 months is recommended to give models two full seasonal cycles. Initial model accuracy on new deployments is typically lower, improving as the model accumulates lane-specific data. Accuracy is materially lower for entirely new lanes or during unprecedented market disruptions where historical patterns do not hold.
The six core data inputs for accurate AI freight rate forecasting, as identified by practitioners and validated by industry sources, are:
- Historical shipment data — lane-level rate, volume, carrier, and tender outcome records with minimal gaps
- Economic indicators — GDP, PMI, retail sales data that correlate with freight demand cycles
- Freight market signals — spot rates, OTRI, and load-to-truck ratios from external data providers
- Weather and disruption data — event feeds that affect lane availability and transit times
- Capacity supply data — carrier authority activations and revocations, fleet size changes
- Customer and pipeline intelligence — known demand shifts, seasonal programs, and volume commitments that affect lane-level freight patterns
The critical differentiator between capability tiers is not the first item on that list — most TMS platforms have historical shipment data — but the third: external freight market signal integration. A platform without live OTRI and load-to-truck ratio feeds cannot produce forward-looking rejection probability at lane level. It can only report what happened historically on that lane, which is a different and operationally less valuable output.
For rejection probability modeling specifically, there is an additional data requirement that is often overlooked: carrier-specific tender outcome history. A model that predicts rejection probability at the lane level without carrier-level resolution is less actionable — knowing that "20% of tenders on this lane will be rejected" does not help a transportation planner decide which carrier to tender first. The more useful output is a per-carrier rejection probability on a specific lane given current market conditions, which requires carrier-level historical data and real-time market signal integration simultaneously.
Implementation Evidence Versus Marketing Claims
The verification gap between what vendors claim and what is independently evidenced is wide in this category. Practitioners should apply a consistent standard across all platforms: what is the source, what is the methodology, and what is the scope of any capability or accuracy claim?
| Platform | Claim Type | Evidence Basis | Practitioner Interpretation |
|---|---|---|---|
| project44 Intelligent TMS | 4.1% freight spend reduction; 75% faster sourcing cycle; 70% reduction in manual coordination | Early deployment metrics reported by project44 (March 2026 launch) | Verifiable early-deployment evidence from a limited production rollout — not a mature installed-base average. Treat as directionally meaningful, not as a guaranteed outcome. |
| Oracle OTM | Gartner MQ Leader, 19th consecutive year (April 2026); AI Agents for transit time and what-if modeling | Independent analyst evaluation (Gartner Magic Quadrant, March 2026) | Analyst-verified planning and optimization capabilities. Does not confirm native lane-level tender rejection probability. Gartner MQ criteria do not specifically score rejection modeling depth. |
| Trimble TMS | 43% of shippers cite enhanced predictive capabilities as top benefit of network-connected TMS; 44% of shippers using AI in transportation planning | Trimble 2026 Transportation Pulse Report (230+ executives, survey-based) | Market research data characterizing adoption intent and perceived benefit — not a product capability specification or accuracy validation. |
| DAT Ratecast | >95% accuracy across 7M+ daily predictions | DAT's published validation methodology: median absolute error measurement | The benchmark standard for what an AI rate forecasting accuracy claim should include. Use this as the evaluation template for other vendor claims. |
| McLeod RespondAI / MPact | Automated tender response; AI freight matching | Vendor-reported product documentation | Carrier/broker-side automation capability. Not independently validated for shipper-side rate prediction accuracy. |
The agentic AI tier deserves specific scrutiny. Both project44's Procurement Agent and Numeo TMS position themselves as agentic implementations — but the operational scope differs. project44's Procurement Agent operates on the shipper side, automating carrier selection, rate negotiation, and tender decisions within guardrails configured by the shipper. Numeo TMS operates on the carrier side, automating dispatch and load acceptance decisions. These are not equivalent capabilities despite sharing the "agentic AI" label.
The governance question for agentic implementations is whether the system recommends actions for human approval or executes actions autonomously within defined parameters. project44's Procurement Agent supports both modes — organizations can start in recommendation-only mode and expand the agent's authority incrementally. This guardrail-configurable design is the appropriate starting point for most enterprise deployments where freight spend accountability rests with a human procurement team.
Practitioner Evaluation Checklist for TMS RFPs
The following checklist is structured for transportation procurement leads and TMS evaluation teams conducting vendor assessments in Q2 2026. It is organized around the questions that distinguish genuine implementations from marketing claims in this specific capability area.
Rate Prediction and Rejection Modeling Capability
- Does the vendor publish lane-level accuracy metrics for rate prediction? If yes, request the named validation methodology (e.g., median absolute error), the error metric definition, the prediction volume, and the lane scope. If no, treat accuracy claims as unverified.
- Is rejection probability modeling a classification output (per-carrier probability score) or historical acceptance rate reporting? These are different capabilities. Historical acceptance rates tell you what happened; classification outputs estimate what will happen given current conditions.
- What external market signal feeds are natively integrated versus requiring third-party connectors? Ask specifically about OTRI feeds (FreightWaves SONAR), DAT load-to-truck ratios, and DAT Ratecast. Native integration means the signals feed directly into the model; connector availability means the shipper must configure and maintain the integration separately.
- Can rate prediction and rejection modeling feed a combined decision workflow? Separate rate and rejection modules that do not share a common decision layer require manual synthesis by the transportation planner — reducing the operational value of both.
- What is the minimum data history required for the AI features to function as described? Request the vendor's stated minimum and recommended data history for reliable seasonal modeling. 12 months is the functional floor; 24 months is the industry-recommended standard for seasonal pattern recognition.
- At what geographic granularity does the model operate? Zip-code-level predictions are more susceptible to data sparsity issues than MSA-level or market-level aggregations. Ask whether the vendor uses MSA-level data aggregation for training stability.
Agentic AI Tier (if applicable)
- Does the agentic capability automate execution within guardrails, or does it only generate recommendations for human approval? Both are legitimate designs, but they have different governance implications. Clarify which mode is the default and whether the shipper can configure the authority level incrementally.
- What parameters can the shipper configure as guardrails? Rate thresholds, carrier eligibility lists, contract parameters, and escalation triggers should all be shipper-configurable. Ask for documentation of the guardrail configuration interface.
- What is the audit trail for autonomous decisions? Every autonomous tender decision, rate negotiation, and carrier selection action should be logged with the market signal inputs that drove the decision. This is a governance requirement, not an optional feature.
Data Integration and Readiness
- What is the vendor's assessment process for the shipper's existing data quality before deployment? Inconsistent data quality is the primary barrier to AI adoption in transportation, per Trimble's 2026 Pulse Report. A vendor that skips data quality assessment in the sales process is setting up a deployment that will underperform against stated capabilities.
- What are the ERP and TMS integration requirements for the AI features to receive the data inputs they need? Predictive features that require data not currently flowing from the shipper's ERP or existing TMS will need integration work before they can function. Request a data dependency map as part of the pre-sales process.
- How does the model handle sparse lane data? Every shipper has lanes with limited historical data. Ask whether the model falls back to market-level signals on sparse lanes, uses transfer learning from similar lanes, or simply produces lower-confidence outputs — and how that confidence level is communicated to the user.
The 2026 freight market has created genuine urgency around AI rate prediction and rejection modeling — but urgency is also the condition under which vendors succeed in selling capabilities that are not yet production-ready at the depth buyers assume. The evaluation checklist above is designed to surface that gap before contract signature, not after a failed deployment.
Comments
Join the discussion with an anonymous comment.