Use Case Definition and Functional Scope
AI demand forecasting in CPG and retail refers to the application of machine learning and statistical AI methods to generate a forward-looking estimate of consumer or customer demand — expressed as expected unit volume by SKU, location, and time period. The use case is bounded to the generation of the demand signal itself.
Two adjacent use cases are frequently conflated with demand forecasting but are functionally distinct. Inventory optimization takes the demand signal as an input and translates it into replenishment decisions, safety stock targets, and order quantities. S&OP and IBP processes ingest the demand signal and reconcile it with supply capacity, financial plans, and commercial commitments. Neither belongs inside the scope of this entry. AI demand forecasting ends when the signal is produced; what happens to that signal downstream is a separate application.
This entry covers the demand signal generation layer across both CPG manufacturer and retailer-operator deployment contexts. It does not cover how that signal is consumed by replenishment engines, financial planning tools, or supply planning systems.
The Four Functional Sub-Use-Cases
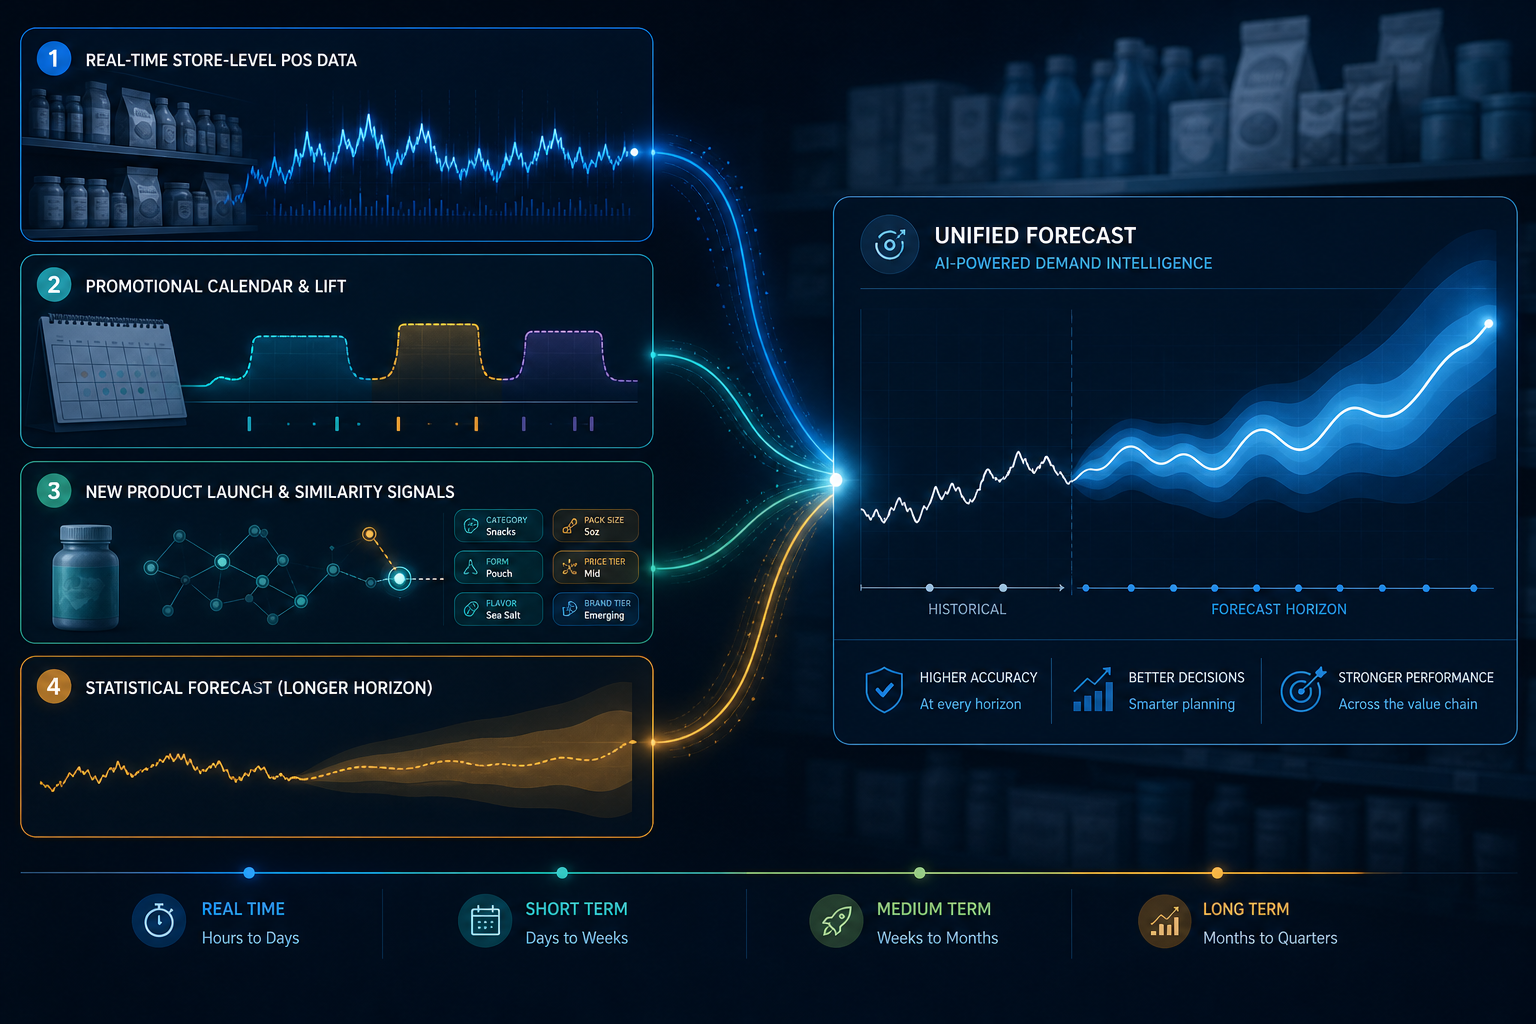
AI demand forecasting in CPG and retail is not a single application. It is a family of four distinct functional sub-use-cases, each operating at a different planning horizon, requiring different data inputs, and applying different AI techniques. Decision-makers who evaluate "demand forecasting AI" as a single undifferentiated capability systematically select vendors optimized for the wrong sub-use-case and underestimate the data prerequisites for the one they actually need.
The taxonomy below is a structuring framework synthesized from practitioner and analyst literature. It is not a formally standardized industry classification, but it reflects how the most mature deployments are actually organized in production environments.
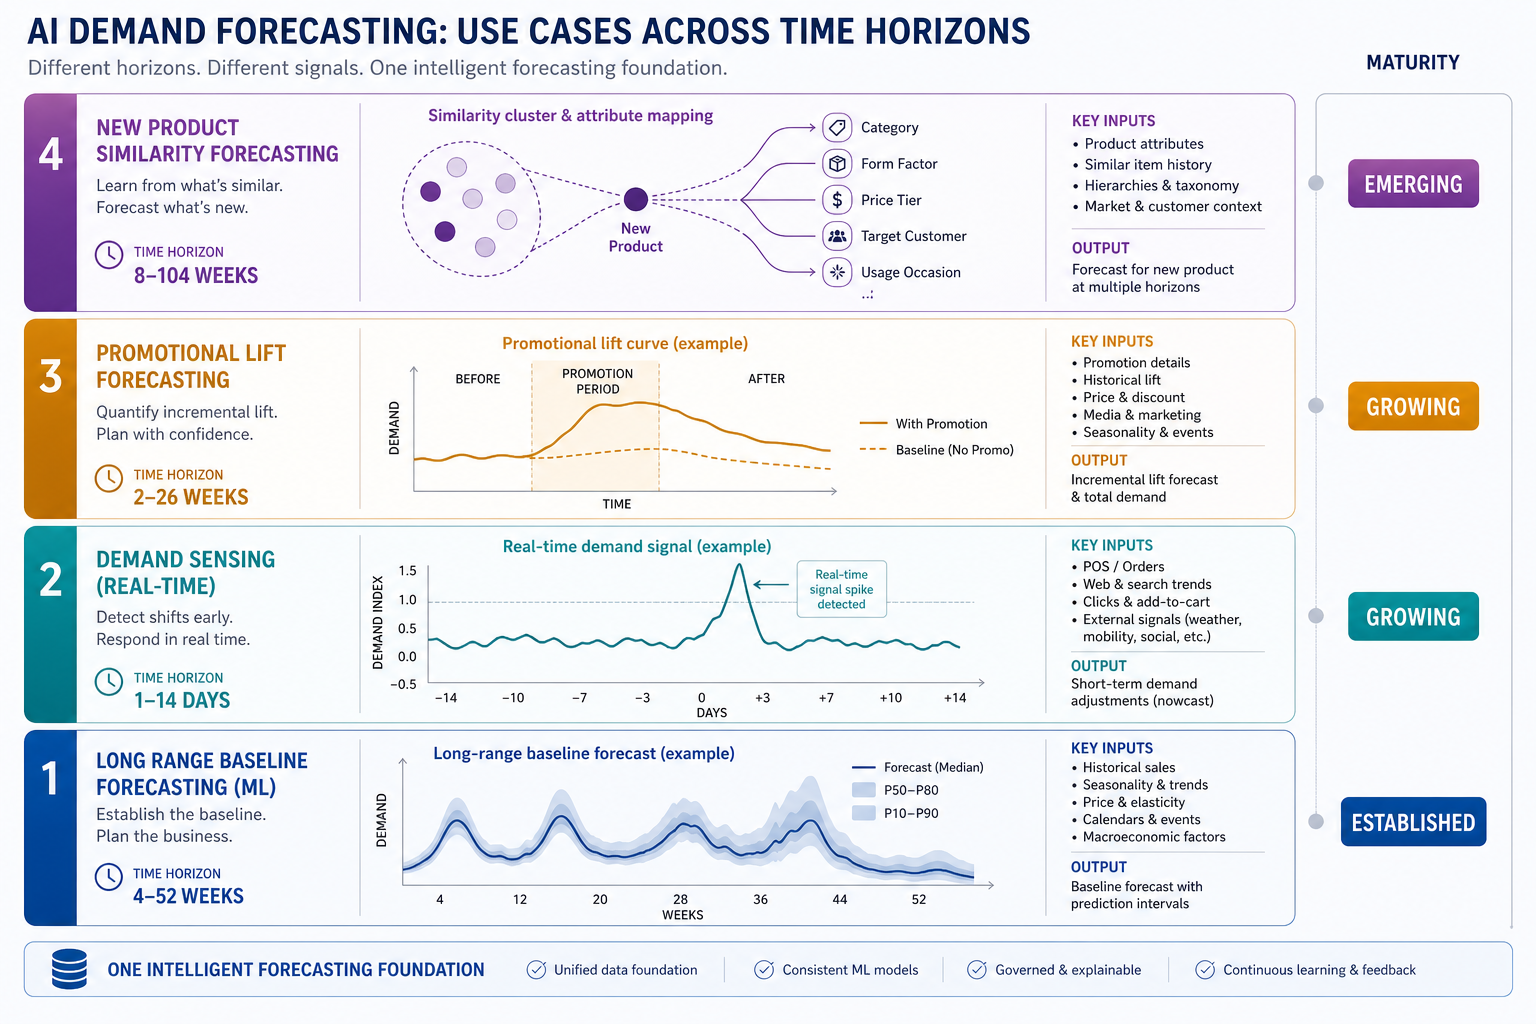
1. Baseline ML Forecasting
Planning horizon: 4 to 52 weeks. This is the foundational sub-use-case — generating a statistically robust baseline demand estimate across the full product-location hierarchy. Gradient boosting models (XGBoost, LightGBM) and deep learning architectures (LSTM, Transformer-based models) are the dominant AI techniques at production scale. Required data inputs include 18 or more months of historical POS or shipment data by SKU and retailer, a promotional calendar with pricing and timing, the product hierarchy, and weather data for temperature-sensitive categories. The baseline forecast is the upstream input that all other sub-use-cases either refine or extend.
2. Demand Sensing
Planning horizon: 1 to 14 days. Demand sensing operates in the very near term, integrating real-time signals — daily or intraday retailer POS feeds, weather events, local calendar events, and social signals — to continuously update the short-horizon demand estimate. The AI technique is signal integration and rapid model updating rather than long-range statistical forecasting. The primary infrastructure requirement is a live POS data connection, which is a significant barrier for CPG manufacturers who lack direct retailer data access.
For production deployment detail on this sub-use-case, see the CPG Manufacturer Demand Sensing AI: Production Deployment Case Study on this site.
3. Promotional Lift Modeling
Planning horizon: event-specific, typically 2 to 8 weeks pre-event through post-event. The core problem is separating baseline demand from promotional lift — the incremental volume attributable to a price reduction, display, feature, or media event. Without this separation, historical sales data is contaminated: a model trained on blended promotional and baseline sales will overestimate regular-period demand and misfire on post-event inventory needs.
Causal machine learning models and price elasticity frameworks are the primary AI techniques. Required data inputs include two or more years of promotional history with lift coefficients and out-of-stock flags, media spend data, and a price elasticity baseline. The combinatorial complexity of product × store × promotion × season interactions is large enough that manual feature engineering cannot capture it reliably at scale — which is precisely where ML-based causal models add structural value over traditional statistical approaches.
4. NPI Forecasting
Planning horizon: pre-launch through initial weeks of market availability. New product introductions have no sales history by definition, which eliminates the primary input that baseline ML forecasting depends on. Attribute-based transfer learning and similarity clustering are the AI techniques that address this gap: the model identifies existing products with comparable attributes — price point, category, packaging format, weight, material — and transfers their demand patterns to generate a baseline forecast for the new item.
This approach requires a well-structured product attribute taxonomy and a library of comparable product sales profiles. It also requires cannibalization modeling — estimating how the new product will substitute for existing demand rather than adding purely incremental volume. Without cannibalization adjustment, NPI forecasts systematically overstate net demand uplift.
| Sub-Use-Case | Planning Horizon | Primary AI Technique | Core Data Inputs | Maturity |
|---|---|---|---|---|
| Baseline ML Forecasting | 4–52 weeks | Gradient boosting, LSTM, Transformer models | 18+ months POS/shipment data, promotional calendar, product hierarchy, weather | Established |
| Demand Sensing | 1–14 days | Real-time signal integration, rapid model updating | Live retailer POS feed, weather/event signals, inventory position | Growing |
| Promotional Lift Modeling | Event-specific (2–8 weeks) | Causal ML, price elasticity models | 2+ years promo history with lift coefficients and OOS flags, media spend, elasticity baseline | Growing |
| NPI Forecasting | Pre-launch through initial weeks | Attribute-based transfer learning, similarity clustering | Product attribute taxonomy, comparable product sales profiles | Emerging |
Where Measurable Value Is Delivered
ROI evidence for AI demand forecasting is well-documented at the baseline forecasting level. The figures cited most frequently in analyst and practitioner literature come from McKinsey research on supply chain AI, which found that AI-driven forecasting can reduce supply chain errors by 20 to 50 percent and translate into a reduction in lost sales and product unavailability of up to 65 percent. These figures apply to mature baseline forecasting implementations at scale — they should not be applied uniformly across all four sub-use-cases, each of which has its own ROI profile.
Baseline Forecasting ROI
Documented outcomes from named production deployments include a 30 percent reduction in lost sales at Danone following deployment of an AI-powered demand model. Nestlé achieved a 30 percent reduction in demand forecasting errors. A McKinsey-documented personal care CPG case reported a 13 percent improvement in forecast accuracy, a 40 percent reduction in supply shortages, and a 35 percent reduction in inventory.
On the o9 Solutions platform, Kraft Heinz (7,000 SKUs) reported an 11 percent increase in monthly forecast accuracy, a 14 percent increase in weekly forecast accuracy, and a 20 percent reduction in safety stock levels. AB InBev on the same platform achieved a 60 percent reduction in out-of-stocks, a 53 percent decrease in inventory losses, and 70 to 90 percent touchless planning adoption across key markets.
For retail-operator deployment evidence, see Retail AI Demand Forecasting: Three Production Deployment Cases and What They Required.
Promotional Lift Modeling ROI
Trade spend runs 15 to 20 percent of net sales on most CPG P&Ls, making promotional efficiency one of the highest-leverage levers in the business. Independent research cited in practitioner literature indicates approximately 17 to 20 percent improvement in promotional ROI from AI-driven trade promotion models. McKinsey research also indicates that coordinated promotion and media campaigns deliver 15 to 25 percent higher incremental volume than independent execution.
The mechanism is the lift decomposition problem: if a CPG brand sold 10,000 units in a given period and 4,000 of those units were driven by a promotional event, the baseline demand was only 6,000. A model that fails to decompose this will forecast 10,000 units for the same period in the following year, leading to overstocking post-event and understocking in baseline periods.
NPI Forecasting ROI
A global eyewear company introducing 2,000 new styles annually reduced WMAPE by 10 percent and improved new launch forecasts by 30 percent using AI-powered demand clustering. An electronics wholesaler launching more than 50,000 products annually achieved 85 percent accuracy in predicting product performance and a 15 percent improvement in five-month forecast accuracy using web analytics and product attribute similarity matching.
| Sub-Use-Case | Representative Outcome | Source Context |
|---|---|---|
| Baseline ML Forecasting | 20–50% error reduction; up to 65% reduction in lost sales and unavailability | McKinsey supply chain AI research, mature implementations |
| Baseline ML Forecasting | 30% reduction in lost sales (Danone); 30% reduction in forecast errors (Nestlé) | SymphonyAI citing Danone case; SR Analytics citing Nestlé |
| Baseline ML Forecasting | 11–14% forecast accuracy improvement; 20% safety stock reduction (Kraft Heinz) | o9 Solutions, Kraft Heinz deployment, 7,000 SKUs |
| Baseline ML Forecasting | 60% stockout reduction; 53% inventory loss decrease (AB InBev) | o9 Solutions, AB InBev deployment |
| Promotional Lift Modeling | ~17–20% improvement in promotional ROI | Independent research cited in SR Analytics, April 2026 |
| NPI Forecasting | 10% WMAPE improvement; 30% NPI forecast improvement (eyewear) | ToolsGroup, global eyewear company, 2,000 new styles/year |
| NPI Forecasting | 85% product performance accuracy; 15% five-month forecast improvement (electronics) | ToolsGroup, electronics wholesaler, 50,000+ products |
Market Adoption Context
That framing comes from NVIDIA's third annual State of AI in Retail and CPG survey, published January 2026 — a vendor-commissioned survey of retail and CPG operators. Eighty-nine percent of respondents reported AI is helping to increase annual revenue. The same survey identified demand forecasting as a top supply chain AI application, with AI enabling retailers to optimize inventory at the store and customer level rather than at a regional level.
Applicable Industries and Deployment Contexts
Three distinct deployment contexts shape how AI demand forecasting is architected, what data is available, and which vendor capabilities matter most.
- CPG manufacturer-side: The manufacturer forecasts demand for its own products but typically does not have direct access to real-time store-level POS data. Forecasting is done from internal shipment data — what was shipped to retailers or distributors. This creates a structural accuracy ceiling: shipments reflect constrained demand, not actual consumer pull. Inventory availability, logistics constraints, and production capacity all distort the shipment signal relative to true consumption. AI models trained on shipment data inherit this distortion regardless of algorithm sophistication.
- Retailer-operator-side: The retailer owns POS data directly and can achieve SKU-store-day granularity. This is the highest-information-density deployment context for AI demand forecasting, and it is where the most mature production deployments exist. Retailers can run demand sensing, promotional lift modeling, and baseline forecasting from the same data infrastructure.
- Joint CPG-retailer deployments: Collaborative forecasting arrangements where the manufacturer receives retailer POS data feeds in exchange for joint planning commitments. These deployments can close the CPG data gap but require inter-company data standardization, governance agreements, and often a data connectivity intermediary layer. They represent the highest-value configuration for CPG manufacturers but also the highest setup complexity.
In terms of industry verticals, documented production deployments are concentrated in grocery and mass-market retail, food and beverage CPG, household goods CPG, and consumer electronics. Temperature-sensitive categories (beverages, dairy, fresh food) show the strongest incremental value from weather-signal integration in baseline and demand sensing models. High-SKU-velocity categories (beauty, apparel accessories) show the strongest value from NPI attribute-based forecasting given frequent new product introductions.
Adoption Maturity by Sub-Use-Case
Maturity levels reflect how widely deployed each sub-use-case is in production environments, how standardized the vendor ecosystem is, and how well-documented the ROI evidence base is. A June 2025 Gartner report found that only 23 percent of supply chain leaders had a formal supply chain AI strategy in place — which contextualizes the gap between market awareness and operational deployment maturity across all four sub-use-cases.
| Sub-Use-Case | Maturity Level | Rationale |
|---|---|---|
| Baseline ML Forecasting | Established | Broad enterprise deployment across retail and CPG; mature vendor ecosystem with multiple production-proven platforms; well-documented ROI from named companies; standard data prerequisites understood and achievable for most large enterprises |
| Demand Sensing | Growing | Deployment accelerating in retailer-operator context; real-time POS infrastructure remains a significant barrier for CPG manufacturers; vendor capabilities maturing but inter-company data access is an unsolved operational challenge for many organizations |
| Promotional Lift Modeling | Growing | High ROI potential is widely recognized; causal model complexity and the requirement for 2+ years of clean promotional history with OOS flags slow adoption; many organizations still rely on manual lift coefficients from trade teams rather than ML-derived estimates |
| NPI Forecasting (attribute-based) | Emerging | Limited production deployments at scale; methodology maturing but product attribute taxonomy requirements are not yet standardized across most CPG organizations; cannibalization modeling adds additional data complexity that few organizations have addressed operationally |
The Established rating for baseline ML forecasting reflects the reality that gradient boosting and neural network forecasting models have been in production at major retailers and CPG companies for several years. The methodological questions are largely settled; the implementation challenges are primarily organizational and data-quality-related, not algorithmic.
The Emerging rating for NPI forecasting reflects that while the attribute-based transfer learning approach is technically sound and several vendors have productized it, the organizational prerequisite — a clean, structured product attribute taxonomy — is absent in most CPG and retail environments. Without taxonomy standardization, the similarity matching that underpins NPI forecasting cannot function reliably.
Representative Vendor Landscape
The vendor landscape for AI demand forecasting in CPG and retail is not homogeneous. Different platforms are optimized for different sub-use-cases and deployment contexts. Evaluating vendors against a single undifferentiated "demand forecasting" criterion produces shortlists that mix platforms with fundamentally different strengths.
The mapping below reflects publicly available product positioning and practitioner descriptions as of Q2 2026. Vendor capabilities evolve; readers should verify current capabilities directly with vendors and cross-reference with independent analyst assessments before shortlisting.
| Vendor | Baseline ML | Demand Sensing | Promo Lift | NPI Forecasting | Primary Deployment Context |
|---|---|---|---|---|---|
| Blue Yonder | Strong | Moderate | Strong (mature promo engine) | Moderate | Retailer-operator; SKU-store-week granularity; deep retail and CPG domain expertise |
| RELEX Solutions | Strong | Strong | Strong | Moderate | Retailer-operator; SKU-store-day granularity; unified forecasting-to-replenishment platform |
| o9 Solutions | Strong | Strong (external signals via knowledge graph) | Strong | Strong (NPI planning module) | Enterprise S&OP integration; CPG manufacturer and retailer; end-to-end demand-to-supply-to-finance planning |
| Kinaxis Maestro | Strong | Moderate | Moderate | Moderate | Supply-constrained manufacturing environments; concurrent planning connecting demand with supply constraints; better fit for manufacturing than demand-driven retail |
| Crisp | Enabler (data layer) | Enabler (data layer) | Enabler (data layer) | Enabler (data layer) | CPG manufacturer data connectivity; daily POS ingestion from 60+ retailers; addresses the shipment-vs-consumption data gap as infrastructure prerequisite |
| SymphonyAI | Strong | Strong | Strong | Strong | Full retail-CPG stack; serves 30 of top 50 grocery retailers and 25 top CPG companies |
Crisp occupies a distinct position in this landscape. It is not a forecasting engine but a data connectivity platform that normalizes daily POS data from more than 60 retailers and distributors into a standardized feed that CPG manufacturers can use to train forecasting models. For CPG manufacturers currently forecasting from internal shipment data, Crisp-type platforms represent a prerequisite infrastructure investment before AI forecasting accuracy can meaningfully improve — regardless of which forecasting vendor is selected.
Key Implementation Risks and Failure Modes
The three most common failure modes in AI demand forecasting deployments are data quality contamination, planner distrust leading to systematic forecast overrides, and change management failure that leaves forecast ownership siloed in commercial teams. Model drift is an ongoing operational risk after deployment that is frequently underestimated during project scoping.
Data Quality Gaps in Training Data
Inconsistent, incomplete, or structurally biased training data is the most common root cause of AI forecasting model failure in CPG and retail. The structural CPG problem — forecasting from shipment data rather than POS consumption — is a form of systematic bias that survives into model outputs even after sophisticated feature engineering. Promotional history without out-of-stock flags is another common contamination source: a model trained on sales data that includes stockout periods will underestimate true baseline demand because it cannot distinguish between low demand and constrained supply.
Black-Box Syndrome and Planner Override Erosion
When demand planners cannot interpret why the AI model produced a specific forecast, they override it. Individual overrides may be justified. Systematic overrides — where planners routinely substitute their judgment for the model's output — erode the model's statistical value and create a feedback loop where the model is retrained on human-adjusted numbers rather than true demand signals. This is one of the most widely documented failure modes in enterprise AI forecasting deployments.
Addressing black-box syndrome requires both technical and organizational responses. On the technical side, model explainability features — showing planners which factors drove a specific forecast change — reduce resistance. On the organizational side, override tracking and governance processes are needed to distinguish informed planner corrections from reflexive distrust.
Change Management and Forecast Ownership Silos
In many CPG organizations, commercial and sales teams own the demand forecast because it is tied to trade promotion planning and volume commitments. AI forecasting programs that do not explicitly address this ownership structure fail to achieve touchless or near-touchless operation. The AI model produces one number; the commercial team produces another; the supply chain team arbitrates between them. The result is a process that is more complex than the statistical model it replaced, not less.
Successful deployments establish shared forecast ownership across supply chain, commercial, and finance functions before go-live, not as a post-deployment aspiration. This is an organizational design decision, not a technology configuration.
Model Drift After Deployment
AI forecasting models are trained on historical patterns. When market structure changes — new competitors, channel shifts, macroeconomic inflection points, or demand pattern disruptions — the model's learned relationships degrade. Model drift is not a deployment failure; it is an operational reality that requires ongoing monitoring, retraining cadences, and human review processes. Organizations that treat AI forecasting as a one-time implementation rather than an ongoing operational system consistently underperform on post-deployment accuracy metrics.
- Data quality contamination: shipment-based training data, missing OOS flags, incomplete promotional history
- Black-box syndrome: planner override loops that erode model performance and corrupt retraining data
- Forecast ownership silos: commercial teams maintaining parallel forecasts that override AI outputs without governance
- Model drift: degradation of learned demand patterns following market structure changes or external shocks
- Overfitting: complex models that perform well on training data but fail to generalize to real-world demand variation
Data Prerequisites by Sub-Use-Case
Data readiness assessment is the most reliable predictor of AI demand forecasting deployment success. The checklist below identifies minimum viable data requirements for each sub-use-case. It is a readiness assessment tool — not a vendor requirement specification — intended to help organizations determine which sub-use-cases they can pursue now versus which require data infrastructure investment first.
| Sub-Use-Case | Minimum Viable Data Requirements | Common Gaps in CPG/Retail Organizations |
|---|---|---|
| Baseline ML Forecasting | 18+ months of POS or shipment data by SKU and retailer; promotional calendar with pricing and timing; product hierarchy; weather data for temperature-sensitive categories | Shipment data available but POS data absent for CPG manufacturers; promotional calendar exists but lacks timing precision or pricing detail; product hierarchy inconsistent across ERP and planning systems |
| Demand Sensing | Real-time retailer POS feed (daily or intraday); event and weather signals; current inventory position data | Live POS feed absent for most CPG manufacturers; retailer data sharing agreements not in place; event signal integration not operationalized |
| Promotional Lift Modeling | 2+ years of promotional history with lift coefficients and out-of-stock flags; media spend data by campaign; price elasticity baseline | Promotional history exists but OOS flags missing, making lift decomposition unreliable; media spend data siloed in marketing systems not connected to supply chain planning |
| NPI Forecasting | Structured product attribute taxonomy (price, category, material, weight, packaging format); comparable product sales profiles for similarity matching; cannibalization model inputs | Product attribute data exists in product development systems but is not structured or standardized for ML similarity matching; no formal process for identifying comparable products |
The practical sequencing implication: most CPG manufacturers and retailers have sufficient data to begin with baseline ML forecasting if they have 18 or more months of consistent historical data and a promotional calendar. Demand sensing, promotional lift modeling, and NPI forecasting each require data infrastructure investments — POS connectivity, OOS-flagged promotional history, and product attribute taxonomy respectively — that are often multi-quarter projects in their own right. Planning for these prerequisites in parallel with vendor evaluation, rather than after platform selection, is the most common structural improvement available to organizations at the stakeholder-validation stage.
Comments
Join the discussion with an anonymous comment.