
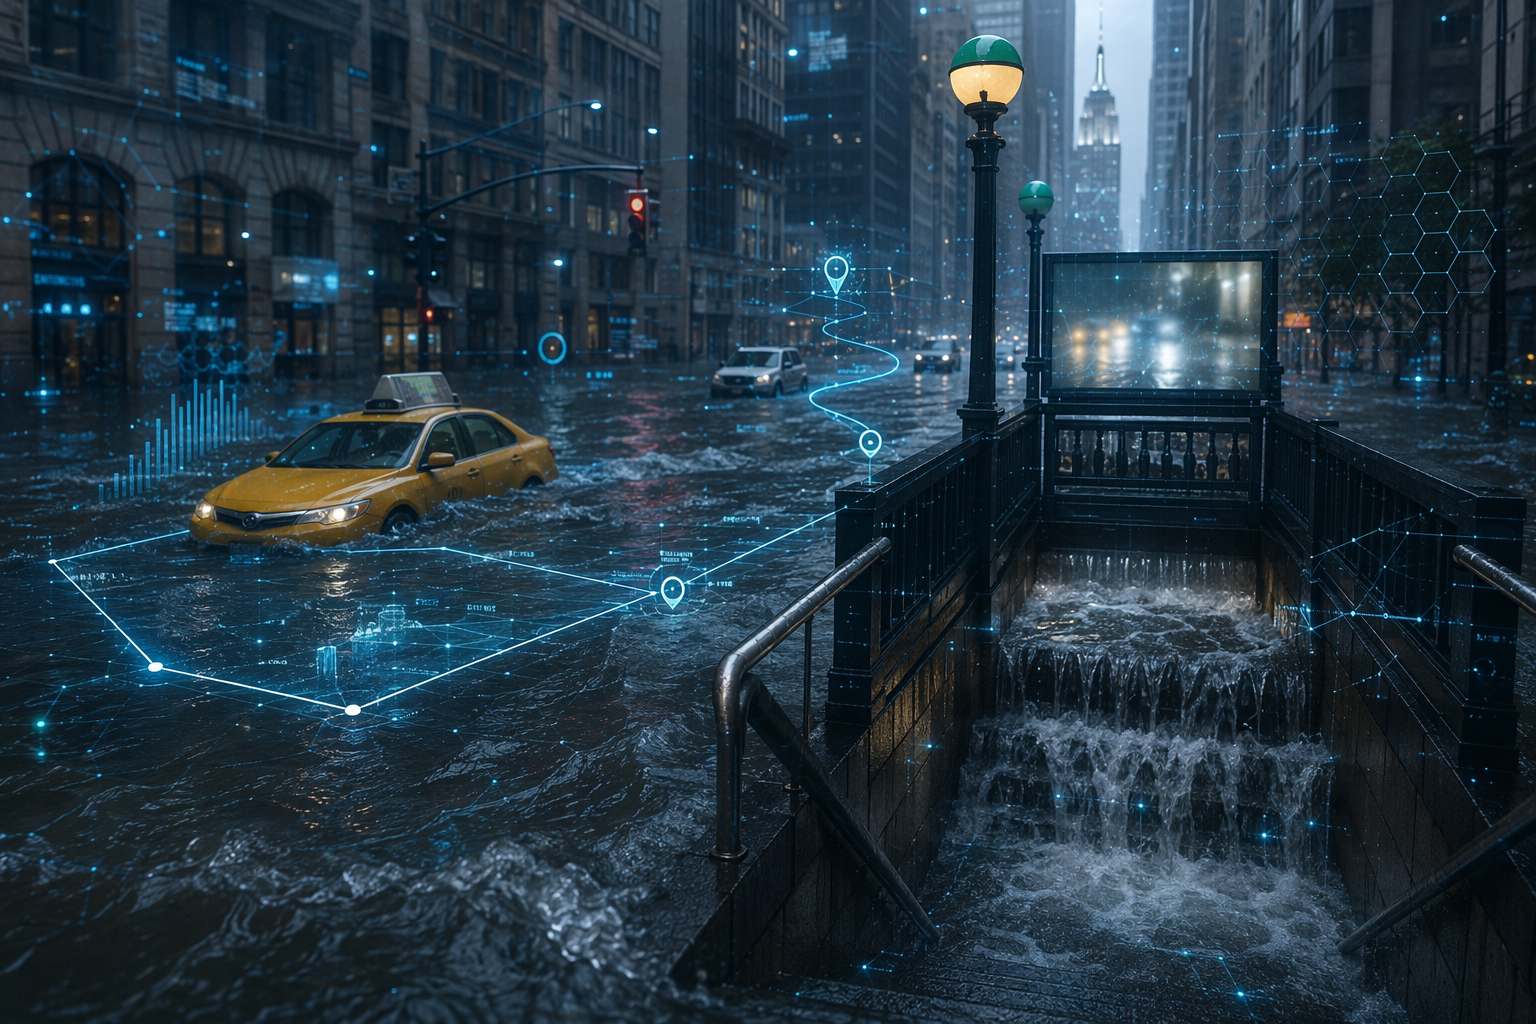
The July 2025 NYC/NJ flash flood did not look like a planning abstraction from the dispatch side. Subway service was suspended, airport cargo flows were tangled with passenger aviation delays, and freight that normally depends on a tight sequence of tunnel access, bridge crossings, dock windows, and last-mile territories had to wait for the city to become usable again. Previsico’s post-event analysis documented the flood timing and intensity, while AMB Logistic reported 1,200 to 2,000 delayed or canceled flights across LaGuardia, JFK, and Newark, 18 to 36 hours of freight reroute delays, and a 40% drop in last-mile delivery attempts during the disruption window.[1][2]
That is the operating case for AI planning around NYC flash-flood supply chain disruption: not whether an algorithm can stop water from entering a subway stairwell, but whether a planning team can know early enough which nodes are about to lose capacity, which routes will become bad bets, which carrier commitments should be pulled forward or reassigned, and which inventory should move before the phone tree starts.
The disruption is spatial before it is procedural
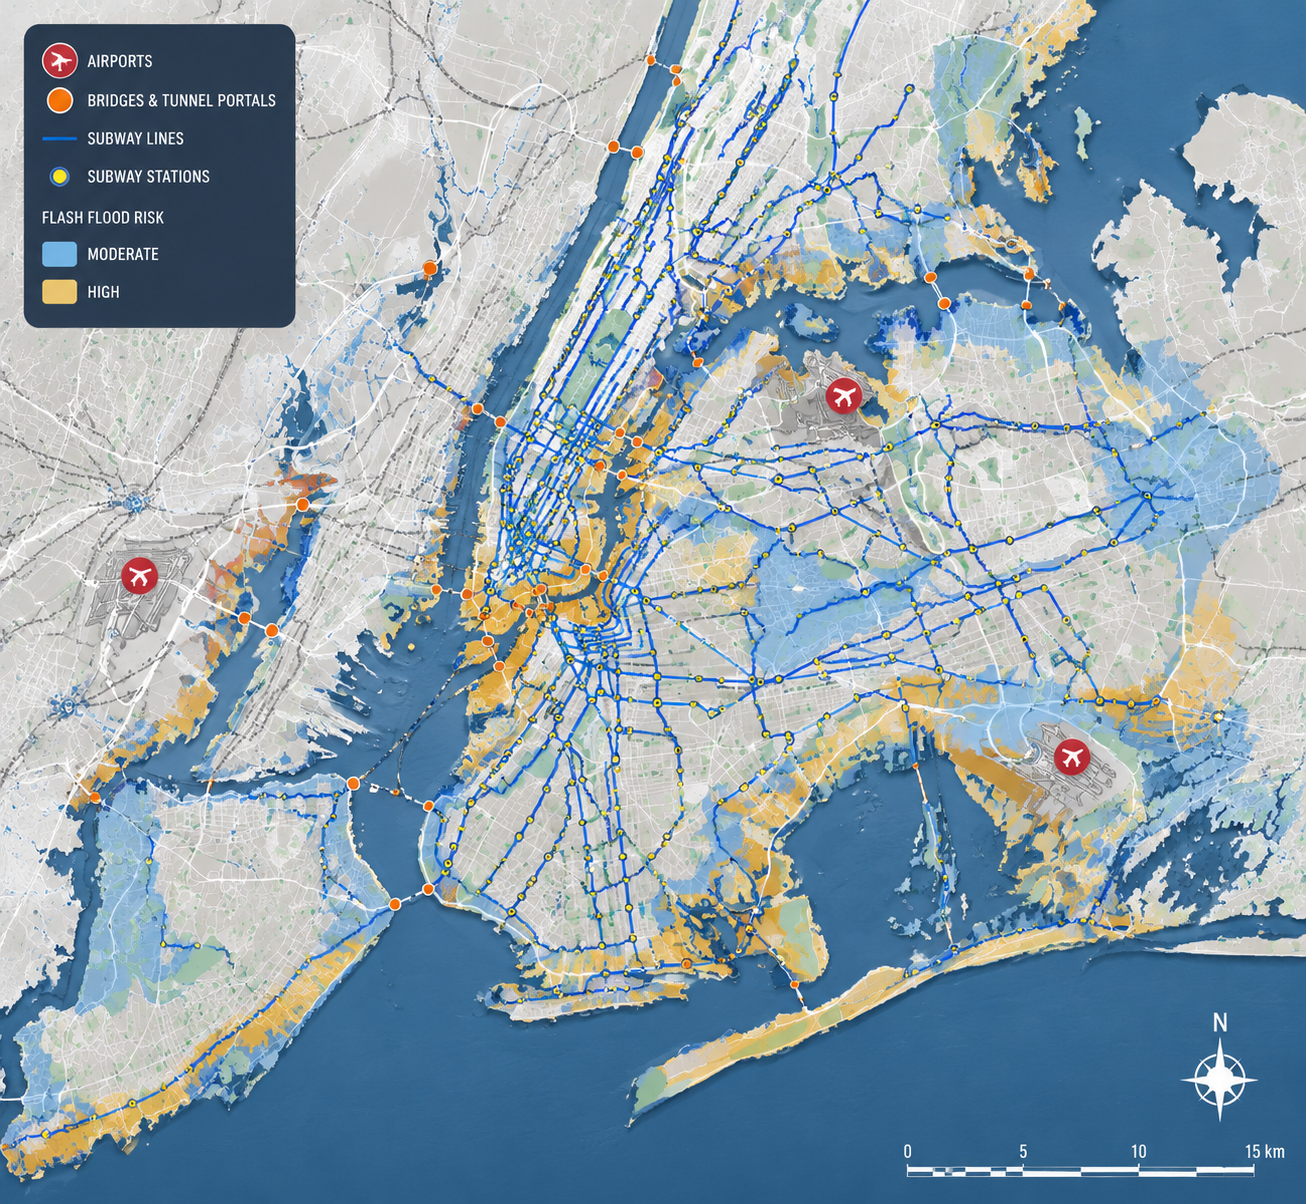
“Reroute” sounds reasonable until the alternative route is another constrained crossing, another flood-prone approach road, another late dock appointment, or another carrier whose available capacity is already being consumed by the same storm. In the NYC metro region, the map gives planners very little slack. The city’s hazard mitigation documentation says 267 miles of major roads, or 16% of the total, sit in the 100-year floodplain. It also identifies two airports, representing 100% of the city’s airports; 87 bridges and tunnels, or 98%; and 45 subway stations in that same floodplain.[3]
Those are not background facts for an urban-planning appendix. They are planning variables. If a distribution plan depends on an airport tender cutoff, a cross-harbor move, a tunnel approach, a subway-dependent labor pool, or a dense last-mile route in Queens, Brooklyn, Lower Manhattan, or the New Jersey waterfront, flood exposure is already inside the service promise.
The recurrence argument is just as important as the severity argument. The New York City Panel on Climate Change projects 4% to 11% more precipitation by the 2050s, while the city’s sewer system is designed for a maximum of 1.75 inches per hour.[3] With 72% impervious surface, heavy rain turns quickly into a surface-routing problem: water moves across streets, underpasses, loading areas, rail access points, and station entrances before a logistics team can treat the event as a normal weather delay.[3]
What the flood actually breaks in a supply chain plan
A flash flood breaks the plan in layers. First, it removes route reliability. Then it removes timing confidence. Then it removes the ability to explain, in dollars and service levels, why one customer lane, SKU group, or carrier allocation should be protected ahead of another.
| Planning variable | What changes during a NYC flash flood | Decision that has to move earlier |
|---|---|---|
| Route availability | Flooded corridors, tunnel approaches, bridge access roads, and last-mile territories become unreliable at different times. | Geofence exposed lanes and release alternate route instructions before drivers are already committed. |
| Carrier capacity | The same carriers face airport delays, blocked roads, and revised appointment windows across multiple customers. | Reassign capacity to the shipments where lateness has the highest contractual or customer impact. |
| Inventory position | Stock held on the wrong side of a flooded corridor may be available in the system but unusable in practice. | Pre-position critical inventory near demand before flood exposure turns into access loss. |
| Facility operations | Warehouses, cross-docks, and supplier sites may remain open but lose inbound or outbound practicality. | Separate facility status from network usability and adjust order promises accordingly. |
| Service-level exposure | Some missed deliveries are recoverable the next day; others cascade into penalties, spoilage, stockouts, or production holds. | Rank mitigation by consequence rather than by first-in, first-out escalation. |
The failure mode is not that planners lack a weather alert. It is that a weather alert does not automatically become a carrier instruction, an inventory move, a customer-priority decision, or a finance-ready explanation of why the team spent money before the water arrived.
The warning-to-action gap is already documented
The September 2023 storm showed how much can go wrong between formal awareness and useful action. The event brought 8.65 inches of rain and was described in the NYC Comptroller’s review as a once-in-100-year storm. The same investigation found that the city activated its Flood Emergency Plan 24 hours ahead, yet only 2.7% of New Yorkers received alerts.[4]
That alert-reach figure matters to supply chains even if a private logistics operation is not waiting for a public notification system. It shows the practical gap: a plan can exist, a warning can exist, and still the people and assets exposed to the event may not receive a specific enough instruction early enough to change behavior.
The infrastructure backlog compounds the same problem. The Comptroller’s office found 61% of stormwater infrastructure projects delayed and 69% over budget, with average overruns of 310%.[4] A supply chain leader cannot assume the physical city will become easier to operate through fast enough to make static contingency binders adequate.
Where AI planning tools change the move
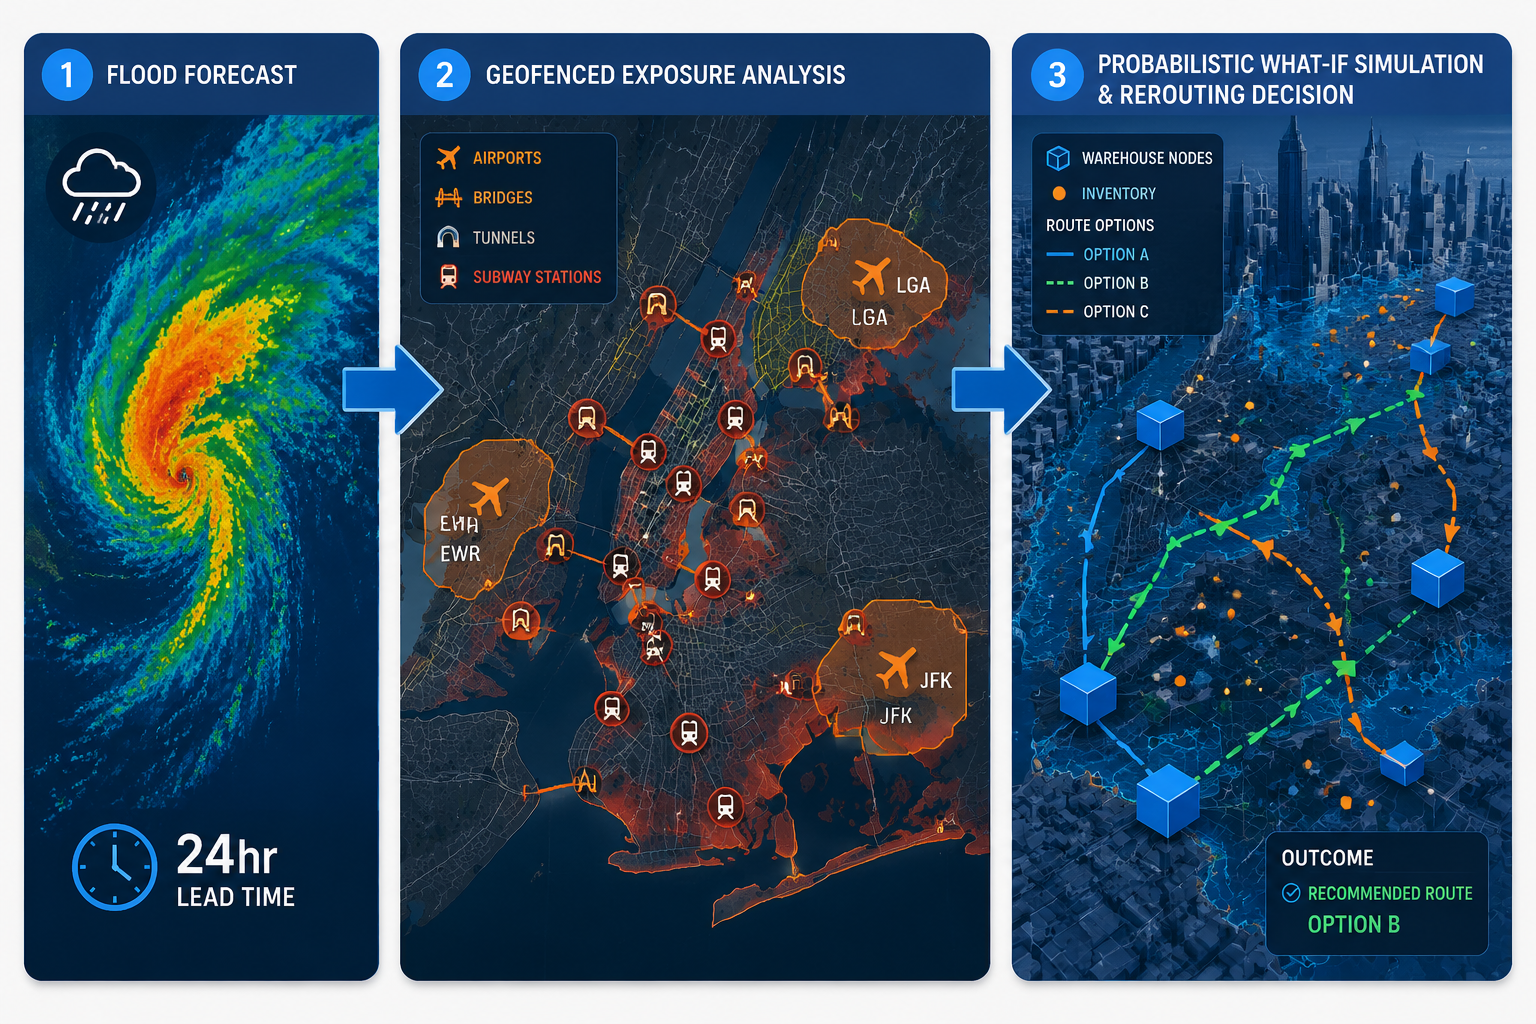
The useful AI stack is not one magic forecast. It is a chain from lead time to exposure mapping to tradeoff simulation. The forecast says where flood risk is rising. The geofence tells which operating assets sit inside or near that risk. The scenario model tests what happens if capacity, route access, or inventory availability changes by the hour.
Lead time: forecast before the dispatch board is locked
Google Research announced an urban flash flood forecasting model in March 2026 that can predict urban flash floods up to 24 hours in advance using LSTM-based models, with precision comparable to National Weather Service warnings. Google also stated that even 12 hours of lead time can reduce flood damage by up to 60%.[5]
For a supply chain team, the value of that lead time is not academic. Twelve to 24 hours can cover a dock schedule reset, a linehaul tender change, an earlier replenishment release, or a temporary hold on sending drivers into territories likely to lose access. The caveat is important: Google’s capability was announced in 2026, and the cited material does not establish that it is already embedded as a deployed workflow in commercial supply chain platforms. The planning case rests on what the capability can enable when connected to logistics systems, not on a documented NYC supply chain deployment.
Exposure: turn a storm zone into an asset list
Once a forecast exists, the next question is not “Is the city at risk?” It is “Which parts of our network are inside the risk boundary?” Everstream Analytics describes scenario-planning tools that let teams geofence a storm zone, identify supplier facilities, ports, and warehouses that may be affected, and simulate mitigation responses before disruption occurs.[6]
That geofence layer is where a general flood warning becomes an operating queue. A planner can pull a list of exposed nodes, rank them by customer promise or SKU criticality, and decide which shipments should be accelerated, which should be held, and which customer commitments need a revised ETA before the driver is already sitting at a blocked approach.
Everstream’s 2025 Annual Risk Report, cited by SupplyChainBrain, identified flooding as the top supply chain risk, accounting for 70% of weather-related disruptions, and counted 123 flood events in the United States in 2024.[7] Because the original report sits behind registration and the article is a secondary account, those figures should be treated as useful directional evidence rather than a fully transparent independent dataset.
Simulation: test the tradeoff before finance asks for proof
The harder question is not whether an exposed warehouse exists. It is whether the company should spend money to move inventory, split loads, pay a premium carrier, or accept a late delivery on a lower-value lane. C3.ai describes supply chain digital twin capabilities that model disruption scenarios probabilistically across millions of SKUs and thousands of supplier nodes, moving beyond rules-based what-if simulation.[8]
In a NYC flood scenario, that kind of model is useful because the same physical event has different consequences by product and node. A missed apparel delivery may be inconvenient. A missed medical shipment, temperature-sensitive order, production input, or high-penalty retail replenishment window may justify earlier intervention. The model does not need to be perfect to be useful; it needs to make the tradeoff visible soon enough that the team is not just defending yesterday’s route plan.
A practical workflow for a flood-prone NYC network
The workflow is straightforward when stripped of vendor language. It starts with flood lead time, narrows into exposed assets, and ends with ranked operating moves.
- Ingest an urban flash flood signal with enough lead time to act before carrier and dock plans are fixed.
- Overlay the likely flood zone against facilities, supplier nodes, airport dependencies, tunnel or bridge approaches, delivery territories, and inventory positions.
- Separate assets that are physically exposed from assets that are operationally exposed because access routes, labor flows, or carrier capacity are constrained.
- Simulate mitigation options: pre-position inventory, shift carrier capacity, resequence deliveries, change customer promise dates, or hold shipments outside the zone.
- Choose the move that protects the highest-value service commitments at an acceptable cost, then document the decision before the disruption becomes a blame exercise.
This is also where AI planning connects to broader resilience practice without becoming a generic transformation project. A flood plan has preparedness, response, and recovery work inside it; teams that need the wider frame can compare it with how AI maps to supply chain disaster preparedness phases. The same planning discipline also appears in non-weather disruptions, including AI supply chain resilience planning for geopolitical escalation and AI supply chain disruption planning in energy companies, where digital twins and scenario models are used against different physical constraints.
Why static playbooks underperform in this use case
Static contingency plans are usually written around categories: alternate carrier, alternate route, backup facility, customer notification. Those categories are necessary, but they do not resolve timing. They do not say whether a specific Queens delivery territory should be cut off at 2 p.m., whether inventory should move from a New Jersey node before a tunnel approach deteriorates, or whether a premium carrier is cheaper than a missed retail appointment.
Conventional weather alerts have the opposite problem. They may be timely, but they are not automatically network-aware. A storm warning does not know the SKU margin, the dock appointment, the carrier tender status, the customer penalty, or the fact that a warehouse outside the floodplain can still become unusable because the access path is compromised.
AI planning tools earn their place when they connect those two worlds: live hazard signals and the company’s operating graph. The planner still decides. The tool shortens the distance between “rain is coming” and “these shipments, these facilities, these routes, and these inventory positions need a different plan by this cutoff.”
The ROI case is strongest where exposure is repeated
The business case should not depend on one dramatic flood clip. It should depend on repeated exposure plus measurable consequences. NYC-focused supply chains have both: increasing precipitation risk, dense impervious surfaces, floodplain exposure around transport infrastructure, airport dependence, and last-mile territories where a single blocked underpass can erase the margin in a route plan.
The largest cost number belongs here, with the right caution attached. FEMA’s HAZUS-MH model, applied to NYC Flood Insurance Rate Map data, estimates that a 1% annual chance flood affecting all five boroughs could cause more than $30 billion in capital stock and income losses, with contents damage alone exceeding $16 billion.[3] That is a modeled loss scenario, not an actual July 2025 loss figure and not a forecast of what any one company will face.
Even with that caveat, the investment logic is hard to dismiss for networks with exposed metro nodes, time-sensitive delivery commitments, airport or tunnel dependence, or inventory that can be repositioned ahead of a storm. The ROI does not come from claiming that AI prevents a flood. It comes from fewer late decisions, fewer blind reroutes, better carrier allocation, earlier inventory moves, and a defensible record of why the operating team chose one tradeoff over another.
The vendor evidence is still uneven. Previsico is a commercial flood forecasting company, AMB Logistic’s disruption figures come from a single freight brokerage blog post, Everstream’s risk-report numbers are not fully open in the cited materials, and Google’s 2026 urban flash flood AI is not established here as a deployed supply chain workflow. Those limits do not erase the use case. They define the buying standard: favor tools that can show how a forecast becomes a node-level exposure list, how that exposure list becomes ranked mitigation options, and how those options are reviewed before the next storm reaches the dock schedule.
References
- Post Event Analysis of New York Flooding, Previsico.
- Drenched Routes, Delayed Freight: How Widespread U.S. Flooding Is Testing the Backbone of American Logistics, AMB Logistic.
- Flooding, NYC Hazard Mitigation Plan.
- Is New York City Ready for Rain?, Office of the New York City Comptroller.
- Protecting cities with AI-driven flash flood forecasting, Google Research, March 2026.
- Scenario Planning for Supply Chain Risk Management, Everstream Analytics.
- Report: Floods Pose Top Threat to Supply Chains in 2025, SupplyChainBrain.
- The Power of AI in Supply Chain Management for Increased Resilience and Growth, C3 AI.
Comments
Join the discussion with an anonymous comment.