
The payback case for warehouse slotting optimization AI starts with an unglamorous baseline: in many warehouses, pickers spend more of the shift walking than picking. Logiwa states that pickers spend 60–70% of their shift walking, and Optioryx cites a similar operating reality, with pickers walking 10–15 miles per day in many facilities.[1][2] If that is true inside a specific operation, slotting is no longer a layout-cleanup project. It is a labor-cost intervention aimed at the largest avoidable motion pool in the building.
That is why the financial question is not whether AI sounds more advanced than ABC slotting. The question is whether the warehouse has enough movement, SKU change, order variability, and labor cost tied up in travel for dynamic slotting to change the cost curve.
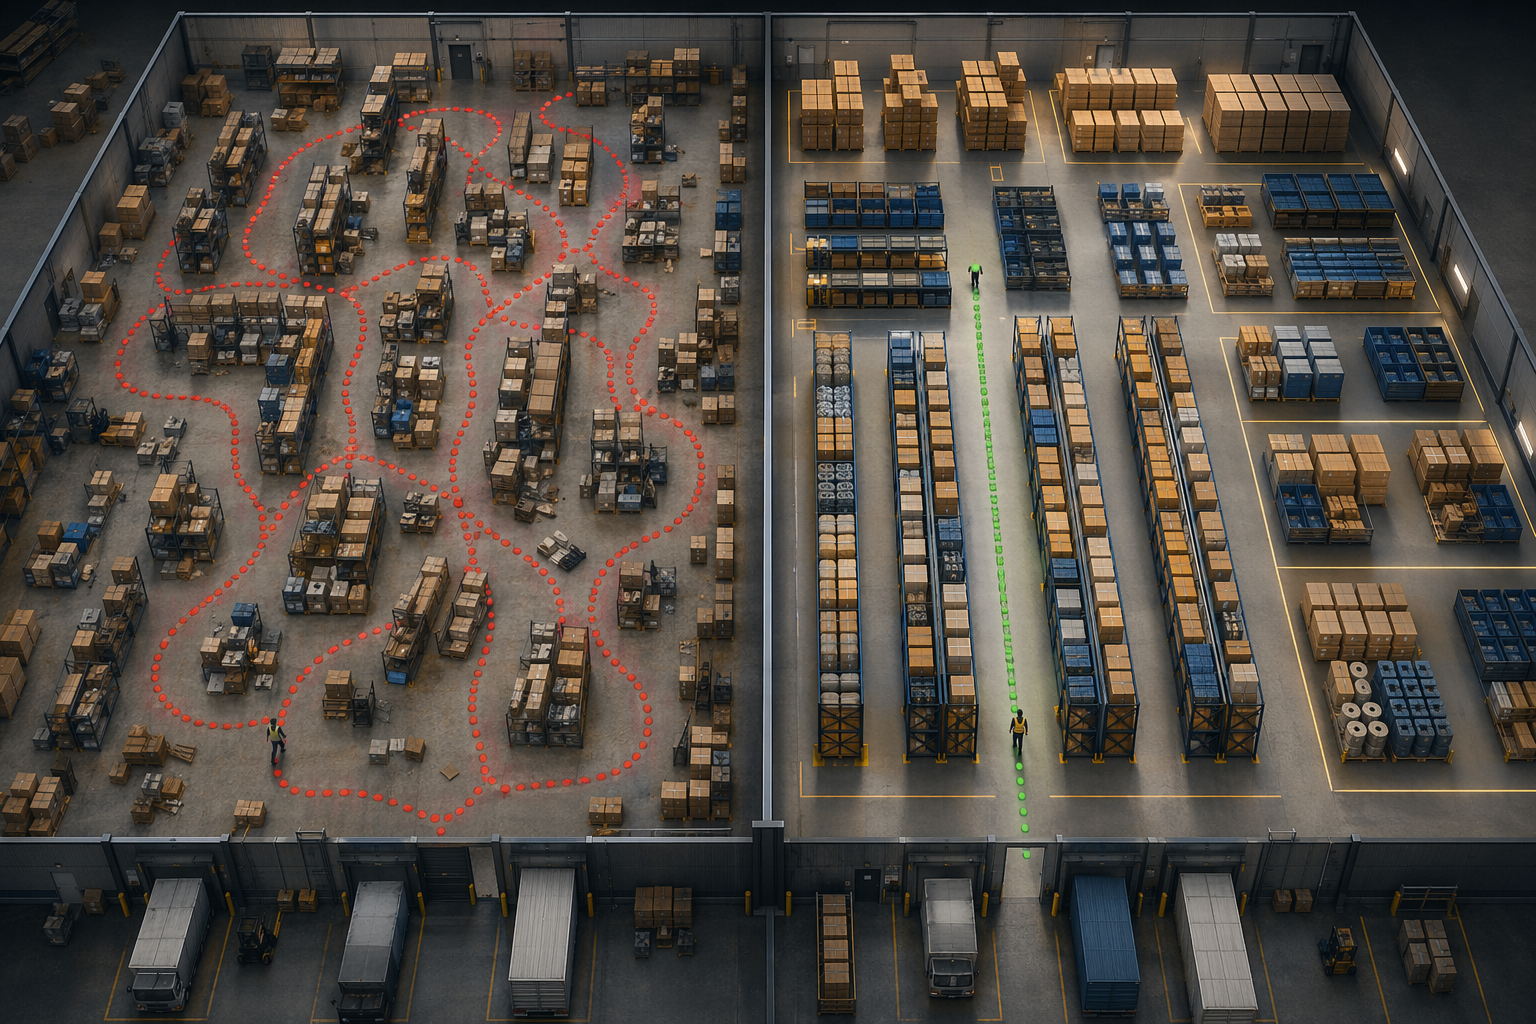
The Benchmark Range Is Useful, But It Is Not a Guarantee
Across the available vendor-published material, the outcome bands are reasonably consistent. Lucas Systems reports 10–20% labor savings, 1–5% accuracy gains, and 20–40% throughput increases from dynamic slotting opportunities.[3] JASCI reports 20–40% travel reduction, 15–25% productivity improvement, and up to 90% less consolidation work.[4] Kenco’s SLOT DC case study reports $247,000 in annual savings, a 27% travel reduction, and a 20% efficiency boost.[5] Optioryx reports 20–50% travel cuts and 10–30% fill-rate improvement for its Pulse slotting optimization software.[2]
| Metric | Representative sourced range or case result | How to read it in a business case |
|---|---|---|
| Labor cost savings | 10–20% reported by Lucas Systems | Most relevant where walking and search time consume a large share of paid picking labor |
| Travel reduction | 20–40% reported by JASCI; 27% in Kenco SLOT DC case | The cleanest bridge from floor movement to labor-hour savings |
| Productivity or throughput improvement | 15–25% reported by JASCI; 20–40% throughput increase reported by Lucas Systems | Useful when the constraint is order volume, cut-off times, or peak staffing |
| Consolidation work | Up to 90% less consolidation reported by JASCI | Most relevant in operations where bad slotting creates downstream sorting, staging, or rework |
| Combined walk-time reduction | 35–60% reported by Optioryx when slotting is combined with route optimization | A higher-return scope than slotting alone, but only if both placement and path execution change |
Those figures are strong enough to justify serious evaluation. They are not strong enough to skip validation. The sources are vendor blogs, product pages, and case studies rather than independent audits. The better interpretation is that several vendors are seeing similar representative ranges in commercially relevant settings, not that every warehouse should expect the same result.
How Travel Reduction Turns Into Payback
A defensible ROI model should begin with labor hours, not software features. If pickers are paid for an eight-hour shift and most non-value-added time is walking, then slotting creates value by moving fast movers closer to the right pick faces, reducing aisle changes, cutting replenishment conflicts, and lowering the number of touches required before an order leaves the building.
The first conversion is travel time to labor capacity. A 20–40% travel reduction does not automatically mean a 20–40% labor-cost reduction, because walking is only one part of the shift. But if walking represents the majority of pick time, even a partial reduction can release meaningful capacity. That capacity can appear as fewer overtime hours, fewer temporary workers during peak periods, more orders processed with the same team, or a smaller gap between planned and actual ship times.
The second conversion is throughput. A warehouse that cannot add people easily may not reduce headcount after slotting improves. It may instead absorb volume growth, protect shipping cutoffs, or delay a facility expansion. That is still a financial return, but it belongs in a different row of the business case than direct labor savings.
The third conversion is avoided re-slotting work. Vendor-published benchmarks indicate that most operations see measurable improvement within days of activation, that 200%+ ROI within 12 months is typical for mid-size warehouses, and that re-slotting projects can drop from quarterly or annual efforts to zero. Those are useful planning assumptions, but they should be treated as representative vendor-sourced benchmarks rather than audited payback guarantees.
A Simple Business-Case Structure
The cleanest model uses the warehouse’s own operating data. Start with current pick labor hours, average fully loaded labor cost, order lines per day, travel time or distance if measured, and the labor spent on consolidation, rework, or periodic re-slotting. Then apply conservative, middle, and aggressive scenarios using the sourced ranges only where the warehouse profile resembles the source claim.
- Direct labor scenario: apply a cautious share of the 10–20% labor-savings range to pick labor that is actually affected by slotting.
- Travel scenario: model the effect of a 20–40% travel reduction on lines picked per labor hour, not on total warehouse payroll.
- Throughput scenario: value the additional daily or weekly order capacity if the operation is constrained by labor availability or shipping cutoffs.
- Rework scenario: include consolidation labor only if poor slotting currently creates measurable sorting, staging, or exception handling.
- Implementation scenario: include software fees, integration work, location relabeling, item moves, supervisor time, and any temporary productivity dip during the changeover.
This is where many ROI decks get too neat. If the operation will not reduce labor hours, the model should not book direct labor savings. If the benefit is faster cut-off compliance, use throughput or service-level value. If the benefit is less seasonal overtime, isolate peak-period cost. Slotting can create all of those outcomes, but they should not be counted twice.
The Kenco Case Shows What a Legible Return Looks Like
Kenco’s SLOT DC case is useful because the result is expressed in operational units before it becomes a savings number: $247,000 in annual savings, driven by a 27% travel reduction and a 20% efficiency boost.[5] That is the kind of evidence a finance reviewer can work with. The savings are not floating above the floor; they are tied to fewer steps, better picking efficiency, and a specific annualized value.
It is still one case. It should not be copied into a different facility without testing the fit. A warehouse with the same square footage but lower SKU complexity, more stable demand, or already tight slotting discipline may have less available waste to remove. A warehouse with the same SKU count but worse location discipline may have more.
Why Slotting Plus Route Optimization Can Raise the Ceiling
Slotting decides where items should live. Route optimization decides how pickers should move through the work that remains. Treating those as separate projects can leave money on the floor.
Optioryx reports that combining slotting with pick route optimization can produce 35–60% total walk-time reduction.[2] That range is materially higher than the slotting-only travel-reduction bands cited elsewhere, but the distinction matters. It is not a claim that slotting alone removes 60% of walking. It is a combined-scope result, where the system improves both product placement and picker pathing.
For a budget owner, the combined case is attractive when travel is a clear constraint and the WMS or execution layer can actually send optimized work sequences to the floor. If supervisors still release work in batches that force backtracking, or if pickers override routes because locations are unreliable, the mathematical route plan may not survive contact with the shift.
Readers comparing slotting against other warehouse AI investments may find a broader prioritization view in AI for Warehouse Management: A Use-Case Library for Investment Evaluation. For teams deciding whether machine learning is necessary or whether rules-based WMS logic is enough, the more relevant comparison is machine learning versus traditional warehouse management.
The Warehouses Where AI Slotting Has the Strongest Case
The strongest ROI case usually appears where manual slotting cannot keep up with change. High SKU count, seasonal demand shifts, SKU proliferation, frequent promotions, and multi-client operations all create conditions where last quarter’s slotting plan becomes stale before the next review cycle.
| Warehouse profile | AI slotting ROI outlook | Reason |
|---|---|---|
| High SKU count with frequent demand changes | Strong | Dynamic slotting can react faster than quarterly or annual manual reviews |
| Seasonal or promotional demand | Strong | Fast movers change, so yesterday’s optimal locations become today’s travel waste |
| Multi-client 3PL environment | Strong | Client mix, order profiles, and SKU velocity can shift often enough to justify continuous optimization |
| SKU proliferation with limited pick-face capacity | Strong | The cost of poor placement rises when too many items compete for the best locations |
| Stable operation under 2,000 SKUs | Often moderate or weak | Periodic manual ABC analysis may be adequate if demand is predictable and travel waste is already controlled |
The under-2,000-SKU exception is important. A smaller, stable warehouse can still benefit from better slotting, but it may not need AI to get there. If the SKU base changes slowly, the order profile is predictable, and supervisors already maintain reasonable ABC placement, the incremental return from dynamic optimization may not clear the cost of software, integration, and operational change.
That does not make AI slotting a bad product category. It means the buyer should not use a high-complexity warehouse’s savings curve to justify a low-complexity facility’s investment.
Data Readiness Decides Whether the Model Has Something to Optimize
AI slotting needs more than a SKU master. It needs trustworthy movement history, order-line patterns, location attributes, replenishment constraints, velocity changes, and enough operational discipline that recommended moves will be executed and maintained. Bad data does not become strategic because a model reads it.
The practical test is simple: can the team explain which SKUs drive the most travel today, where congestion appears during peak windows, which locations cause replenishment conflicts, and how often demand shifts enough to make current slotting stale? If those answers require three spreadsheet extracts and a supervisor’s memory, the pilot should include data cleanup time.
This is also where integration scope matters. Slotting recommendations that stay in a dashboard do not save labor by themselves. Someone has to approve moves, sequence moves, update locations, communicate changes, and make sure pickers and replenishment teams are working from the same truth.
A Pilot Should Prove Movement, Not Impress the Steering Committee
A contained pilot on the top 500 SKUs is a sensible way to test the business case without shutting down the operation. This low-risk model can prove or disprove the case in under two weeks. The point is not to simulate a perfect future-state warehouse. It is to see whether the highest-impact items can be placed better and whether that change shows up in travel, labor, throughput, or rework.
- Define the test population: the top 500 SKUs by order-line activity, pick frequency, or travel contribution.
- Freeze the baseline: current travel distance or time, lines per labor hour, replenishment touches, consolidation labor, and exceptions.
- Apply the recommendations: move only the SKUs and locations included in the pilot, with clear ownership for execution.
- Measure the same metrics after activation: do not switch from distance to productivity mid-test because one looks better.
- Separate adoption from effect: confirm that workers actually used the new locations and routes before judging the algorithm.
A failed pilot can still be useful. It may show that the warehouse lacks enough SKU volatility, that location data is unreliable, or that the larger savings opportunity is route execution rather than slotting. Those are cheaper lessons before a full rollout.
Market Growth Is Context, Not Proof of ROI
Dataintelo valued the global warehouse slotting optimization AI market at $1.42 billion in 2024 and projected it to reach $10.56 billion by 2033, implying a 23.6% CAGR.[6] That is useful context: vendors and buyers are putting more attention into the category. It is not proof that a specific warehouse will earn back its investment.
Market forecasts describe category momentum. Payback depends on the facility’s current walking cost, SKU complexity, demand volatility, labor rate, execution discipline, and implementation cost. Those are local variables, and they decide whether the project pays back in months or becomes another optimization tool that never quite changes the floor.
The Practical Payback Answer
AI warehouse slotting is financially defensible when the operation has enough movement complexity for dynamic optimization to matter. The representative evidence points to 10–20% labor savings, 20–40% travel reduction, 15–25% productivity improvement, and stronger walk-time reductions when slotting is paired with route optimization.[2][3][4] The Kenco case shows that the savings can be operationally concrete, not just theoretical, when travel reduction and efficiency improvement are tied to a measured annual value.[5]
The investment is easiest to defend in high-SKU, volatile, seasonal, promotional, or multi-client environments. It is harder to defend in smaller, stable warehouses where periodic manual ABC analysis already controls most travel waste. For advanced operations considering slotting alongside automation, AI slotting combined with AMRs and put-to-light is a separate scope with a different implementation burden.
The responsible business case uses the warehouse’s own SKU, order, labor, and travel data; applies vendor benchmarks as ranges rather than promises; and validates the result through a contained pilot before full rollout.
References
- The quickest path to profit: AI-driven warehouse slotting optimization, Logiwa
- AI Slotting Optimization Software | Pulse by Optioryx, Optioryx
- Fast Start Opportunities for AI Series – Dynamic Slotting, Lucas Systems
- Dynamic Slotting in Warehouse Management: How AI Optimizes Warehouse Layouts, JASCI
- SLOT DC Case Study: Optimize Warehouse Slotting with AI, Kenco
- Warehouse Slotting Optimization AI Market Research Report 2033, Dataintelo
Comments
Join the discussion with an anonymous comment.