For AI route planning, the first ROI question is not whether the software can produce a better route. It usually can. The harder question is whether the savings are large enough, fast enough, and operationally real enough for the size of fleet you run. A 12-van distributor, a 75-truck regional carrier, and a 55,000-vehicle parcel network should not be judged against the same payback story.
| Fleet size | Realistic ROI pattern | Savings benchmark to model | Payback window to test | What can distort the case |
|---|---|---|---|---|
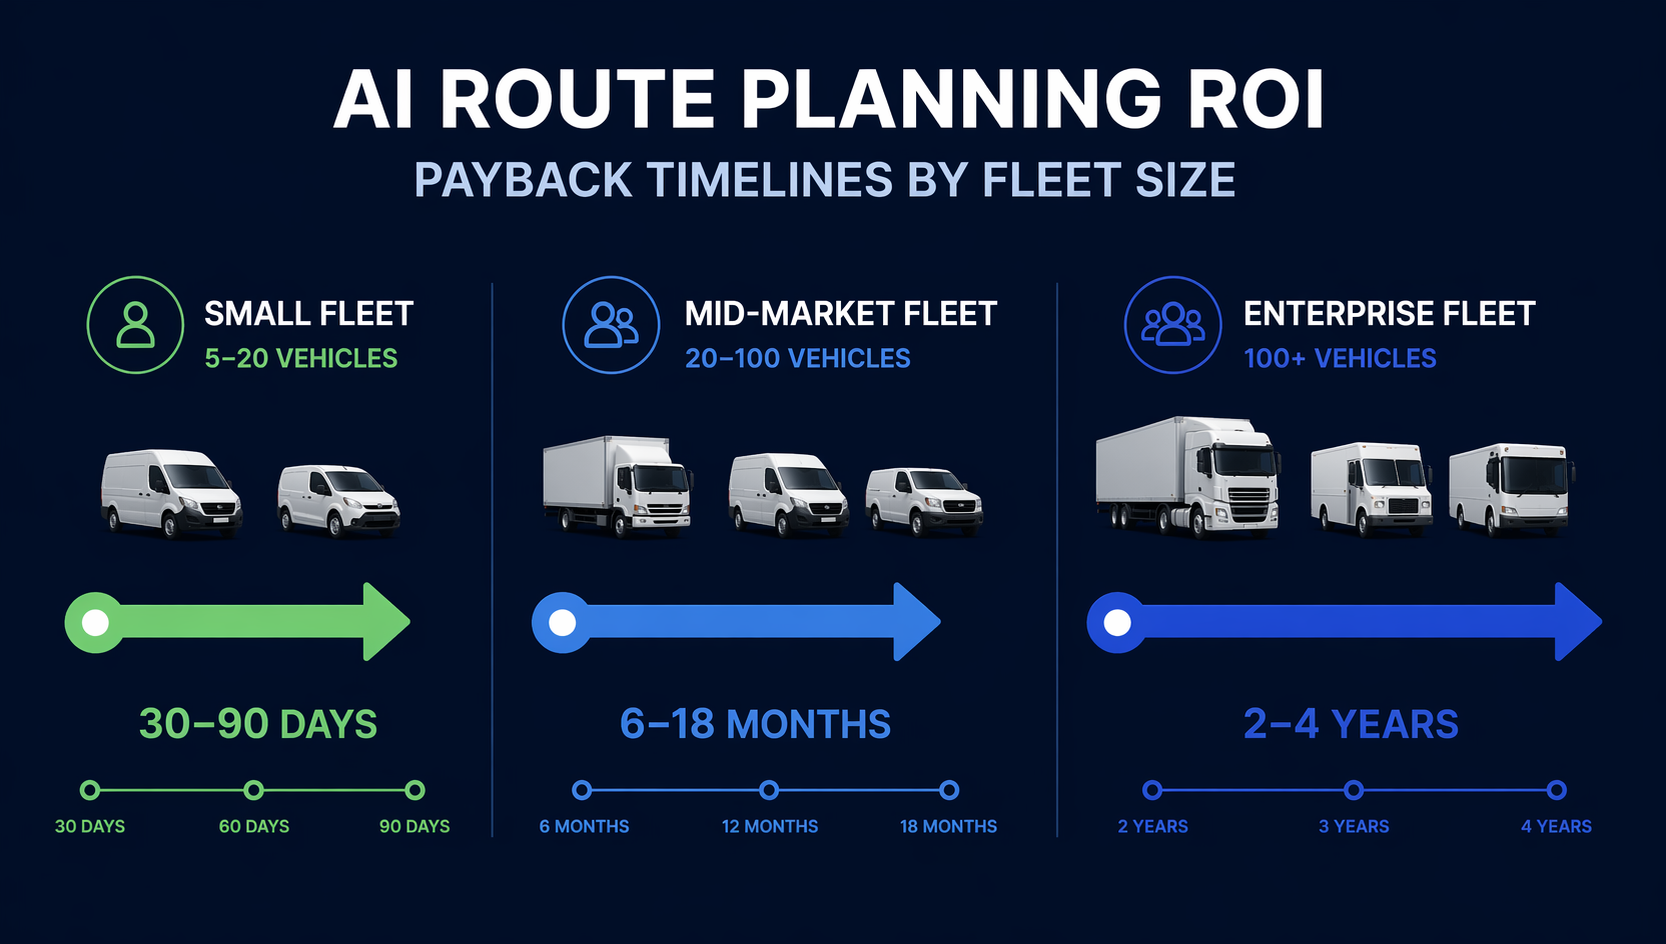
| Small fleet: 5–20 vehicles | Often higher percentage ROI because one inefficient route, failed delivery, or dispatcher workaround has a visible margin impact | 10–20% fuel savings and 15–25% transportation cost reduction; a 20-vehicle fleet can model roughly $30,000–$50,000 in annual fuel savings as a benchmark, not a guarantee [1] | 30–90 days when using a simple SaaS deployment, current routes are visibly inefficient, and baseline data is usable | Savings look attractive in percentage terms, but absolute dollars may still be too small if subscription, setup, training, and management time are ignored |
| Mid-market fleet: 21–100 vehicles | Usually the cleanest business case: enough vehicles for meaningful absolute savings, but not so much organizational complexity that rollout slows everything down | 10–20% fuel savings and 15–25% transportation cost reduction; a 100-vehicle fleet can model $150,000+ in annual fuel savings as an upper planning reference [1] | Often 60–180 days for a credible first read, depending on integration depth and dispatcher adoption | The model breaks if route constraints live in driver memory, customer notes, or spreadsheets that never reach the optimization engine |
| Enterprise fleet: 100+ to 500+ vehicles | Large absolute savings, slower realization, heavier change management, and more dependencies across regions, systems, labor rules, and service commitments | Industry-wide AI-enabled distribution benchmarks show logistics cost reductions in the 5–20% range, but full returns depend on process redesign as much as software [2] | Initial positive ROI may appear in 3–6 months; full compound returns are more realistically judged over 2–4 years in enterprise AI programs [2] | A technically successful go-live can still underperform if regions override routes, master data is inconsistent, or service policies conflict with the optimizer |

The table is deliberately split by fleet size because percentages and dollars move differently. A small fleet can produce a fast payback because the implementation is light and the waste is easy to see. A large fleet can produce much larger savings, but the first useful route plan is only one piece of the return. The rest comes from retraining dispatch behavior, integrating order and vehicle data, enforcing route compliance, and learning which exceptions should override the algorithm.
Why small fleets can pay back quickly
Small fleets are not miniature enterprises. They usually have fewer depots, fewer dispatchers, fewer customer service layers, and fewer systems to connect. That makes the implementation burden smaller. If a dispatcher is manually sequencing stops at 6:10 a.m., and the fleet is already dealing with preventable miles, late arrivals, or avoidable backtracking, AI route planning can remove work almost immediately.
The economics are also different. Modern SaaS route optimization tools for smaller fleets are commonly priced at roughly $15–$50 per vehicle per month, which keeps the upfront hurdle low compared with custom enterprise programs [1]. Off-the-shelf SaaS deployments can start in 1–4 weeks, while custom route optimization projects may take 60–90 days before they are ready for serious operational use [3].
That does not mean the first week of software use equals ROI. A route plan has to survive loading dock reality, customer receiving windows, driver familiarity, vehicle capacity, and the old exceptions that never made it into the system. But small fleets have one advantage that enterprise teams often envy: when something is wrong, the people who know why are close enough to fix it quickly.
A 30–90 day payback window is most credible when three conditions are present: the fleet is paying for a relatively simple SaaS subscription, existing routes are visibly inefficient, and the team can compare before-and-after performance without building a reporting program from scratch. If those conditions are missing, the small-fleet case can still work, but the payback should be modeled more cautiously.
Why enterprise returns take longer even when the savings are real
Enterprise fleets have more savings to capture, but also more ways to lose them in the handoff between planning and execution. A national network may have different depot rules, union constraints, customer service policies, telematics vendors, driver compensation structures, and regional habits. The optimizer may be right mathematically and still fail operationally if it ignores how freight is staged, how drivers load, or which customers punish early arrivals as harshly as late ones.
This is where the 2–4 year AI ROI timeline often gets misread. Deloitte’s 2025 data, cited by Open Sky Group, says 85% of organizations increased AI investment, but only 6% saw ROI in under one year; most achieve satisfactory returns within 2–4 years [2]. That does not mean route planning software cannot pay back earlier. It means the full enterprise return includes organizational learning, process redesign, data cleanup, and adoption across operating units.
For a large fleet, the first 3–6 months should usually be treated as the initial proof window: are miles down, are on-time performance and failed deliveries moving in the right direction, are dispatchers accepting the recommendations, and are exceptions being logged in a way the model can learn from? The 2–4 year window is a better lens for compound returns: network policy changes, better planning discipline, improved maintenance patterns, and more consistent execution across regions.
That distinction matters for finance. A CFO asking for payback by Friday does not need a story about autonomous logistics in 2030. They need a staged case: what savings should show up in the first quarter, what requires system integration, what depends on driver and dispatcher behavior, and what belongs in a longer transformation case.
What actually creates the savings
The usual savings categories are fuel, planning labor, failed deliveries, maintenance, and customer service overhead. They are useful categories, but only if they are tied to operating behavior. Fuel savings do not appear because a dashboard says “optimized.” They appear when vehicles drive fewer miles, idle less, avoid poor sequencing, and spend less time recovering from bad plans.
| Savings category | Operational source of the gain | Baseline KPI to capture before implementation |
|---|---|---|
| Fuel | Fewer miles, better stop sequencing, less backtracking, fewer urgent reroutes | Fuel cost per mile, miles per route, idle time, fuel gallons per completed delivery |
| Planning labor | Dispatchers spend less time rebuilding routes manually and more time managing exceptions | Planning hours per day, number of manual route edits, dispatcher-to-vehicle ratio |
| Failed deliveries | More reliable ETAs, better capacity matching, and fewer missed customer windows | Failed delivery rate, reattempt cost, missed time-window rate, customer wait-time complaints |
| Maintenance | Lower unnecessary mileage and smoother utilization across vehicles | Mileage by vehicle, preventive maintenance intervals, unplanned maintenance events |
| Customer service overhead | Fewer “where is my order?” calls when ETA and route status are reliable | Delivery-status contacts, ETA accuracy, customer service tickets linked to delivery timing |
The baseline matters because AI route planning ROI is usually measured against yesterday’s operation, not against an abstract perfect route. A fleet already running disciplined manual routes may get a smaller percentage improvement than a messy fleet with the same number of trucks. A fleet with poor address data, missing service-time assumptions, or unreliable order cutoffs may see the software recommend routes that look efficient in the planning screen and fall apart on the street.
The cleanest ROI models separate hard-dollar savings from service improvements. Fuel reduction, paid planning hours, and avoided reattempts are easier to defend. Customer satisfaction, driver experience, and improved delivery confidence matter, but they should not be used to hide a weak operating baseline.
Data quality decides whether the route can be trusted
Most failed route planning cases are not caused by the algorithm being unable to draw an efficient path. They are caused by the optimizer being fed a version of the operation that does not exist. Customer receiving hours are outdated. Service time is guessed. Vehicle capacities are approximate. Delivery priority is stored in a dispatcher’s head. A driver knows that one dock takes 40 minutes after lunch, but the system thinks every stop is the same.
Before buying or expanding AI route planning, the team should know which constraints are reliable enough to automate. That includes addresses, time windows, order volumes, vehicle capacity, driver availability, depot cutoff times, service duration, traffic assumptions, and exception rules. The question is not whether the data is perfect. It is whether the missing or unreliable data affects the routes enough to erase the savings.
- If address and geocoding data are weak, expect missed stops and driver overrides before fuel savings.
- If service-time assumptions are wrong, the plan may look efficient but overload the driver’s day.
- If customer time windows are incomplete, on-time delivery gains will be difficult to claim.
- If dispatchers can override routes without recording why, the system cannot distinguish a bad recommendation from an old habit.
This is also why implementation model matters. A small fleet can often start with direct SaaS use and improve the data while operating. A larger fleet usually needs integrations with transportation management, order management, telematics, warehouse, and customer communication systems. The route plan is only as current as the data feeding it.
Go-live is not the same as realized ROI
A vendor can get software live in weeks. The operation may take longer to change. That distinction should be explicit in the business case. The first date is technical availability: users can log in, import orders, and generate routes. The second date is operational credibility: dispatchers trust the recommendations enough to use them, drivers are not constantly correcting them, and the performance reports are clean enough for finance to accept.
For a small fleet, those dates may be close together. For an enterprise fleet, they can be months apart. A phased rollout is usually easier to defend than a big-bang claim. Start with one region, one depot, one delivery pattern, or one group of routes where baseline waste is known. Measure against the prior operating pattern. Then expand once the constraints and exception handling are understood.
The same principle applies to vendor selection. Buyers who are still shaping requirements can use an AI route optimization buyer’s guide to compare free trials, proof-of-concept scope, integrations, and constraint handling. The trial should not ask only, “Can the software build a route?” It should ask, “Can it build a route our operation will actually run?”
Where UPS ORION belongs in the business case

UPS ORION is worth mentioning because it proves that route optimization can compound at enormous scale. It is also worth handling carefully because it is the wrong template for most fleets. Reported figures put ORION’s annual savings at $300–$400 million, 10 million gallons of fuel, and 100 million driven miles, but the program required a $250 million investment and three years of testing before full deployment [4].
That makes ORION a credibility anchor, not a normal benchmark. A regional distributor should not borrow the headline savings and shrink them in a spreadsheet as if scale were linear. UPS had the route density, delivery volume, operating discipline, and capital commitment to turn small route improvements into very large dollar outcomes. Most fleets need a narrower question: where are our miles, hours, reattempts, and service failures large enough for optimization to matter?
For readers comparing route planning with other logistics AI investments, broader portfolio-level ROI context can still be useful. The important thing is not to let a network-scale case blur the operating unit you are actually funding. A route optimization project succeeds or fails at the level where dispatchers, drivers, vehicles, customers, and constraints meet.
A practical ROI test before you fund it
A credible AI route planning business case does not need to promise transformation. It needs to survive four tests.
- Baseline KPIs are known. You can measure current fuel cost, miles, planning labor, failed deliveries, service performance, and manual route changes.
- The inefficiency is material. There is enough waste in miles, labor, reattempts, or service failures to cover software, implementation, training, and management time.
- The route data is usable. Addresses, time windows, capacities, order volumes, and service constraints are accurate enough for the optimizer to reflect the real operation.
- The implementation scope matches fleet size. A 15-vehicle fleet should not buy an enterprise change program; a 500-vehicle fleet should not expect enterprise adoption from a light software launch.
If those conditions hold, the benchmark ranges are useful: 10–20% fuel savings, 15–25% transportation cost reduction, small-fleet payback that can fall inside 30–90 days, and enterprise returns that may begin within months but compound over years. If those conditions are missing, the headline payback window is just a vendor number waiting to disappoint someone.
References
- AI Route Optimization vs Traditional Methods in 2026 — FleetRabbit
- Supply Chain AI Statistics: 18+ Statistics You Should Know for 2026 — Open Sky Group
- AI Route Optimization — RTS Labs
- Real-World Examples of AI Route Optimization in Logistics — Debales.ai
Comments
Join the discussion with an anonymous comment.