
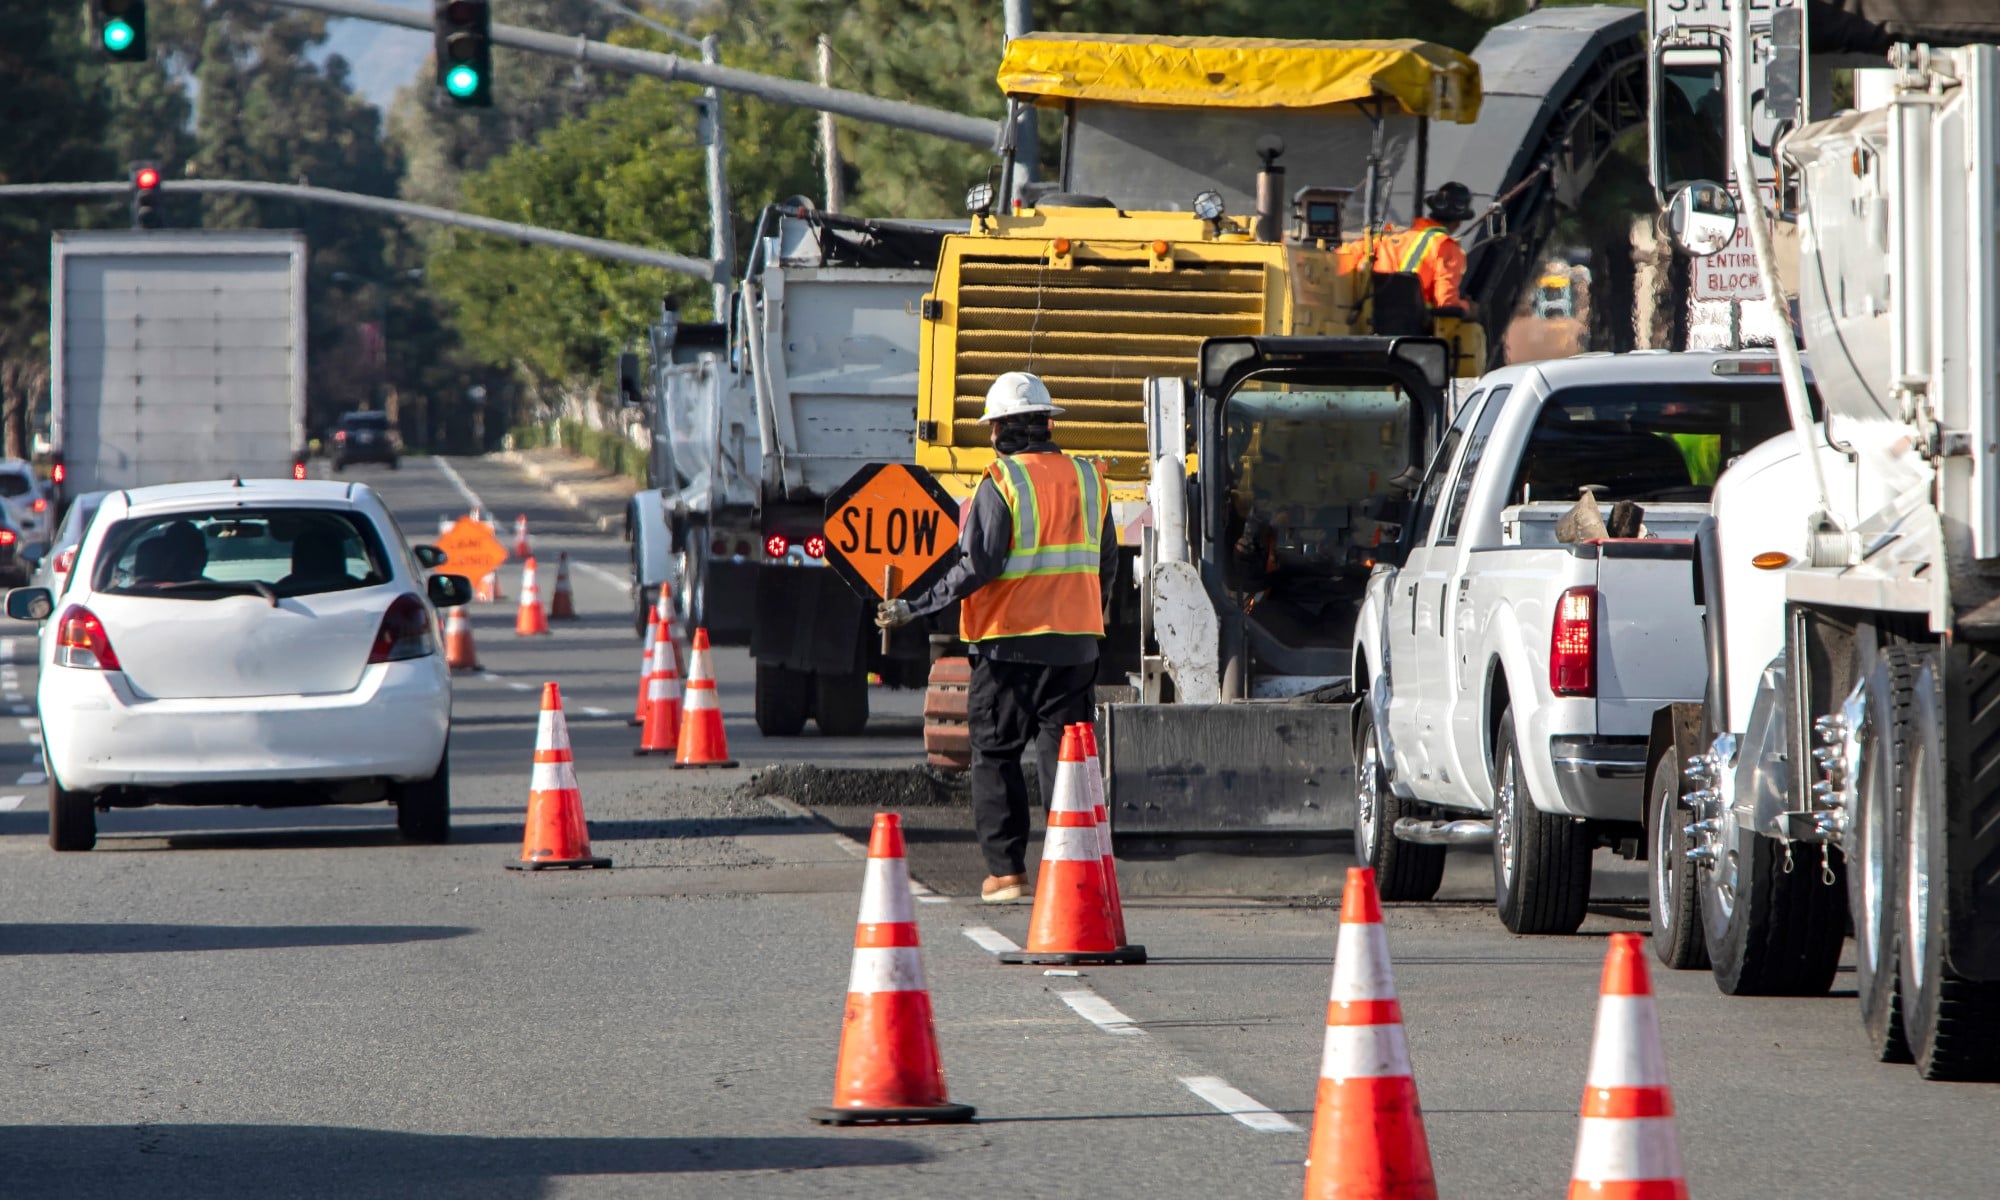
A commercial truck sitting still in a closure queue is not just late. For road-user cost analysis, Texas DOT prices that delay at $53.80 per commercial truck-hour in its 2025 values.[1] That number is a useful place to start because it is plain enough for operations and finance to argue over without turning the discussion into a software demo.
For supply chain leaders evaluating AI route planning for road closures in supply chain operations, the first question is not whether an algorithm can find a cleaner line on a map. The first question is how many paid truck-hours, missed appointments, expedite decisions, and service failures are currently being absorbed as “traffic.” Once those costs are counted, dynamic rerouting becomes less of a technology bet and more of a recovery question: which portion of the known loss can realistically be avoided?
Start With the Truck-Hour, Not the Platform
The $53.80 figure is not a full landed-cost model. It does not, by itself, include the customer penalty on a missed delivery window, the inventory consequence of a late inbound part, or the premium paid to recover service after a missed appointment. Its value is that it gives the closure discussion a defensible floor. If 20 commercial trucks lose one hour each because a planned work zone was not reflected in routing decisions quickly enough, the road-user delay exposure starts at $1,076 before the downstream effects are counted.[1]
That floor matters in budget meetings. A dispatcher may describe the same event as a bad morning. A customer service team may describe it as a late-load problem. Finance needs a cost line. Truck-hours provide the common unit.
The calculation can stay simple at first:
| Input | What to Count | Why It Matters |
|---|---|---|
| Affected commercial truck-hours | Trucks delayed by closure multiplied by delay hours | Creates the base exposure using the $53.80 truck-hour value |
| Service impact | Loads missing appointment windows or delivery commitments | Connects delay to revenue protection and customer performance |
| Recovery actions | Expedites, extra moves, detention, overtime, or resequencing | Shows where closure cost leaves the transportation budget and spreads |
| Avoidable share | Delay hours that could have been reduced with earlier detection and rerouting | Separates total disruption from savings potential |
This is also where many routing business cases overreach. Total delay is not the same as recoverable delay. A closure that appears after a driver has already passed the last practical diversion point may leave little room for recovery. A closure flagged early enough to resequence a route, redirect an inbound leg, or choose a different cross-dock arrival pattern has a different economic profile. The business case has to separate those two situations.
How Closure Costs Become Network Costs
A road closure rarely stays inside one route plan. The first cost is the delayed truck-hour. The second is the missed plan built around that truck: labor at the dock, customer appointment slots, driver hours, downstream deliveries, and sometimes production or store replenishment schedules.
Broader disruption estimates show why the problem deserves executive attention, though they should not be mistaken for closure-only proof. Procurement Tactics reports annual supply chain disruption costs of $184 billion and cites an average disruption cost of $1.5 million per day, drawing on Supply Chain Dive and Interos.[2] Those numbers include more than road closures. They are useful because they place transportation disruption inside a larger financial pattern: small operational failures can become expensive once they interrupt commitments, inventory positions, or revenue timing.
For a fleet exposed to recurring closures, the CFO does not need to accept a generic disruption headline. The better approach is to build from local exposure. Count the closure events that touched the network, the truck-hours lost, the loads that missed planned service, and the recovery costs booked afterward. Then apply the $53.80 truck-hour value as the conservative base and layer company-specific costs only where the records support them.[1]
The distinction matters because it prevents two bad cases. One case understates the problem by treating delay as unavoidable noise. The other overstates it by assigning every disruption dollar to a routing platform. Neither survives a serious investment review.
What AI Dynamic Rerouting Actually Changes
Traditional route planning can already avoid known constraints. The harder problem is the middle of the operating day: a lane closes, a work zone backs up faster than expected, a crash changes the effective travel time, or a planned route remains legal but no longer protects the appointment. AI-powered dynamic rerouting is useful when it shortens the time between disruption detection and operational response.
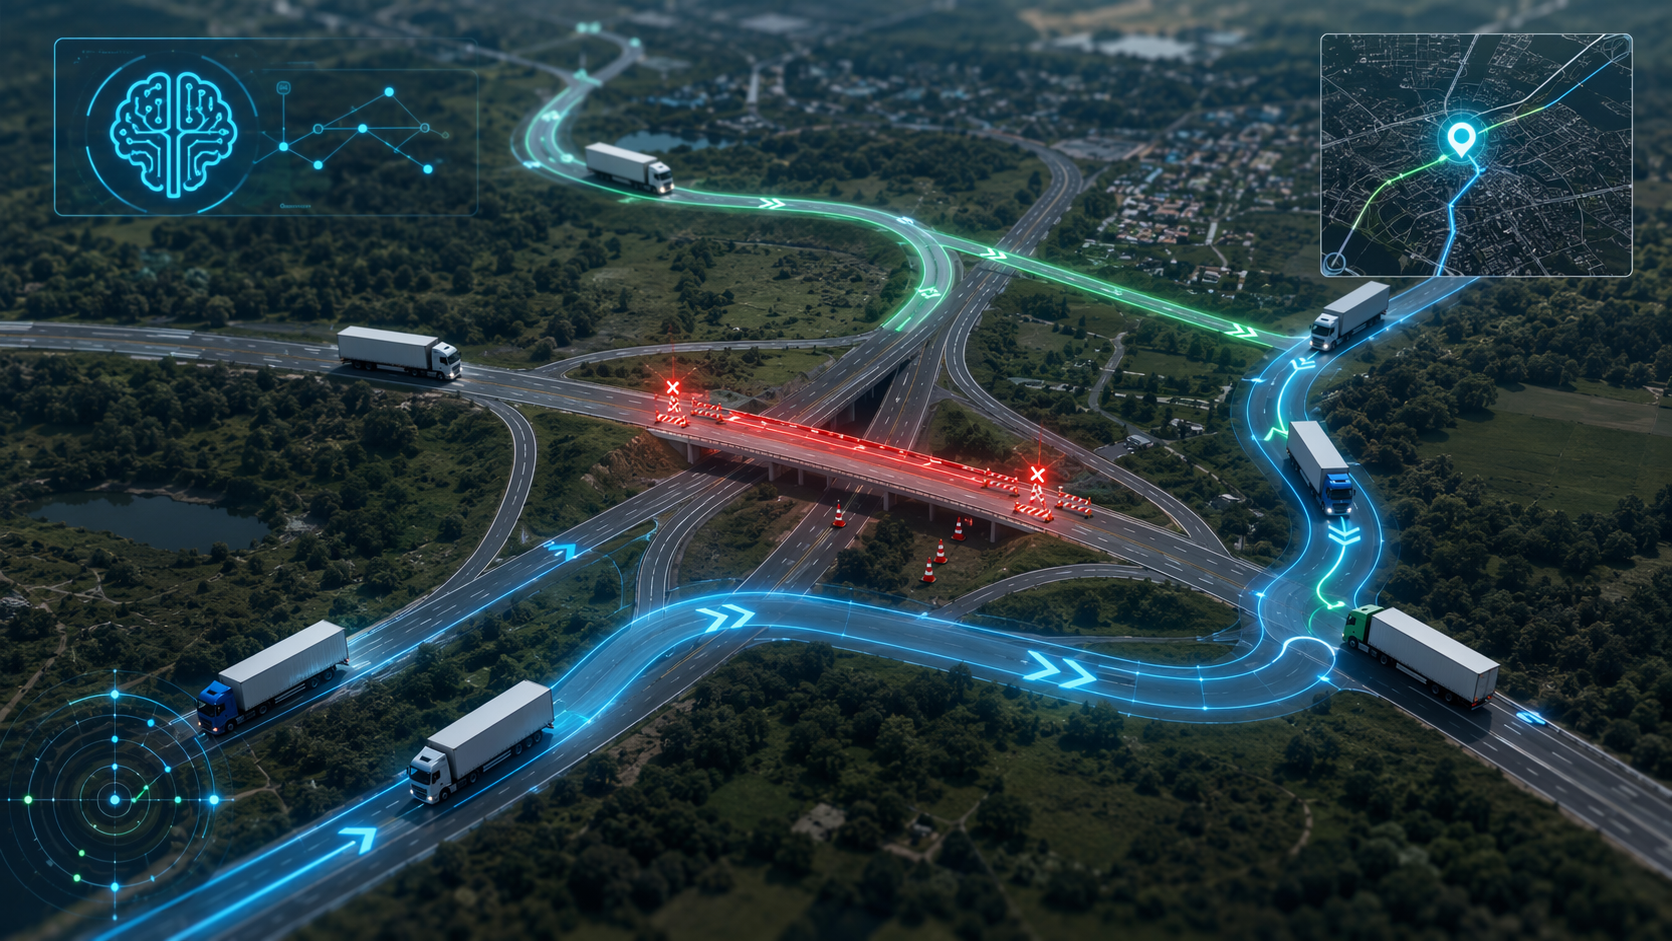
The mechanism is not magic. It is a sequence of decisions that used to be slow, manual, or inconsistent:
- Detect that a closure or traffic condition has changed the route’s expected performance.
- Estimate whether the current route still protects the delivery commitment.
- Compare alternate paths against time, distance, hours-of-service, appointment, and asset constraints.
- Recommend or execute a reroute early enough that the driver, dispatcher, dock, and customer can respond.
- Update the downstream plan so one avoided delay does not create another failure elsewhere.
The savings show up only if that sequence changes the operating result. A shorter route is not automatically a cheaper route. A reroute that adds miles but protects a delivery window may be financially better than staying on the original plan and paying for detention, expedite recovery, or lost customer confidence. Conversely, a reroute that protects one load while stranding another asset can destroy the apparent gain. This is why the business case should track outcomes, not just optimized routes.
The ROI Bridge: From Avoided Delay to Lower Logistics Cost
The most useful benchmark in the available research is the reported 5% to 20% logistics cost reduction associated with AI embedded in distribution operations. Digital Applied and FleetRabbit both cite McKinsey for that range, and the same secondary sourcing also points to 20% to 30% inventory reductions when AI is embedded more broadly in distribution operations.[3][4] Because the original McKinsey report is not the directly available source here, the range should be treated as directional rather than as a guaranteed result for a closure-specific routing deployment.
Still, the 5% to 20% range is a practical bridge. It gives finance a way to test whether the local delay exposure is large enough to support investment. If a fleet’s closure and traffic disruption exposure is modest, even a strong percentage improvement may not justify a new platform, integrations, and process change. If the fleet repeatedly runs through congested corridors, construction zones, port approaches, urban delivery areas, or time-sensitive inbound lanes, the recoverable cost pool is larger.
A defensible model does not need to assume the full benchmark. It can start with three cases: low recovery, mid recovery, and high recovery. The low case might use a small share of exposed truck-hour cost. The mid case can include avoided delay plus documented reductions in overtime, detention, and manual dispatch intervention. The high case should be reserved for networks where on-time performance, appointment protection, and asset utilization all improve. The point is to make the recovery assumption visible enough that operations can challenge it before procurement signs a contract.
Service Reliability Is Where Rerouting Gets Easier to Defend
Cost per truck-hour is the cleanest anchor, but on-time delivery is often where the business case becomes more compelling. Digital Applied, citing a Gartner 2025 supply chain technology survey, reports 94% to 97% on-time delivery for AI dynamic routing compared with 82% to 88% for traditional routing.[3] That is not a closure-only comparison, so it should not be presented as proof that every road closure deployment will reach the higher range. It does show the connection between routing intelligence and service reliability.
That connection matters because transportation cost is not always the largest consequence of a closure. A supplier missing a manufacturing dock can force resequencing. A retail replenishment load arriving after the receiving window can trigger extra handling. A food or healthcare delivery running late can create service exceptions that do not appear neatly inside the freight budget. Once on-time performance improves, some value appears outside the transportation P&L.
This is where supply chain VPs and CFOs should insist on shared measurement. Transportation may see fewer crisis calls. Customer service may see fewer late notices. Procurement may see fewer premium recovery moves. Finance may see fewer unexplained variances. If each function measures only its own relief, the return will be fragmented and easier to dismiss.
A Practical Business-Case Chain
The cleanest case for AI route planning for road closures in supply chain operations follows a traceable chain. It starts with exposure, moves to recoverable cost, then tests the required investment against that recovery.
- Identify the affected lanes, facilities, customers, or regions where closures and traffic disruptions are frequent enough to matter.
- Calculate delayed commercial truck-hours and apply the $53.80 per truck-hour value as the base cost floor.[1]
- Add company-specific costs only where records support them: detention, overtime, expediting, failed appointments, chargebacks, or lost service credits.
- Estimate the avoidable share by event type, not as a blanket percentage across all delays.
- Use the 5% to 20% logistics cost reduction benchmark as a sensitivity range, with a clear caveat that it is secondhand and not closure-only.[3][4]
- Compare annual recoverable savings with software, integration, data, training, and process-change costs.
That chain is more persuasive than a broad claim that AI improves routing. It also exposes where the case is weak. If the company cannot produce reliable delay history, the first investment may need to be in data capture rather than full automation. If most closure events are discovered too late for useful rerouting, the higher-value work may be earlier detection and customer communication. If dispatchers already reroute effectively but downstream systems do not update appointments or ETAs, the bottleneck is coordination rather than route selection.
Weather disruptions and road closures often use the same financial logic: define the disruption pool, estimate recoverable cost, and test the technology against avoided service failures. For a parallel method, see the ROI of AI for supply chain weather disruption planning.
Payback Claims Need Assumptions Attached
FleetRabbit’s total cost of ownership model reports average payback in 18 months and $85,600 in five-year savings per vehicle with machine-learning-optimized routing.[4] Those figures are useful because they translate routing improvement into an investment frame that procurement and finance can understand. They also need to be handled as vendor-originated evidence, not as an industry-wide guarantee.
The hidden assumptions are usually where the payback lives: baseline miles, driver cost, fuel cost, disruption frequency, dispatch labor, fleet utilization, customer penalties, software cost, integration scope, and how quickly planners actually adopt the recommendations. A fleet with dense delivery routes and daily disruption exposure has a different payback profile from a fleet with stable long-haul lanes and infrequent closure impact.
A stronger procurement process asks vendors to rerun the model using the buyer’s own lanes, historical delays, and service rules. It should also ask which savings are hard-dollar reductions and which are avoided growth, improved service, or planner productivity. All four can have value, but they do not carry the same weight in a capital request.
Data Readiness Can Decide the Result Before the Algorithm Does
Adoption is already underway. Trimble’s Transportation Pulse Report 2026 reports that 44% of shippers use AI in transportation planning, while also identifying inconsistent data as the primary obstacle.[5] That pairing is important: adoption does not prove effectiveness, and enthusiasm does not clean up route histories, appointment data, ELD feeds, telematics, carrier updates, or exception codes.
AI rerouting depends on timely, trustworthy inputs. If closure alerts arrive late, if customer appointment rules are stored outside the transportation management system, if accessorial costs are not tied back to disruption events, or if actual arrival times are unreliable, the model may still produce recommendations. The financial case will be harder to prove.
This does not mean a company must wait for perfect data. It means the first deployment should be scoped where the data is good enough and the exposure is large enough. A regional fleet repeatedly affected by construction corridors, urban congestion, or port access disruptions is a better pilot candidate than a broad enterprise rollout built on uneven records.
Where the Investment Case Is Strongest
AI route planning is easiest to defend when three conditions are present: frequent disruption exposure, meaningful service consequences, and enough operational data to compare planned versus actual performance. Under those conditions, road closures are not random annoyances. They are recurring cost events that can be measured, partially avoided, and reviewed after the fact.
The expected return should be built in layers. The first layer is avoided truck-hour delay, anchored by the $53.80 commercial truck-hour value.[1] The second is reduced recovery cost: fewer expedites, fewer paid waits, fewer manual interventions, and better use of assets. The third is service reliability, where the reported 94% to 97% AI dynamic routing on-time range provides a useful benchmark against the 82% to 88% traditional routing range, while still requiring local validation.[3]
For fleets with regular closure and traffic disruption exposure, that is enough to justify serious evaluation. It is not enough to justify buying on a promise. The business case should show local delay exposure, realistic recovery assumptions, data readiness, and a payback model that separates vendor estimates from verified operating results. If those pieces are in place, AI dynamic rerouting can move from an optimization pitch to a defensible supply chain cost-reduction investment.
References
- Texas DOT 2025 Road User Costs, Texas Department of Transportation, 2025.
- Supply Chain Disruption Statistics, Procurement Tactics.
- AI Dynamic Routing and Supply Chain Technology Benchmarks, Digital Applied.
- Machine Learning Route Optimization TCO Model, FleetRabbit.
- Transportation Pulse Report 2026, Trimble, 2026.
Comments
Join the discussion with an anonymous comment.