
Walk a distribution center after the last wave has gone out and the waste is easier to hear than to see. A rooftop unit keeps conditioning air over empty pick faces. Dock doors sit open long enough for July heat to undo the last hour of cooling. Aisle lights stay on because nobody wants the night crew walking into a dark zone. Battery chargers, conveyors, office loads, compressors, and controls keep drawing current even when the building looks quiet.
That is the warehouse version of phantom energy. It includes the familiar standby or “vampire” load from idle plugged-in equipment, but the bigger cost usually comes from systems that are technically running as designed while serving no real occupancy, production, or temperature need. For warehouse energy management, the useful question is not whether the building has waste. It is where the waste hides, how to measure it without turning the electrical room into a retrofit project, and whether detection turns into an operating change.

The Load Is Usually Hiding in Plain Sight
In an ambient warehouse, HVAC is usually the first suspect because it is both large and easy to mis-schedule. Warehouse energy statistics compiled by Meteor Space, drawing on IEA and related industry data, put HVAC at roughly 40% of building energy in ambient warehouses and estimate that about 30% of that HVAC energy is wasted. The same source reports that lighting combined with heating accounts for about 76% of total warehouse electricity consumption, and that energy costs are around 15% of warehouse overhead.[1]
Those figures matter because they move the discussion away from small plug loads. A forgotten monitor in a supervisor office is annoying, but it is not the main event. The larger mistake is letting high-draw systems follow old schedules, broad zones, or manual habits that no longer match the building’s actual use.
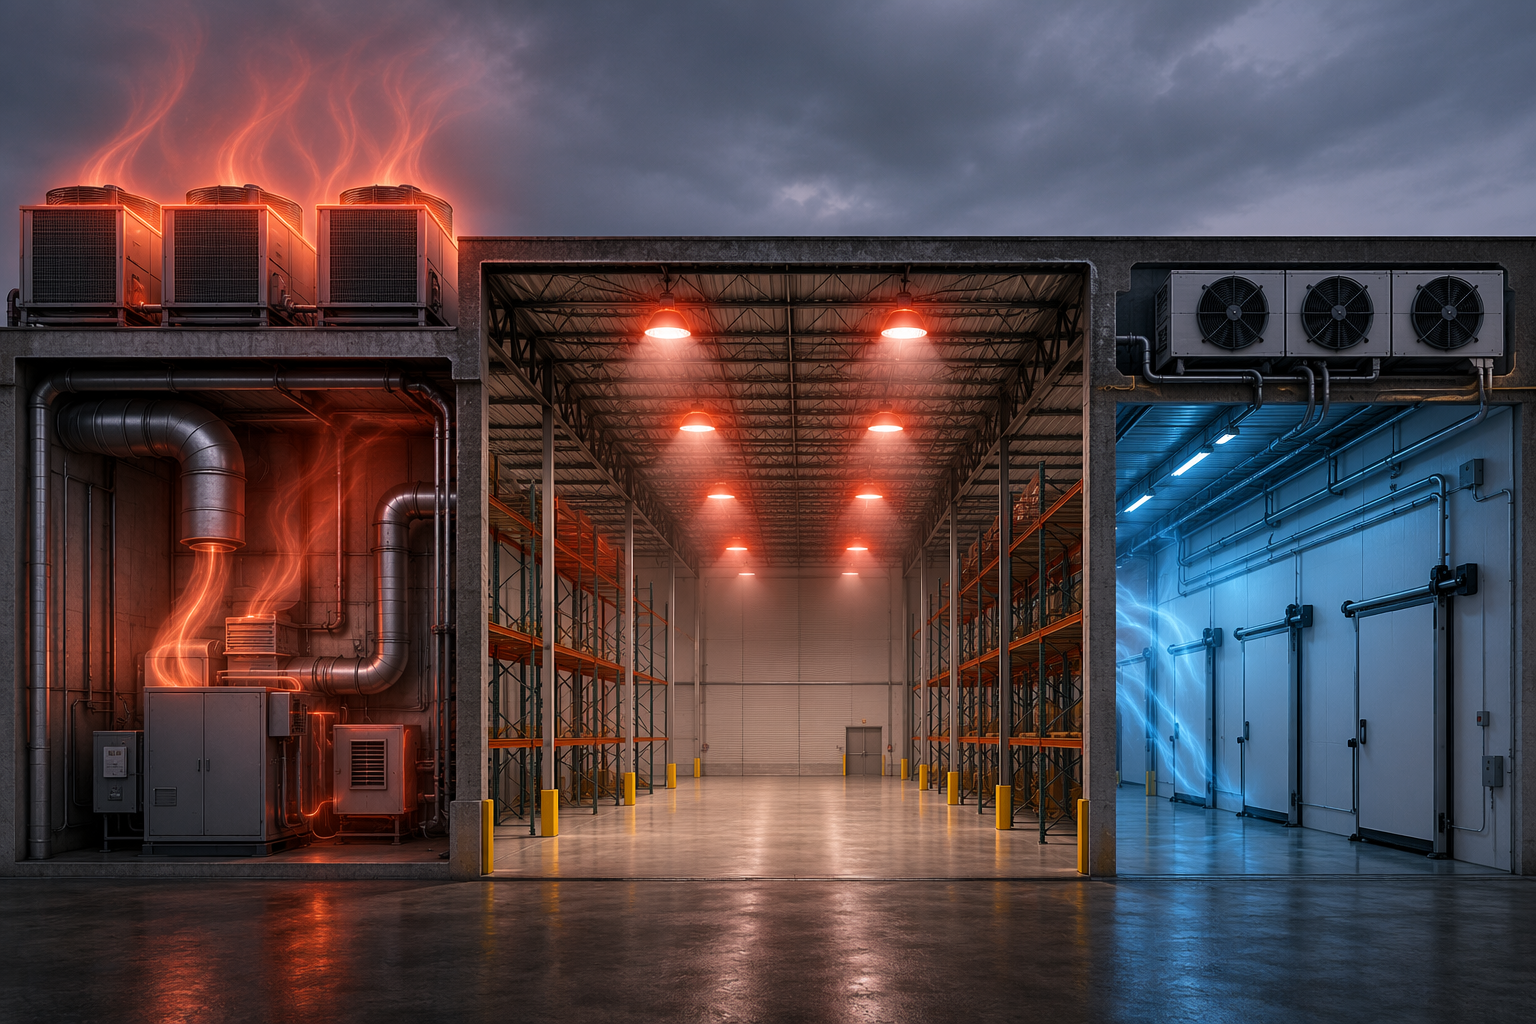
| Warehouse load | Why it becomes phantom energy | What to check first |
|---|---|---|
| HVAC in ambient warehouses | Conditioning empty zones, fighting open dock doors, or following fixed schedules after volume changes | Runtime against occupancy, dock activity, weather, and shift schedules |
| Lighting and heating | Illuminating empty aisles or heating areas that are idle, lightly staffed, or intermittently used | Zone schedules, occupancy overrides, and after-hours burn |
| Refrigeration in cold storage | Cycling inefficiently, recovering from door events, or stacking demand during expensive intervals | Compressor staging, defrost timing, door discipline, and peak demand contribution |
| Conveyors, chargers, and support loads | Remaining energized between waves, during breaks, or after maintenance workarounds | Start-stop patterns, idle draw, and exceptions that become permanent |
Cold storage changes the math. Refrigeration alone accounts for about 60% of on-site electricity use in refrigerated facilities, and demand charges can represent 30% to 50% of cold storage utility bills.[1] That makes load timing almost as important as total kilowatt-hours. A refrigerated building can pay heavily for a short peak if compressors, defrost cycles, dock activity, and charging loads stack at the wrong time.
Cold storage also limits how aggressive any energy system should be. Temperature integrity is not a negotiable variable. AI can identify waste, recommend better sequencing, or help avoid peaks, but it should not override the operating envelope required to protect product and compliance.
How AI Sees Waste Without Sub-Metering Every Asset
The practical appeal of non-intrusive load monitoring, or NILM, is that it starts from one measurement point or a limited set of points instead of installing a dedicated meter on every rooftop unit, lighting panel, compressor, conveyor line, and charger bank. A sensor reads the combined electrical signal at a main panel or distribution panel. Software then separates that aggregate signal into recognizable equipment patterns.
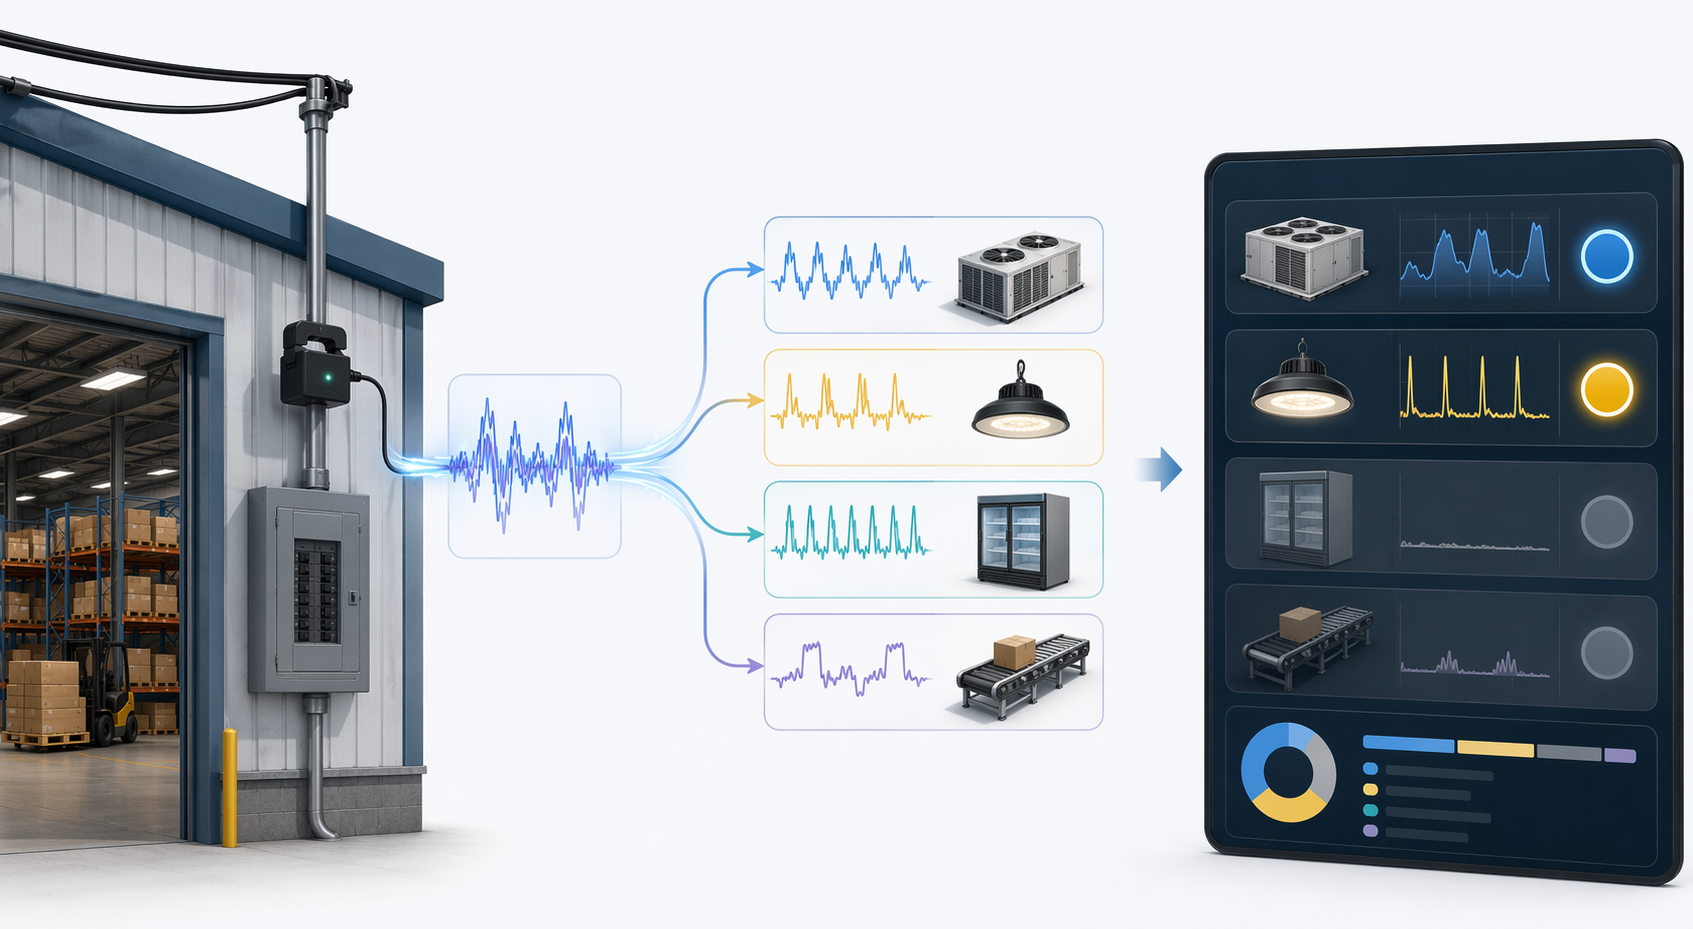
The separation is not magic. Motors, compressors, heaters, lighting banks, and variable-speed equipment leave different electrical signatures when they start, stop, ramp, or cycle. AI models look for those signatures over time, compare them with operating context, and build a baseline of what normal load behavior looks like for that facility.
A useful warehouse NILM workflow usually has six parts:
- Measure the aggregate electrical signal at a panel or limited set of panels.
- Disaggregate the signal into probable equipment-level or category-level loads.
- Compare load patterns with occupancy, shift schedules, production waves, temperature requirements, and weather.
- Establish a baseline for normal operation before claiming savings.
- Flag anomalies such as after-hours runtime, unexpected cycling, simultaneous peak loads, or idle draw.
- Turn findings into scheduling, control, maintenance, or operating changes.
That fifth step is where many dashboards stop and where the bill only starts to change. If a platform reports that a make-up air unit is running through the weekend, someone still has to adjust the schedule, verify the override, assign ownership, and make sure the change survives the next maintenance call. Detection is valuable because it gives operations a specific target. It is not the same as savings until the target is acted on.
The research base is real, but it is not as mature as residential NILM. Yaniv and Beck’s 2025 review of industrial NILM notes that industrial work remains comparatively young, with fewer than 10 publications per year, even as relevance is growing.[2] Pelger and colleagues’ 2024 work on energy disaggregation of industrial machinery is another sign that the method is advancing for production and industrial environments, not only for household appliances.[3]
That maturity gap should shape expectations. A warehouse with a few dominant, consistent loads is a better candidate than a facility with many overlapping, highly variable loads and no reliable operating records. NILM can help create the missing equipment baseline, but the first measurement period should be treated as discovery, not as a savings victory lap.
What the Commercial Evidence Actually Shows
The strongest claims in this market come from vendor-published case studies and product materials. They are useful, especially for scoping a business case, but they should be read as documented outcomes under favorable or controlled conditions rather than guaranteed savings for every warehouse.
| Provider or source | Reported outcome | Best use of the claim |
|---|---|---|
| ARTI Analytics | 27% total energy cost reduction in a warehouse case study, with no infrastructure changes and AI-based scheduling and load management | Strongest warehouse-specific savings data point, but still a vendor-published case |
| Bosch Phantom | Non-intrusive deployment using a single measurement point per panel, patented NILM algorithms, edge AI processing, and a 5-6 day deployment model | Clear example of how limited-panel measurement can be packaged operationally |
| BrainBox AI | Up to 25% HVAC energy reduction and 40% emissions reduction in commercial and retail environments | Relevant for HVAC-heavy buildings, not a warehouse-specific guarantee |
| Powerhouse Dynamics | At least 10% peak demand charge reduction reported in AI energy-management materials | Useful where demand charges are a major bill driver |
| C3 AI Energy Management | Up to 4% total energy cost reduction reported for broader commercial buildings | A more conservative commercial-building benchmark |
| Nextbitt | Warehouse energy monitoring positioned around blind spots, IoT data, and AI savings | Landscape signal for warehouse monitoring, not a quantified outcome in the cited material |
ARTI Analytics deserves the most attention because its published case is warehouse-specific: the company reports a 27% total energy cost reduction using AI-based scheduling and load management, with no infrastructure changes.[6] That does not make 27% a planning assumption for every site. It does make the case useful for one reason facility teams care about: the result is expressed as total energy cost, not only as a reduction in one subsystem.
Bosch Phantom is useful for a different reason. Its materials describe patented NILM algorithms, edge AI processing, and non-intrusive monitoring from a single measurement point per panel; AWS describes the approach as deployable in 5 to 6 days.[4][5] That deployment model addresses one of the usual blockers in existing warehouses: nobody wants a long sub-metering installation that interrupts operations, consumes capital, and still leaves the team arguing about which loads matter.
The broader vendor landscape is less directly warehouse-specific but still relevant. BrainBox AI reports up to 25% HVAC energy reduction and 40% emissions reduction in commercial and retail environments.[7] Powerhouse Dynamics reports at least 10% peak demand charge reduction in its AI energy-management materials.[8] C3 AI Energy Management reports up to 4% total energy cost reduction for broader commercial buildings.[9] Nextbitt frames warehouse energy monitoring around IoT visibility, blind spots, and AI-driven savings, but the cited material is more useful as a market signal than as a savings benchmark.[10]
For a capital request, those numbers should not be averaged together. A 27% warehouse cost reduction, a 25% HVAC reduction, a 10% demand-charge reduction, and a 4% commercial-building cost reduction measure different things. They may all be true in their own contexts and still point to very different payback models.
Where the Business Case Gets Stronger
AI phantom energy management becomes easier to justify when a facility has large scheduled loads, inconsistent occupancy, expensive demand charges, or recurring maintenance complaints that already suggest equipment is running outside need. Ambient warehouses with HVAC and lighting schedules that have drifted away from actual shift patterns are obvious candidates. Cold storage facilities can also benefit, but the control logic has to respect refrigeration constraints first.
The strongest business cases usually come from a short list of operational questions:
- Which major loads run when no production, picking, loading, or occupancy event requires them?
- Which loads create avoidable peaks when they start together?
- Which overrides were meant to be temporary but became normal operation?
- Which maintenance issues show up first as abnormal cycling, ramping, or runtime?
- Which schedules can be changed without affecting service levels, temperature integrity, worker safety, or throughput?
This is also where NILM’s non-intrusive design matters. If the first phase can establish a credible baseline from existing panels, the facility manager gets evidence before asking for deeper retrofit money. In a favorable HVAC-focused setting, vendor materials in this market support 10% to 27% total energy cost-reduction evidence and 6- to 18-month payback claims, but those claims depend on equipment mix, tariff structure, baseline quality, and whether operations actually changes schedules and controls.
Where Claims Weaken
The first weak point is the baseline. If last year’s utility bill is the only reference, the team can estimate building-level improvement but may struggle to prove which equipment caused it. If production volume, weather, occupancy, refrigeration load, or operating hours changed at the same time, the savings claim needs normalization. AI monitoring can help build that baseline, but it cannot retroactively create clean equipment-level history where none existed.
The second weak point is disaggregation confidence. Some loads are easier to identify than others. A distinct compressor cycle or lighting bank may be recognizable; overlapping motor starts and variable-speed equipment can be harder to separate. A responsible vendor should be able to explain the measurement point, the training or baseline period, the categories it can identify reliably, and what it reports as uncertain.
The third weak point is ownership. A dashboard can flag that a unit ran all weekend, but it cannot by itself decide whether maintenance left it on for a reason, whether a supervisor requested the override, or whether the building-management system is following an obsolete schedule. Phantom energy often survives because no single person owns the routine that creates it.
That is why the better implementation question is not “Does the AI find waste?” but “Who closes the ticket when it does?” In a warehouse, savings are operational discipline with better visibility attached.
The Practical Read
AI-based NILM is a credible and growing warehouse energy-management use case, especially where HVAC, lighting, refrigeration, and peak demand charges dominate the bill. It is attractive because it can start with limited measurement instead of a full sub-metering retrofit, and because it points to specific operating behaviors rather than asking a facility team to chase a vague efficiency target.
The documented commercial range is meaningful but conditional. Vendor-published outcomes support total energy cost reductions from conservative commercial-building figures to a 27% warehouse case, with stronger payback potential in favorable HVAC-heavy environments. The result for a real facility will depend on the quality of the baseline, the equipment profile, the tariff, the maturity of controls, and whether the night-shift finding becomes the next morning’s work order.
References
- 25 Warehouse Energy Consumption Statistics You Need To Know, Meteor Space
- Industrial non-intrusive load monitoring: A review, ScienceDirect, 2025
- Energy disaggregation of industrial machinery, ScienceDirect, 2024
- Optimizing Energy Footprint with Edge Analytics and Artificial Intelligence of Things with Bosch Phantom, AWS
- Phantom, Bosch Software Technologies
- AI Cloud, ARTI Analytics
- Reduce, BrainBox AI
- Leveraging AI in Energy Management: Enhancing Efficiency and Savings, Powerhouse Dynamics
- C3 AI Energy Management, C3 AI
- Warehouse Energy Monitoring with IoT: From Blind Spots to AI Savings, Nextbitt
Comments
Join the discussion with an anonymous comment.