
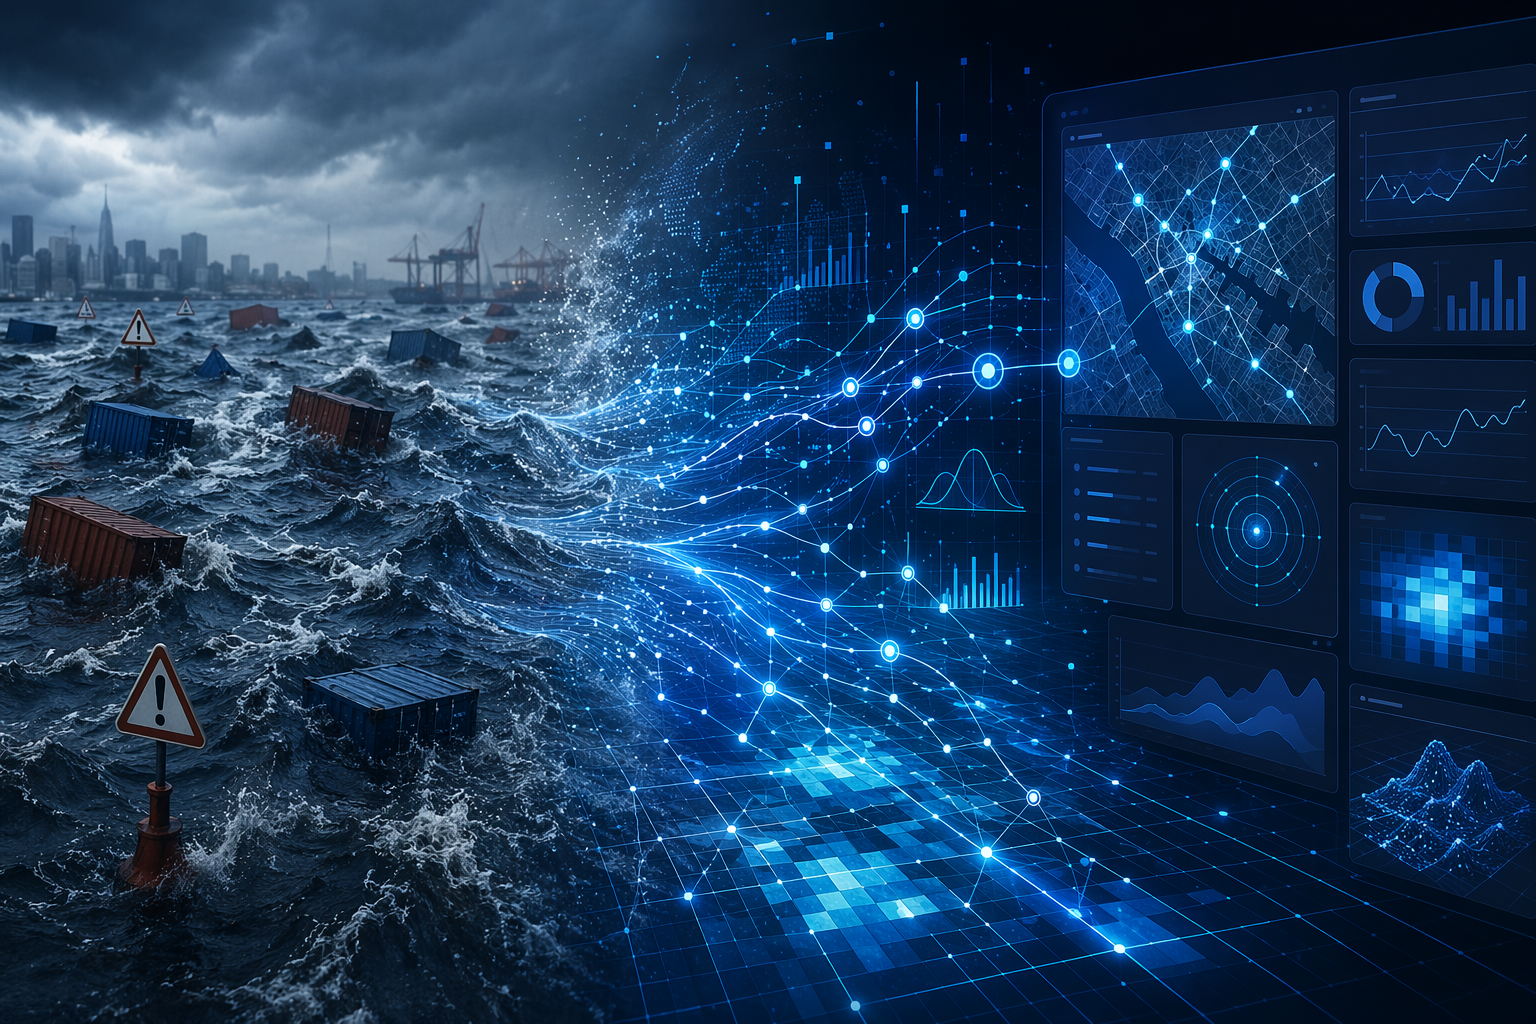
Flooding is already large enough to deserve a line in the planning model, not just a note in the risk register. It accounts for 70% of weather-related supply chain disruptions, while the US recorded 123 flood incidents in 2024 and Hurricane Helene generated about $7 billion in supply chain claims, according to Everstream Analytics figures cited by DOXA.[1] Yet only 30% of US companies plan to upgrade to new software for disaster mitigation, even as 99% of executives say climate change is already affecting their supply chains.[2][3]
That mismatch is the useful starting point for flood-aware supply chain planning. The issue is not whether floods are visible. They are visible in port closures, late inbound materials, missed customer commitments, emergency freight, supplier excuses, and the awkward S&OP meeting where everyone agrees the event was exceptional until the next one arrives. The problem is that most planning processes still ingest flood risk too late and too informally: a warning email, a transportation update, a supplier escalation, a spreadsheet of exposed orders.
For flood risk to become a planning variable, it has to arrive with four things planners can act on: lead time, probability, exposure, and decision consequence. A forecast that says a watershed may flood in several days is useful only if the company can connect that signal to plants, suppliers, lanes, inventory positions, open purchase orders, customer allocations, and service commitments. Otherwise it remains weather intelligence, not planning intelligence.
The Planning Variable Is Not “Flood.” It Is Exposure Over Time
A flood warning by itself is too blunt for S&OP. A planner needs to know whether the threatened area contains a single alternate lane, the only qualified supplier for a constrained component, finished goods inventory already allocated to a key account, or a regional distribution center supporting next-week promotions. The same hydrological event can be a nuisance, a margin hit, or a service failure depending on where the company is exposed.
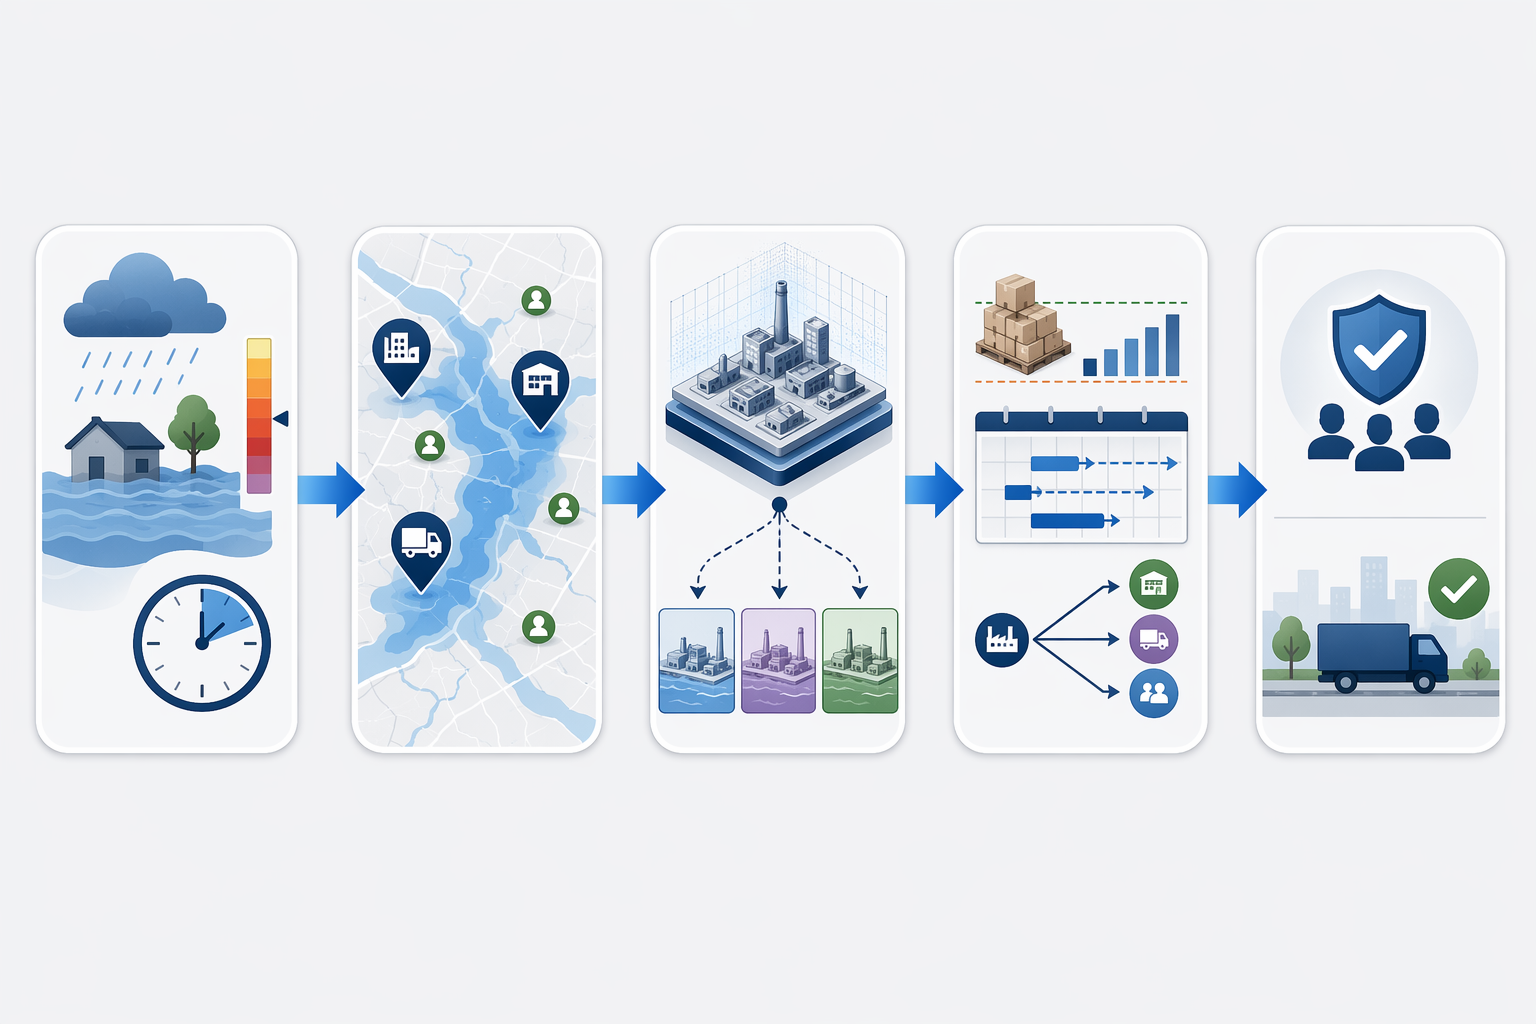
This is where AI changes the shape of the work. Predictive flood models estimate timing and severity. Climate risk mapping overlays that risk against sites, suppliers, lanes, and inventory nodes. Digital twins then test the operational consequences of different scenarios before the water reaches the dock door. The output is not a perfect answer. It is a set of earlier tradeoffs: pull orders forward, raise temporary buffers, pre-position inventory, shift a lane, reserve alternate capacity, revise customer promise dates, or accept the risk and document the service-level exposure.
| Layer | Planning Input | Decision It Enables |
|---|---|---|
| Flood forecasting | Probability, severity, and lead time for affected areas | When to trigger exception planning and how much time remains |
| Exposure mapping | Sites, suppliers, lanes, orders, and inventory connected to the threatened area | Which commitments and buffers are actually at risk |
| Digital twin simulation | Scenario impact on supply, transport, inventory, and service levels | Which response creates the best tradeoff among cost, service, and risk |
| S&OP execution | Approved changes to buffers, timing, allocations, sourcing, routing, and commitments | What changes in the operating plan before disruption becomes a miss |
The sequence matters. If the forecast is not tied to exposed nodes, it produces alerts. If exposure is mapped but not simulated, it produces anxiety. If scenarios are simulated but not admitted into S&OP decisions, it produces a dashboard that looks modern while planners still operate by escalation.
Flood Forecasting Is Becoming Useful Earlier
The first operational improvement is lead time. Google Research reported in Nature that its global flood forecasting work extended reliable flood nowcasts from zero to five days in data-sparse regions, and Google’s Flood Hub covers more than 80 countries.[4] That does not mean every company can now forecast every site-specific disruption five days in advance. It does mean a planning organization can begin to treat flood probability as a rolling signal rather than a same-day surprise in more geographies than traditional gauge networks covered well.
Georgia Tech’s 2026 research points to the next level of granularity: physics-informed AI models predicting building-level flood depths three to five days ahead with more than 90% accuracy in Hurricane Sandy test cases.[5] The caveat is important. These are research-stage test results, not proof of enterprise-scale deployment across a global supplier base. Still, building-level depth is the kind of signal that changes planning relevance. A regional flood warning tells a company to pay attention. A credible estimate that a specific facility, access road, or surrounding area may be impaired gives planners something closer to an operational trigger.
Planning teams do not need flood models to be omniscient. They need thresholds. If the probability and severity cross a defined level for a location tied to constrained supply or high-service customers, the model can initiate scenario review. If the signal weakens, the response can be scaled back. That is how flood risk starts behaving like demand uncertainty or supplier capacity risk: imperfect, probabilistic, and still useful when disciplined.
Exposure Mapping Is Where the Forecast Meets the Supply Chain
Most companies know their owned facilities. Fewer know the full flood exposure of the suppliers behind their suppliers, and that is where the planning model often loses contact with reality. ClimateAi reports that 85% of climate risks reside in tier 2 to tier 4 suppliers, outside the visibility of traditional planning processes.[6] The figure is vendor-published, so it should not be treated as an independent benchmark for every sector. But the operational point is familiar: the material that stops a line often comes from a node the enterprise resource planning system does not describe well enough.
Good exposure mapping converts a geographic hazard into a supply chain object. The object may be a factory, a contract manufacturer, a sub-tier source, a port, a carrier lane, a warehouse, a customer region, or a stock-keeping unit dependent on a specific upstream input. Once that object is tagged, the planning system can ask practical questions: Which demand streams rely on this node? How many days of cover exist? Which alternate suppliers are qualified? Which purchase orders can be accelerated? Which customers would be protected first if allocation becomes necessary?
This is also where the bullwhip effect enters. Without mapped exposure, teams often overreact broadly: buying extra across too many SKUs, expediting material that was not truly at risk, or inflating forecasts to protect themselves from uncertainty. With mapped exposure, the response can be narrower. Buffers can rise where the exposed node is binding and remain unchanged where it is not. That does not eliminate volatility, but it gives the planning team a better chance of preventing one local flood signal from becoming a network-wide ordering distortion.
Digital Twins Turn Warnings Into Tradeoffs
A digital twin earns its place in this use case only if it changes a decision before the disruption lands. In flood-aware planning, that means simulating how a probable event would affect supply availability, transportation timing, inventory depletion, production sequencing, and customer service. The planner should be able to compare options rather than simply admire a risk heat map.
- Inventory: raise temporary buffers for SKUs tied to exposed nodes, or avoid adding stock where alternates are already available.
- Supply timing: pull forward purchase orders when the risk window is earlier than the normal replenishment cycle.
- Sourcing: test whether alternate suppliers can cover the gap without creating a new constraint elsewhere.
- Routing: compare the cost and service impact of shifting ports, carriers, or inland lanes.
- Service commitments: identify which customers or channels need revised promises before failure becomes visible.
BCG reports that value chain digital twin deployments among early adopters have improved forecast accuracy by 20% to 30% and reduced disruption-related delays by 50% to 80%.[7] Those ranges deserve attention, but not blind extrapolation. They come from consulting case work with early adopters, not a controlled representative study of the average planning organization. The safer reading is that integrated simulation can produce material planning gains when the data, governance, and operating cadence are already strong enough to absorb the output.
The steel manufacturer example in the same BCG material shows what “absorbing the output” looks like in practice. The company used a digital twin to anticipate risks 12 weeks ahead, improve EBITDA by 2 percentage points, and cut inventory by 15%.[7] The details matter because the case is not merely about seeing risk earlier. It ties earlier risk visibility to working-capital and profitability outcomes, which is the difference between resilience language and planning performance.
Where the Use Case Shows Up in Real Planning Work
The most credible flood-aware AI deployments will not feel like a separate climate project. They will show up inside familiar planning moves. A demand planner sees a flood probability tied to a constrained upstream component and adjusts the forecast risk assumption for affected SKUs. A supply planner sees that the same event threatens a tier 2 input and pulls forward orders only for products dependent on that input. A logistics planner sees likely lane disruption and models whether the service benefit of rerouting justifies the cost. The S&OP lead sees the tradeoff and gets an explicit decision instead of a week of scattered exception emails.
ClimateAi’s roofing manufacturer case is a useful example, with the usual vendor-published caveat. The company reportedly used ClimateAi to anticipate Hurricane Ian months ahead, adjust supply timing, and capture $15 million in additional sales.[6] The claim should not be treated as independent proof of typical results. It is still a concrete illustration of the use case touching the right lever: supply timing before a weather-driven demand and availability shock.
Hitachi’s cyclone-aware delivery scheduling, also cited in ClimateAi’s discussion, points to another practical edge: delivery timing.[6] Not every flood-aware decision is a strategic sourcing event or a major inventory redesign. Some of the value comes from moving a delivery window, resequencing dispatches, or avoiding a commitment that is likely to be broken. Those are not glamorous decisions, but they are exactly where planning systems either protect service levels or create avoidable apology work.
Why This Is Becoming a Durable Planning Use Case
Flood-aware planning is not a seasonal add-on if the network itself is becoming more exposed. Everstream’s analysis says global flood damages are about $50 billion per year, flood losses have risen 27% since 2000, and four of the five costliest years have occurred since 2017.[1] It also projects that 22 of the 25 top global ports will face increased precipitation by 2050.[1] For supply chains that depend on port throughput, regional warehousing, coastal manufacturing, or inland road and rail links, that is not background weather context. It is network design pressure entering the planning horizon.
Other signals point in the same direction. Georgia Tech’s Sarhadi lab notes that damage from tropical cyclones has risen by roughly 380% since 1970, while the World Meteorological Organization figure cited in Google’s flood forecasting work says flood disaster rates have more than doubled since 2000.[5][4] Those statistics do not prove that any single company will benefit from a specific AI tool. They do make it harder to justify treating flood disruption as an occasional exception outside the planning model.
Technology buying behavior is starting to reflect that pressure, though unevenly. ABI Research reports that 65% of respondents see AI as important in supply chain technology purchase decisions.[8] That is an attitude signal, not evidence that buyers have implemented flood-aware planning well. The adoption gap remains the more uncomfortable fact: executive concern is high, but disaster-mitigation software upgrades are still limited.[2][3]
The Operating Test
A flood-aware AI planning system should be judged less by the sophistication of its map and more by the decisions it changes. The operating test is simple: when a flood probability rises, does the planning process know which suppliers, lanes, orders, inventory positions, and customer commitments are exposed? Does it create a scenario in time for S&OP or exception governance to act? Does someone have authority to adjust buffers, timing, sourcing, routing, or service promises? Are the outcomes measured after the event?
If the answer is yes, flooding starts to behave like a forecastable planning variable. It remains uncertain, but it is no longer exogenous in the old convenient sense. It has a probability, a location, a lead time, a set of exposed supply chain objects, and a menu of tradeoffs.
If the answer is no, the company has a resilience dashboard. The planners will still discover the consequence through late shipments, emergency expedites, inventory imbalances, and customer escalations. The dashboard may help explain what happened. It will not have changed the plan.
The credible version of this use case combines flood forecast lead time, multi-tier exposure visibility, and scenario simulation inside the actual S&OP cadence. The evidence is strongest for early adopters with the data integration and governance to turn signals into decisions. The promise is not that AI removes flood disruption from supply chains. It is that planners can stop treating every flood as an improvised exception and start deciding, earlier and more explicitly, which risks to buffer, reroute, accelerate, allocate, or accept.
References
- Flooding Tops the List of Supply Chain Risks in 2025, DOXA, citing Everstream Analytics 2025 Annual Risk Report
- Sourcemap 2024, Sourcemap, 2024
- Economist Impact, Economist Impact
- Global prediction of extreme floods in ungauged watersheds, Nature, 2024
- How AI-Powered Flood Forecasts Could Transform Hurricane Resilience, Georgia Tech, June 2026
- Climate Risk: An Essential Element of Supply Chain Risk Mapping in 2026, ClimateAi
- Using Digital Twins to Manage Complex Supply Chains, BCG, 2024
- Supply Chain Disruptions 2026, ABI Research
Comments
Join the discussion with an anonymous comment.