
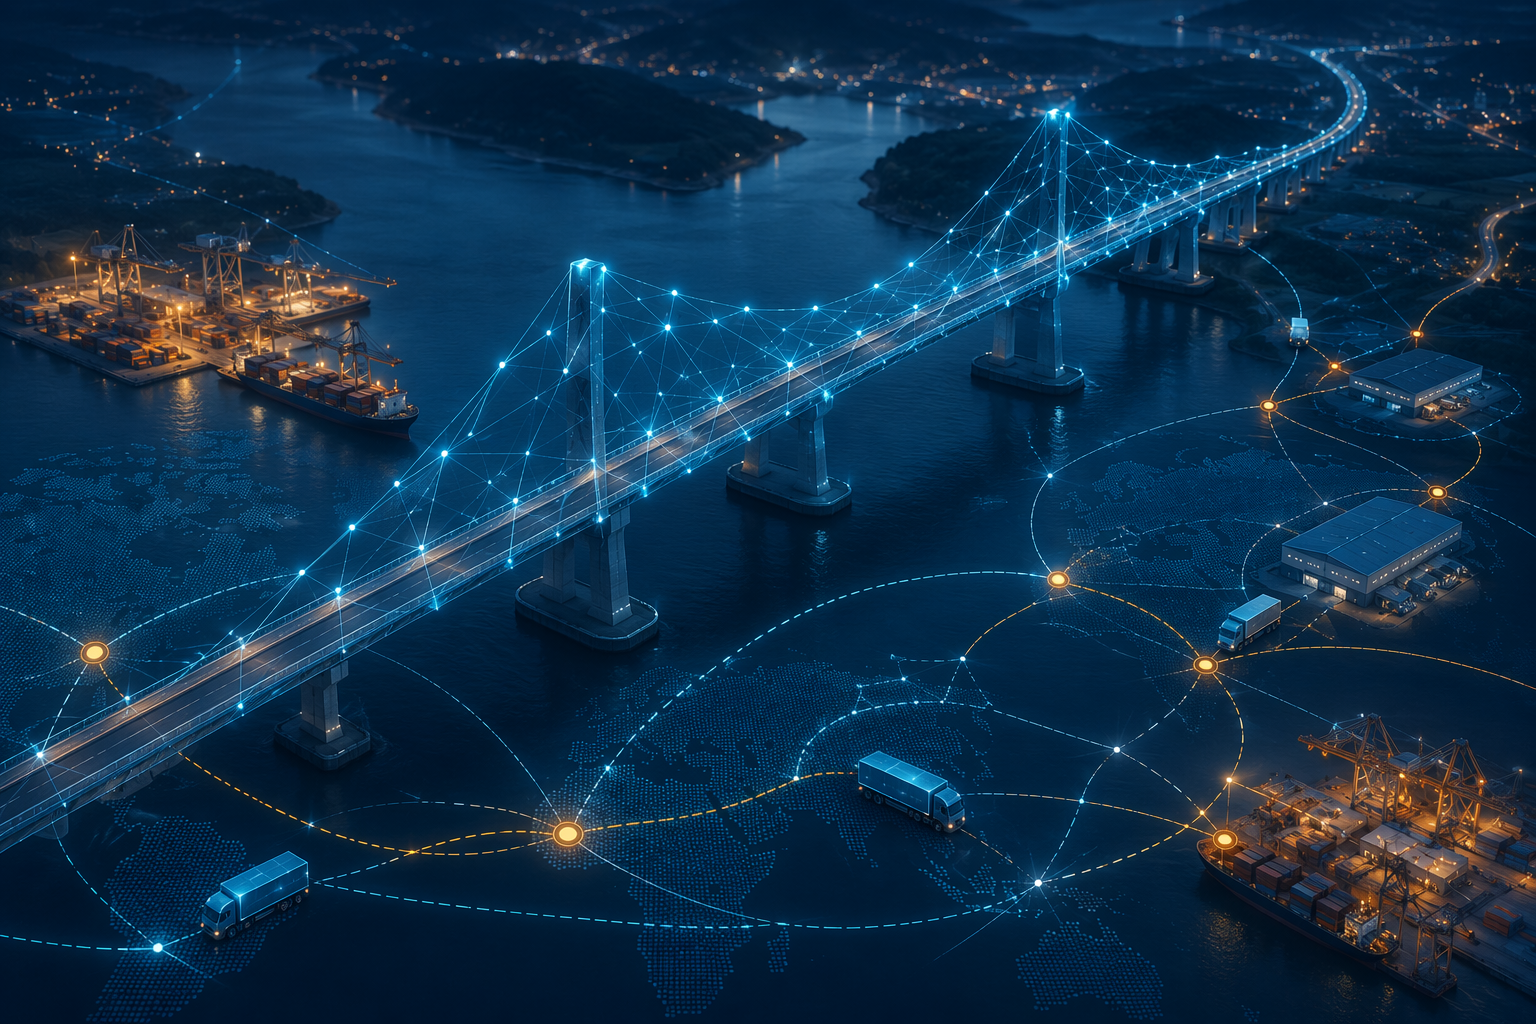
Bridge risk usually enters supply chain planning as a quiet assumption. A route guide says a lane is viable. A carrier commits to a transit time. A supplier buffer is sized around normal drayage and highway access. A port contingency plan names alternate terminals. Underneath all of that sits infrastructure that most supply chain systems do not model at bridge level.
That is why AI bridge earthquake risk assessment for supply chain planning matters. The question is not whether a model can produce an elegant seismic-risk layer. The useful question is whether bridge-level screening can change a transportation manager’s pre-disruption route plan, a procurement team’s supplier-lane exposure score, or a capital-planning conversation about which crossings deserve retrofit attention first.
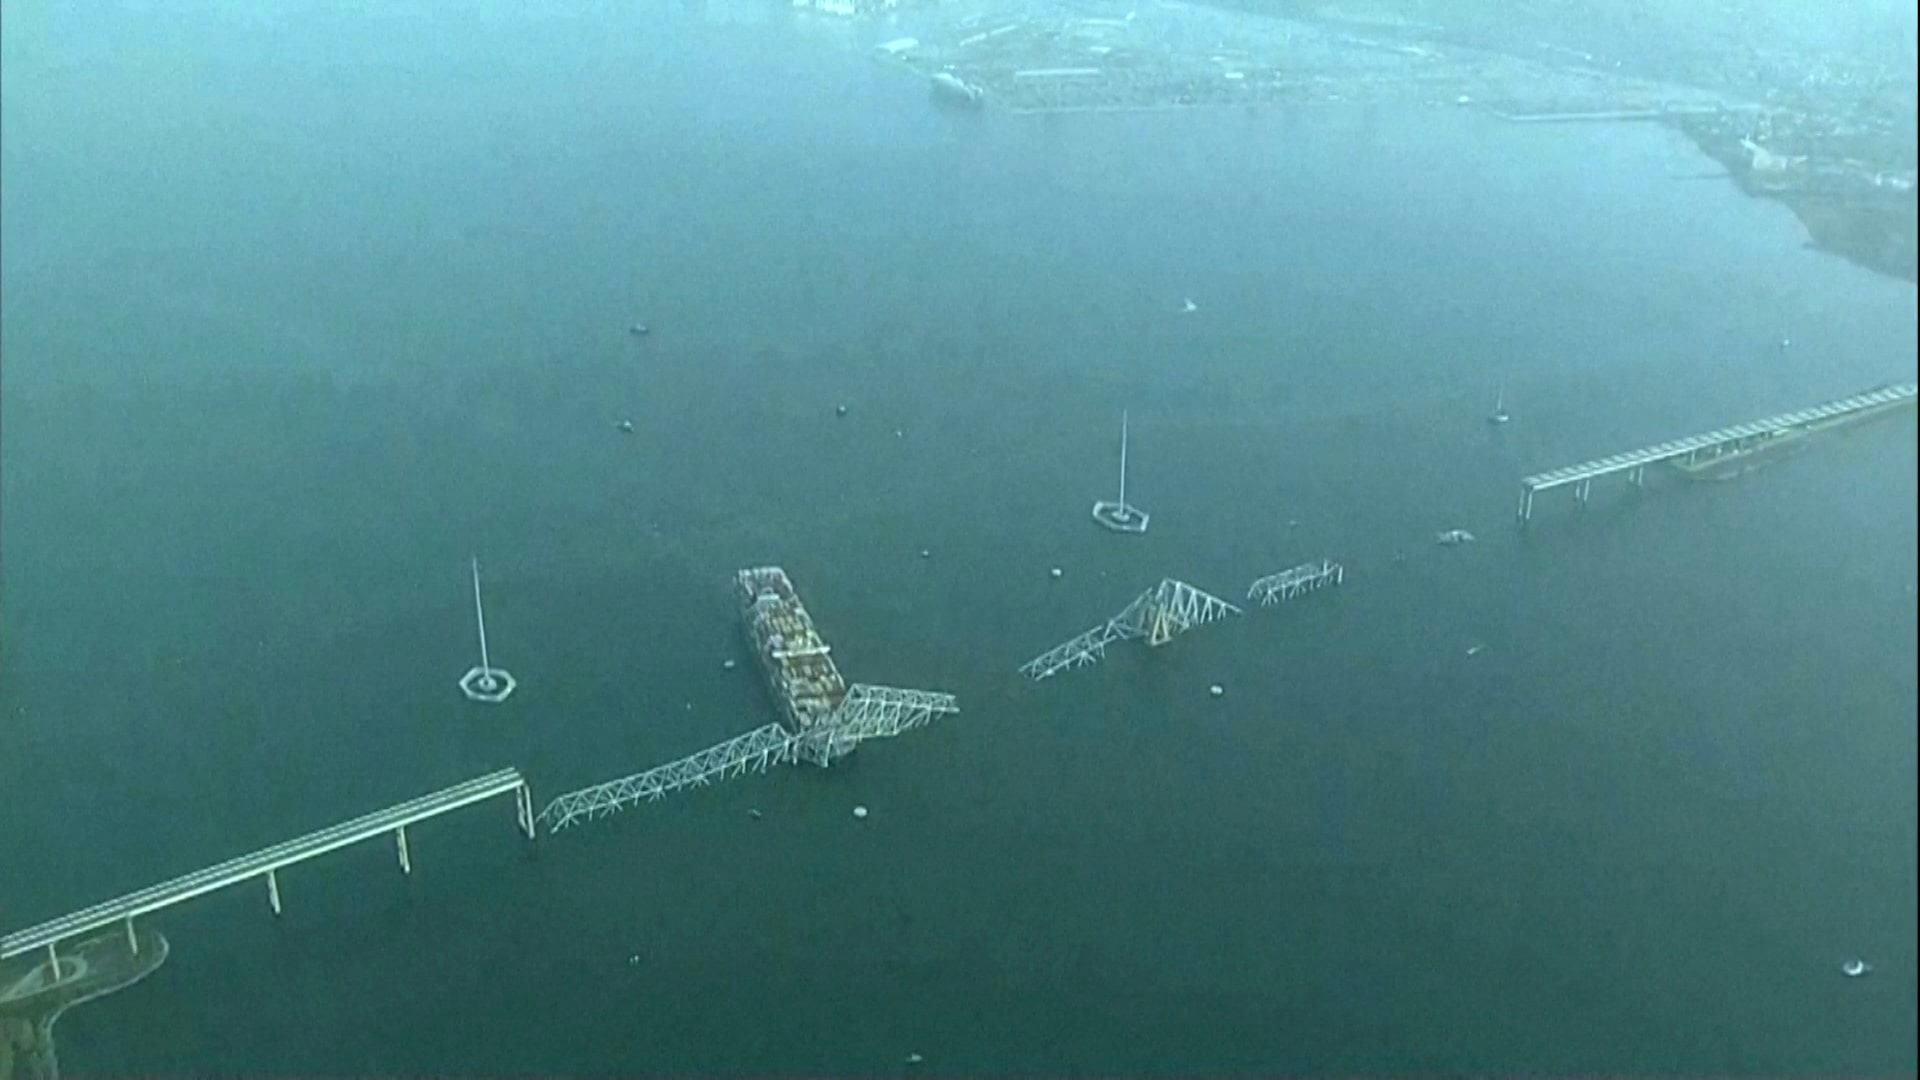
The supply chain case is easy to see when one structure fails. After the Francis Scott Key Bridge collapse in Baltimore in March 2024, analysis pointed to disruption around a port handling about $80 billion in annual cargo throughput, with about 5,000 trucks and $28 billion in goods diverted daily and 15,300 port jobs affected.[1] The Council on Foreign Relations also framed the collapse as a test of U.S. supply chain resilience, because the disruption reached beyond the visible wreckage into port access, vessel routing, trucking capacity, and regional commerce.[2]
Earthquake exposure adds another uncomfortable lesson: the companies that feel the disruption are not only the companies with direct suppliers in the affected area. Saito’s analysis of the Great East Japan Earthquake found that only 3% of firms had direct suppliers in affected areas, while 50% to 60% had indirect connections.[3] In other words, “we do not source there directly” is not much comfort if a critical component, sub-tier supplier, or transport corridor depends on the same damaged region.
The readiness gap is still large. A 2023 article citing Bloomberg reported that only 24% of companies had supply chain risk plans for immediate earthquake-disruption remediation.[4] That does not mean three quarters of firms ignore earthquakes. It means many plans still do not translate hazard awareness into an operational playbook that says which routes, bridges, suppliers, and carriers move first when the ground stops shaking.
The missed risk is often between bridges, not inside one bridge
A bridge-by-bridge assessment can still be too optimistic for supply chain planning. The problem is that a lane does not fail one structure at a time in a spreadsheet. A route can depend on several crossings exposed to the same regional seismic demand, the same soil conditions, the same aftershock sequence, or the same limited detour network.
That is the practical bite in Zhong et al.’s 2024 work on regional seismic fragility of bridge networks. Their covariance matrix model accounts for bridge-to-bridge seismic demand correlations, and the reported result is that network fragility can increase by about 50% when those correlations are modeled instead of treating bridges independently.[5][6]
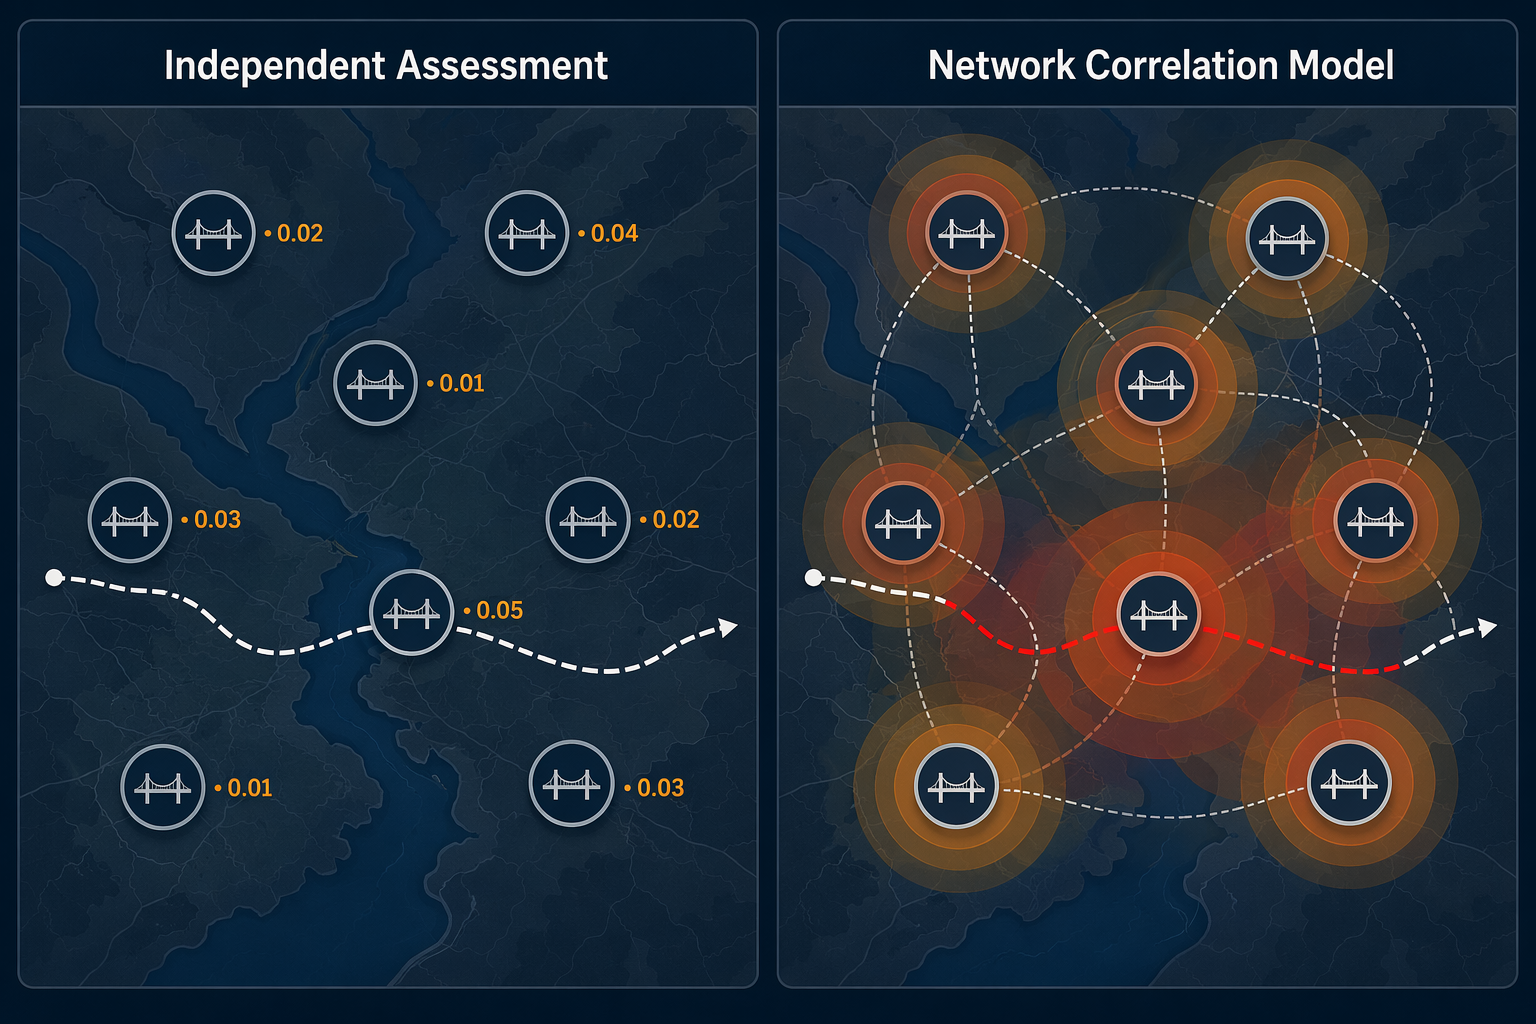
For a logistics planner, that is not a methodological footnote. It changes the business answer. A route that looks acceptable when each bridge is scored independently may become a concentrated exposure when the crossings are evaluated as a correlated portfolio. The difference can decide whether a company keeps a lane as primary, pre-qualifies a longer but more resilient alternate, changes inventory posture for a dependent supplier, or raises a retrofit discussion with a public-sector partner.
The frustrating part is that many supply chain risk maps still reward visibility over decision quality. A red dot on a hazard map can tell an executive that a region is risky. It does not necessarily tell the transportation desk whether Route A and Route B share the same bridge-network exposure, whether two suppliers that look geographically diversified still depend on the same seismic corridor, or whether a detour plan is just moving freight from one fragile bridge cluster to another.
What the AI techniques actually add
The useful AI contribution is not magic prediction. It is faster screening, better network representation, and a more practical way to turn bridge engineering data into route intelligence. The evidence is strongest before a disruption: ranking exposure, comparing routes, and prioritizing deeper engineering review. It is weaker for real-time, bridge-specific post-earthquake classification at broad commercial scale.
| Technique | What it contributes to supply chain planning | Evidence strength |
|---|---|---|
| Surrogate artificial neural networks | Accelerate seismic reliability and fragility assessment across bridge networks; support retrofit prioritization ranking | Strongest for pre-disruption screening and prioritization |
| Covariance matrix models | Capture correlated bridge demand across a regional network so route exposure is not understated | Strong evidence from one important 2024 study; should be treated as compelling but not yet broadly replicated |
| Computer vision | Classify visible earthquake damage from imagery after an event | Promising for rapid damage assessment, but the clearest published accuracy benchmark is building-level rather than bridge-specific |
Surrogate neural networks make network screening cheaper to run
Traditional seismic reliability analysis can be computationally heavy when the planner wants to compare many routes, many bridge portfolios, and many retrofit scenarios. That matters because supply chain decisions are rarely about one heroic calculation. They are about screening hundreds or thousands of origin-destination lanes, asking which ones deserve attention before budget, engineering time, or carrier capacity is committed.
Chen, Mangalathu, and Jeon’s 2022 work addresses that bottleneck directly. Their machine learning-based approach uses surrogate artificial neural network models to compute seismic reliability of bridge networks at significantly lower computational cost than traditional methods, while enabling ranking for retrofit prioritization.[7]
For supply chain use, the retrofit ranking point is just as important as the speed point. A transportation or procurement team does not own most bridges. It cannot inspect, certify, or repair them. But it can identify which supplier lanes depend on high-consequence crossings, which alternate routes reduce correlated exposure, and which infrastructure dependencies should be brought into business-continuity conversations with port authorities, highway agencies, insurers, or strategic suppliers.
A reasonable workflow is not to let the neural network “approve” a bridge. It is to use the model as a screening engine. Low-risk routes can stay in the standard guide. Medium-risk routes can require validated alternates and carrier capacity checks. High-risk routes can trigger engineering review, supplier-buffer review, or a retrofit-prioritization discussion. That separation matters: screening is not inspection, and prioritization is not certification.
Correlation models stop the route guide from lying politely
The covariance matrix finding deserves extra attention because it exposes a common planning error. If each bridge on a route is assessed as though its seismic demand were independent, the model can make the network look more resilient than it is. The route guide then carries a false sense of diversification: multiple crossings, multiple path segments, maybe even multiple carriers, but all exposed to a shared regional shock.
In practical terms, the planner needs a route-exposure score that asks different questions from a normal lane-performance dashboard. Which bridges sit on the primary path? Which bridges sit on the planned detour? Which ones are likely to experience correlated demand? If the primary route fails, does the alternate route actually reduce fragility exposure, or does it use another crossing in the same correlated bridge portfolio?
This is where the approximately 50% network-fragility increase in Zhong et al. becomes operationally irritating in the right way.[5][6] It suggests that existing infrastructure risk work may be giving executives comfort by undercounting the very dependency that matters most in a regional earthquake: simultaneous or related degradation across a bridge network.
The better output is not just a bridge score. It is a lane score with dependency logic attached: primary crossing exposure, detour crossing exposure, supplier dependence, carrier operating constraints, port or terminal access, and confidence level. A planner can use that to compare options before a disruption instead of discovering the shared exposure during the 5 a.m. reroute call.
Computer vision is promising, but the bridge-specific evidence is thinner
Computer vision has a role after an earthquake, especially when imagery is available faster than field reports. Miura et al.’s work, described by ASCE Civil Engineering in 2020, reported 94% accuracy classifying earthquake damage from aerial images and the ability to process more than 10,000 structures in minutes.[8]
That is a meaningful benchmark, but it should not be oversold into bridge operations. The cited accuracy is for building-level damage classification, not at-scale bridge-specific damage classification. Bridge-focused AI inspection efforts are developing: South Dakota State University’s BrDATs project applies artificial intelligence to improve bridge inspections, and University of Washington research is using AI with National Bridge Inventory data to support critical-infrastructure safeguarding.[9][10] The available published material does not provide a bridge-specific accuracy benchmark at similar scale to the 94% building-level figure.
For supply chain teams, that means computer vision can support situational awareness and triage, but it should not be treated as a stand-alone post-earthquake clearance decision. A control tower can ingest imagery-derived damage signals, but the freight release decision still depends on public authority closures, engineering inspection, carrier safety rules, and actual road access.
How bridge seismic screening becomes route intelligence
The integration problem is usually less glamorous than the model. A bridge-risk score becomes useful only when it attaches to the objects supply chain teams already manage: lanes, carriers, suppliers, ports, plants, DCs, inventory policies, and event playbooks.
A workable integration path starts by geocoding the route network, not by drawing a regional hazard blob. Primary and alternate routes need to be mapped to bridge assets along the path. Supplier lanes need the same treatment, including inbound legs that may be invisible to the buying company but critical to a sub-tier part flow. Then AI-generated bridge fragility and correlation outputs can be translated into route-level exposure tiers.
| Supply chain object | Bridge-risk input | Decision it can support |
|---|---|---|
| Primary transportation lane | Bridge fragility score and correlated-network exposure | Keep as primary, require alternate, or redesign lane guide |
| Alternate route | Overlap with the same correlated bridge portfolio | Validate whether the detour actually reduces exposure |
| Strategic supplier lane | Exposure of inbound and outbound corridors | Adjust supplier risk score, buffer policy, or qualification priority |
| Port or terminal plan | Bridge dependencies for access roads and drayage corridors | Pre-plan diversion terminals and drayage capacity |
| Retrofit or public-sector engagement list | Network consequence ranking from surrogate reliability models | Prioritize discussion around crossings with high logistics consequence |
The most valuable output is often a comparison, not an absolute prediction. If Lane 1 and Lane 2 have similar cost and transit time, but Lane 2 avoids a correlated cluster of seismically vulnerable bridges, that difference belongs in procurement and transportation sourcing. If the only viable alternate route depends on the same regional bridge portfolio, the company should not count it as a true contingency route.
A knowledge graph-style model can help here because bridges are dependency nodes, not just map features. A supplier can connect to a plant through a sequence of carriers, terminals, roads, and bridges. When a bridge-risk score changes, the graph can show which products, suppliers, purchase orders, and customer commitments inherit that exposure. That is a different class of answer from “there is seismic risk in this region.”
The same logic applies to control towers. A control tower that only displays a risk layer leaves the planner to do the hard work manually. A more useful setup converts the bridge-risk layer into lane exceptions, supplier watchlists, alternate-route validation, inventory alerts, and playbook tasks assigned to transportation, procurement, and customer-service owners.
Where commercial platforms fit in Q3 2026
Commercial supply chain risk platforms are already moving in the right direction, even if bridge-level seismic fragility is not clearly marketed as a distinct module. Marsh McLennan launched Sentrisk in May 2024 as an AI-powered supply chain risk solution that uses capabilities including supplier mapping, risk analytics, and event monitoring.[11] Everstream Analytics describes AI-driven supply chain risk management using large-scale external data, predictive analytics, and disruption monitoring.[12] Resilinc’s EventWatchAI is also commonly positioned among supply chain risk platforms using multi-source monitoring.[13]
Those platforms show the pathway: natural hazards, supplier sites, logistics nodes, and external event data can already enter risk workflows. The open question is whether bridge-level seismic fragility and correlated network exposure are available as explicit data products, custom layers, or partner integrations. The research brief supports that as an integration opportunity, not as a claim that every platform already offers a bridge seismic module out of the box.
Everstream reports benefits including a 5% freight cost reduction, a 30% revenue-loss reduction, and 50% to 70% faster impact assessment from AI-driven risk management.[12] Those figures are useful directional claims, but they are vendor-published rather than independently audited in the materials provided. They should help frame a business case, not close it.
A practical vendor-shortlisting question is therefore simple: can the platform ingest bridge-level infrastructure dependency data and use it to change workflow outcomes? If the answer is only “we can show a hazard map,” the tool may improve awareness without improving the route guide. If the answer includes lane scoring, dependency mapping, correlated exposure, alert thresholds, alternate-route comparison, and tasking, then the platform is closer to operational adequacy.
What is credible now, and what is not
In Q3 2026, AI bridge seismic screening is credible enough for pre-disruption planning. Surrogate neural networks can reduce the computational burden of bridge-network reliability assessment and support retrofit prioritization. Covariance matrix models can expose correlated network fragility that independent bridge scoring may understate. Together, those techniques can produce route exposure rankings that are good enough to prioritize attention, even when they are not substitutes for engineering inspection.
The strongest use cases are lane-risk tiering, supplier-route exposure scoring, alternate-route validation, port-access contingency design, and prioritization of deeper engineering review. Those are planning decisions where a screened risk tier, confidence band, and dependency map can improve action before the earthquake occurs.
The weaker claim is real-time bridge clearance after an earthquake. Computer vision can process imagery quickly, and building-level earthquake damage classification has reported strong accuracy, but bridge-specific post-event classification still needs more published at-scale evidence. A supply chain team can use those signals to triage and communicate uncertainty, not to override road closures or engineering judgment.
The planning standard should be operational adequacy. Does the model reveal that two “different” routes share the same correlated bridge exposure? Does it identify which supplier lanes depend on fragile crossings? Does it help decide where an alternate route, inventory buffer, carrier commitment, or retrofit conversation is worth the cost? If it cannot turn infrastructure dependency data into those decisions, it is another layer on the map. If it can, bridge seismic risk finally becomes part of supply chain route intelligence rather than a surprise embedded in the road.
References
- Baltimore Bridge Collapse Impacts Supply Chains — Clarkston Consulting
- Baltimore Bridge Collapse Tests U.S. Supply Chains — Council on Foreign Relations
- Supply chain vulnerability: An analysis of the impact of earthquakes using micro data — CEPR/VoxEU, 2013
- Earthquakes highlight imperative nature of supply chain risk mitigation — L Wood Insurance, 2023
- Regional seismic fragility of bridge network derived by covariance matrix model of bridge portfolios — Engineering Structures, 2024
- Seismic vulnerability of bridge networks: Advancing risk assessment with demand correlation modeling — Advances in Engineering
- Machine Learning–Based Seismic Reliability Assessment of Bridge Networks — ASCE Journal of Structural Engineering, 2022
- AI makes quick work of earthquake damage assessment — ASCE Civil Engineering, 2020
- Bridge safety: Using artificial intelligence to improve bridge inspections — South Dakota State University, 2022
- Safeguarding Washington's critical infrastructure — University of Washington, 2024
- Marsh McLennan launches AI-powered solution to transform supply chain risk management — Marsh McLennan, May 2024
- Artificial intelligence's role in supply chain risk management — Everstream Analytics
- Top 10 Supply Chain Risk Platforms — Supply Chain Digital
Comments
Join the discussion with an anonymous comment.