Why Most Logistics ML Initiatives Stall Before They Start
The gap between intention and execution in logistics AI is not a technology problem. A 2025 survey by ABI Research found that 94% of supply chain organizations plan to deploy AI for decision support within two years. Yet Gartner's 2025 data shows that only 23% have a formal AI strategy in place. That 71-point gap represents thousands of stalled or failed initiatives — not because the algorithms don't work, but because the organizations behind them skip the unglamorous preparation work that determines whether a model ever sees production.
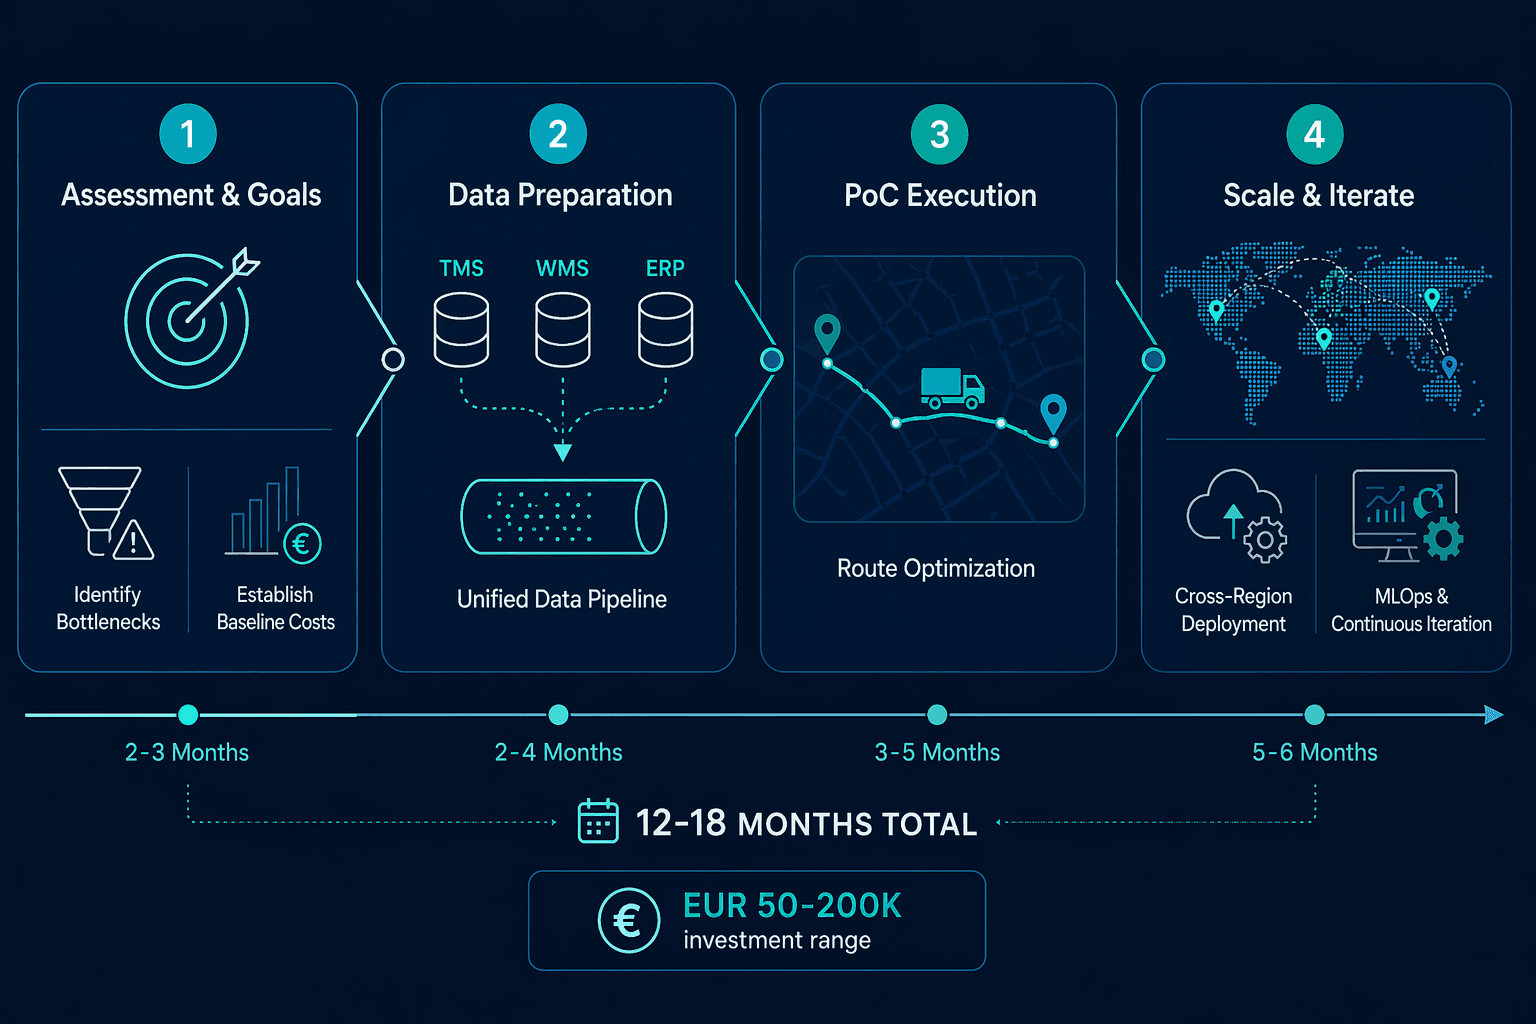
This roadmap is written for the VP of Supply Chain, Logistics Director, or Operations Director at a mid-market logistics company or 3PL who is evaluating machine learning for the first time. It assumes you have budget approval or are building a business case, and it assumes you need a realistic, phased plan — not a vendor pitch or a generic list of use cases. The four-phase structure below reflects how successful mid-market deployments actually happen: assess, prepare, prove, scale.
Phase 1: Assessment and Goal Setting — Know Where You Stand Before You Move
Before you evaluate a single vendor or write a line of code, you need a quantified baseline of your current operations. Without this, you cannot measure ROI, prioritize use cases, or defend the investment to your CFO. Phase 1 typically takes four to six weeks and involves three workstreams: bottleneck identification, cost baseline creation, and maturity benchmarking.
Identify Your Operational Bottlenecks
Start with the data you already have. Pull six to twelve months of operational records from your TMS, WMS, and ERP. Look for patterns in:
- Empty miles and backhaul utilization — the industry average hovers around 30% empty miles, per MIT CTL research. Uber Freight uses ML to reduce that to 10-15%.
- On-time delivery rates and dwell time at loading docks.
- Unplanned downtime for fleet vehicles — 82% of companies experience at least one unplanned downtime event per year, costing manufacturers an estimated $50 billion annually.
- Inventory accuracy and stockout frequency.
- Last-mile delivery cost as a percentage of total shipping cost — it accounts for over 50% of total shipping costs in many networks.
Quantify Your Baseline Costs
For each bottleneck, calculate the current cost in clear, repeatable metrics: cost per mile, cost per stop, dwell time per stop, maintenance cost per vehicle per month, and inventory carrying cost as a percentage of inventory value. These numbers become your pre-ML baseline. Without them, you cannot calculate payback period or ROI — and you will have no defense when a stakeholder asks, "Did this actually save us money?"
Benchmark Your AI Maturity
Use a maturity model to assess where your organization sits on the spectrum from manual operations to AI-driven decision-making. Gartner's supply chain AI maturity framework is a useful reference here. Most mid-market logistics companies fall into the "exploratory" or "pilot" stages. Knowing your starting point prevents you from adopting a deployment plan designed for an enterprise that already has a data science team and a unified data lake.
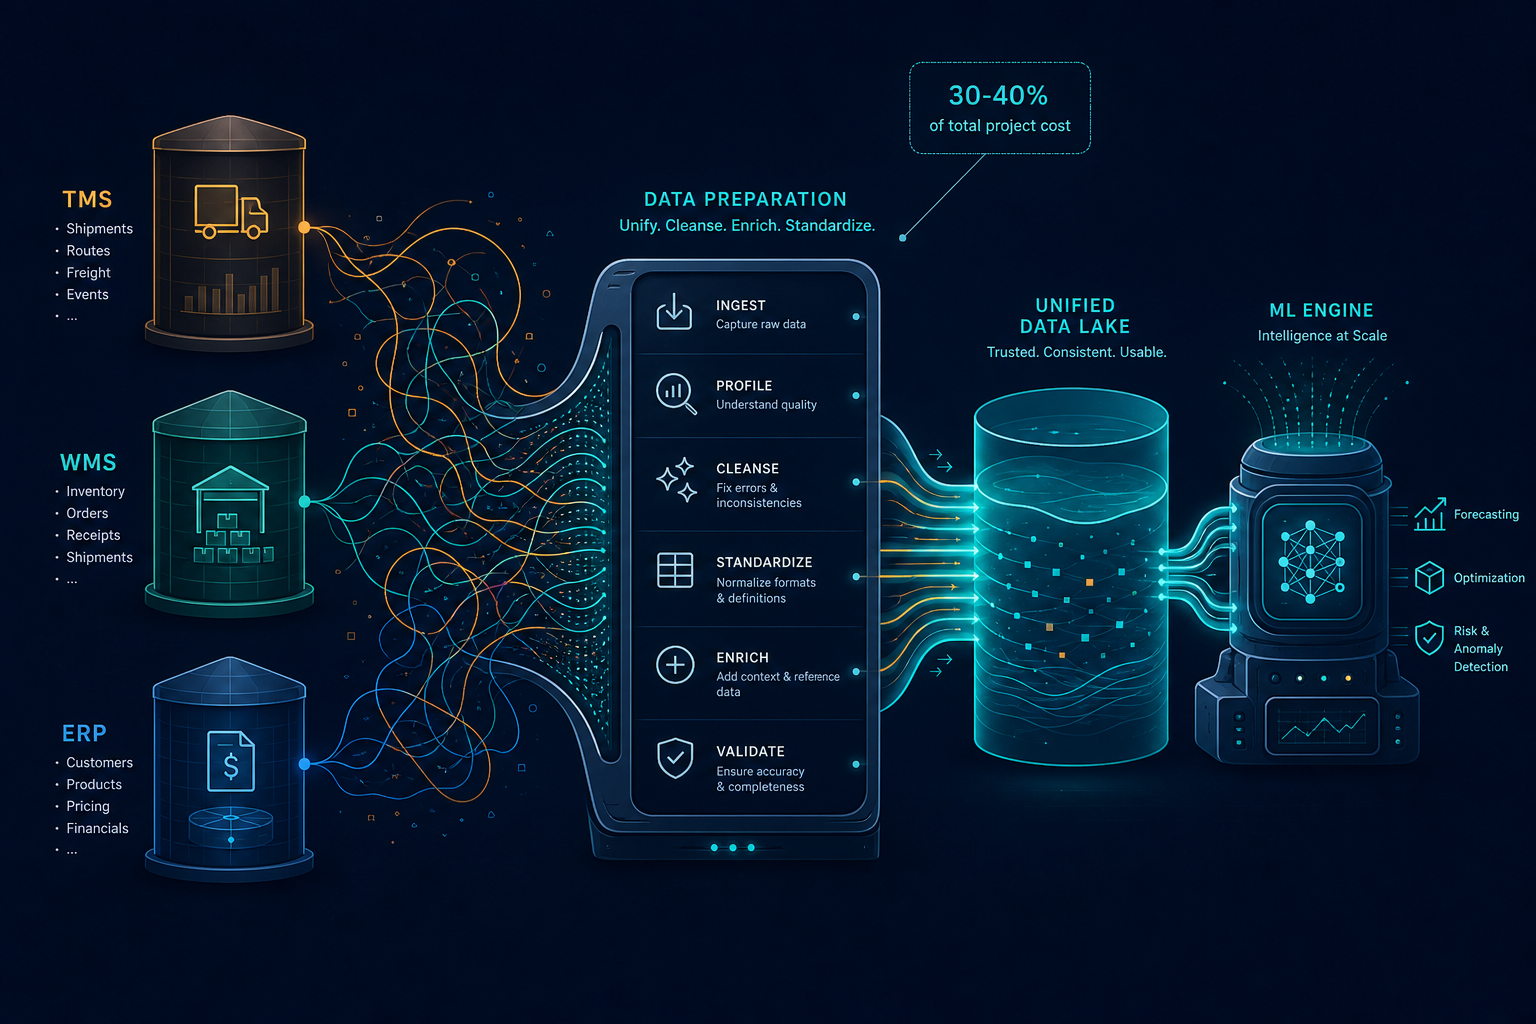
Phase 2: Data Preparation and Infrastructure — The Unsexy Foundation That Determines Success
Data integration is the single largest underestimated line item in logistics ML projects. According to The Thinking Company's 2026 guide, data integration with legacy TMS, WMS, and ERP systems typically consumes 30-40% of total project cost. This is not a phase you can shortcut. Every hour spent cleaning and unifying data in Phase 2 saves ten hours of debugging model outputs in Phase 3.
Conduct a Data Audit
Before you build any pipelines, audit the data you have. Use this checklist:
- TMS data: Are stop times, distances, and route assignments recorded consistently across all regions? Are there gaps in GPS or telemetry data?
- WMS data: Is inventory location data accurate to the bin level? What is your current inventory accuracy percentage? (AI-driven systems can push this to 99.8%, but the model needs clean input data to start.)
- ERP data: Are purchase orders, sales orders, and financial data structured in a way that allows joins with operational data? Are there duplicate or orphaned records?
- Master data: Are customer addresses, supplier IDs, and product codes standardized? Inconsistent master data is one of the most common reasons logistics ML models fail in production.
Build a Unified Data Pipeline
Your ML model needs a single source of truth. That means building an ETL (extract, transform, load) pipeline that pulls data from your TMS, WMS, and ERP into a unified data lake or warehouse. This is not a trivial engineering task. Most mid-market companies lack the in-house data engineering talent to do this well — more than 90% of organizations report insufficient talent and skills to digitally enable their organization, per industry surveys. Consider whether you need to hire a data engineer, engage a systems integrator, or use a platform that offers pre-built connectors for your specific TMS and WMS.
| Data Source | Typical Quality Issues | ML Impact if Unresolved |
|---|---|---|
| TMS | Inconsistent stop times, missing GPS pings, route duplication | Route optimization models produce infeasible schedules |
| WMS | Stale inventory counts, incorrect bin locations, missing SKU data | Demand forecasting and inventory optimization models fail |
| ERP | Orphaned purchase orders, inconsistent supplier IDs, date format mismatches | Cost-to-serve and procurement analytics are unreliable |
| Master Data | Duplicate customer records, non-standardized addresses | Last-mile optimization and ETAs are inaccurate |
Phase 3: Build a PoC on the Use Case with the Clearest ROI Signal
With clean data and a unified pipeline in place, you are ready to prove that ML can deliver measurable value. The key to Phase 3 is choosing the right first use case. For mid-market logistics companies, route optimization consistently offers the fastest payback and the clearest ROI signal.
Why Route Optimization First
Route optimization has three advantages as a first PoC: it uses data you already have (stop locations, time windows, vehicle capacities, driver hours), it produces results that are immediately visible to operations teams (fewer miles driven, fewer hours on the road), and it has a well-documented ROI. According to industry benchmarks from The Thinking Company (citing Gartner 2025 data), route optimization for a 500-vehicle fleet requires an investment of EUR 80-150K, generates EUR 1.5-3M in annual savings, achieves payback in 2-4 months, and delivers a 3-year ROI of 800-1,200%.
Alternative first-PoC candidates include predictive fleet maintenance and last-mile optimization. The table below compares them on the dimensions that matter for a mid-market first deployment.
| Use Case | Investment Range | Annual Savings | Payback Period | 3-Year ROI | Data Complexity |
|---|---|---|---|---|---|
| Route Optimization | EUR 80-150K | EUR 1.5-3M | 2-4 months | 800-1,200% | Medium |
| Predictive Fleet Maintenance | EUR 60-120K | EUR 400-800K | 4-8 months | 300-500% | High (requires sensor/telemetry data) |
| Last-Mile Optimization | EUR 50-100K | EUR 300-600K | 4-7 months | 250-400% | Medium-High (requires real-time traffic data) |
PoC Scope and Success Criteria
Scope your PoC tightly. Pick a single region, a single fleet type, or a single distribution center. Define success criteria before the model runs: a target reduction in miles driven (e.g., 8-12%), a target improvement in on-time delivery (e.g., 5-10 percentage points), or a target reduction in fuel cost per mile. The PoC should run for three to six months, including one month of baseline measurement, two to three months of model training and validation, and one to two months of live parallel testing where the model's recommendations are compared against dispatcher decisions.
During the PoC, track not just model performance but also operational adoption. Are dispatchers using the recommendations? Do they trust the outputs? If workforce adoption drops below 60%, the model may be technically correct but operationally useless. The Thinking Company notes that without dedicated change management, workforce adoption rates can fall to 40-60%, versus the 85-95% typically assumed in business cases.
Phase 4: Scale and Iterate — From Pilot to Enterprise Deployment
A successful PoC buys you the credibility to expand. But scaling is not simply a matter of running the same model on more data. The transition from pilot to enterprise deployment introduces new challenges: infrastructure cost, model monitoring, organizational change, and portfolio economics.
Apply a Scaling Factor to Cost Projections
When projecting the cost of expanding from a single-region PoC to full fleet coverage, apply a 70-80% scaling factor. That is, if your PoC cost EUR 100K, expect the full deployment to cost roughly 70-80% of that per additional region or fleet, not 100%. The infrastructure investment (data pipeline, model training infrastructure, monitoring tools) is largely fixed and gets amortized across more vehicles and routes.
Build a Portfolio Business Case
Once you have proven route optimization, you can add adjacent use cases — predictive maintenance, demand forecasting, cost-to-serve analytics — without rebuilding the data pipeline from scratch. The Thinking Company reports that portfolio ROI is typically 40-60% higher than individual use case ROI because the infrastructure investment is shared. Your business case for Phase 4 should present a multi-year portfolio view, not a single-use-case payback calculation.
Introduce MLOps for Model Monitoring
Models that perform well in a PoC can degrade in production as operational patterns shift — new customers, seasonal demand changes, fleet composition changes, road network changes. You need MLOps (machine learning operations) to monitor model performance, detect drift, and trigger retraining. For a mid-market company, this does not mean hiring a dedicated MLOps engineer. It means choosing a platform that includes automated monitoring and retraining capabilities, and assigning one team member to review model performance reports monthly.
Invest in Change Management
The most common reason scaled deployments underperform is not technical failure — it is workforce resistance. Dispatchers who have been routing trucks manually for fifteen years will not trust an algorithm's recommendations overnight. Budget EUR 500-1,500 per affected worker for training, transition support, and change management. This includes hands-on workshops, shadowing periods where the model's recommendations are reviewed by a human before execution, and clear escalation paths when the model produces a recommendation that seems wrong.
Realistic Cost, Timeline, and ROI Expectations for Mid-Market Logistics
The following table consolidates the cost, timeline, and ROI expectations discussed across all four phases. Use it as a reference when building your business case or setting stakeholder expectations.
| Metric | Range | Source / Notes |
|---|---|---|
| Total investment (mid-market) | EUR 50-200K | Varies by fleet size, data complexity, and use case scope |
| Timeline to initial ROI | 12-18 months | Includes 4-6 weeks assessment, 8-12 weeks data prep, 3-6 months PoC |
| Timeline to full portfolio ROI | 2-4 years | Deloitte 2025: only 6% see ROI in under a year; most achieve satisfactory returns in 2-4 years |
| Logistics cost reduction | 5-20% | McKinsey 2024, AI-enabled distribution |
| Inventory reduction | 20-30% | McKinsey 2024, AI-enabled distribution |
| Procurement spend reduction | 5-15% | McKinsey 2024, AI-enabled distribution |
| Profitability advantage (AI-mature firms) | 23% more profitable | Accenture 2024, analyzing 1,148 companies across 10 industries |
| Route optimization 3-year ROI | 800-1,200% | The Thinking Company / Gartner 2025, 500+ vehicle fleets |
| Predictive maintenance 3-year ROI | 300-500% | The Thinking Company / Gartner 2025 |
| Last-mile optimization 3-year ROI | 250-400% | The Thinking Company / Gartner 2025 |
Common Pitfalls and How to Avoid Them
Even with a structured roadmap, execution risks remain. The following pitfalls account for the majority of stalled or failed logistics ML initiatives. Each comes with a specific countermeasure.
- Underestimating data integration effort. Countermeasure: Budget 30-40% of total project cost for data integration before you start. If that number shocks your stakeholders, your project scope is too large for your data readiness level.
- Skipping change management. Countermeasure: Include EUR 500-1,500 per affected worker in your budget from day one. Treat workforce adoption as a KPI equal in importance to model accuracy.
- Choosing the wrong PoC use case. Countermeasure: Pick the use case with the shortest payback period and the most visible operational impact. For most mid-market logistics companies, that is route optimization.
- Expecting ROI in under a year. Countermeasure: Set stakeholder expectations for 12-18 months to initial ROI and 2-4 years to full portfolio ROI. Deloitte's 2025 data shows that only 6% of organizations see AI ROI in under a year.
- Building a model in isolation from operations. Countermeasure: Include dispatchers, warehouse managers, and drivers in the PoC design phase. Their domain knowledge will surface edge cases your data scientists would never anticipate.
Your First 90-Day Action Plan
The following 90-day plan translates the four-phase roadmap into concrete, time-bound tasks. It is designed for a mid-market logistics company with no existing ML infrastructure and a team of one to three people leading the initiative.
| Weeks | Phase | Key Tasks | Deliverables |
|---|---|---|---|
| 1-4 | Assessment | Identify top 3 operational bottlenecks; calculate baseline cost per mile, per stop, and dwell time; benchmark AI maturity using Gartner framework; interview dispatchers and warehouse managers to document current decision processes. | Bottleneck prioritization document; baseline cost spreadsheet; maturity assessment score. |
| 5-8 | Data Preparation | Audit TMS, WMS, and ERP data quality; identify missing fields and inconsistent master data; scope data pipeline requirements; decide build vs. buy for data integration. | Data audit report with gap analysis; pipeline architecture decision document. |
| 9-12 | PoC Design | Select PoC use case (route optimization recommended); define success criteria and KPIs; shortlist 2-3 vendors or platform options; prepare PoC budget and timeline for stakeholder approval. | PoC design document with scope, success criteria, vendor shortlist, and budget. |
At the end of 90 days, you should have a clear answer to three questions: Which operational bottleneck will we attack first? Do we have the data quality to support an ML model? And what vendor or platform will we use for the PoC? If the answer to any of these is unclear, extend the assessment or data preparation phase rather than rushing into a PoC with weak foundations. The companies that succeed in logistics ML are not the ones that move fastest — they are the ones that prepare most thoroughly.
Comments
Join the discussion with an anonymous comment.