Why Traditional Forecasting Tools Fail at Enterprise Scale
Most organizations running demand planning on traditional statistical methods — moving averages, exponential smoothing, ARIMA — operate with a structural disadvantage. These models treat each SKU-store combination as an independent time series, assuming that past sales patterns will repeat in a stable environment. In practice, that assumption breaks under the conditions that define modern supply chains: frequent promotions, cross-product substitution, multi-channel demand, and external volatility.
The result is a persistent accuracy gap. Industry benchmarks compiled by Gartner and cited by ThroughPut.AI place the median forecast error for Food & Beverage at approximately 25%, while durable consumer products can see error rates reaching 50%. The International Journal on Science and Technology reports that traditional forecasting error rates typically fall in the 25–40% range. When 58% of brands report inventory accuracy below 80%, and only 35% of businesses feel confident in their inventory forecast accuracy, the gap between what planning teams need and what legacy tools deliver is not a minor inconvenience — it is a direct driver of excess inventory, stockouts, and expedited freight costs.
The limitations are not just about accuracy percentages. Traditional tools update on weekly or monthly cycles, making them blind to short-term demand shifts that AI-based demand sensing can detect in near real time. They cannot ingest external signals — weather data, economic indicators, social media trends — that correlate with demand changes. And they offer no mechanism to learn from forecast errors automatically; each cycle starts from the same static assumptions.
These structural weaknesses explain why, according to Gartner data cited by Kanerika, 45% of companies have already adopted AI in demand forecasting and another 43% plan to do so within two years. The shift is not experimental — it is a response to a demonstrated ceiling on what statistical methods can achieve in complex, multi-variable environments.
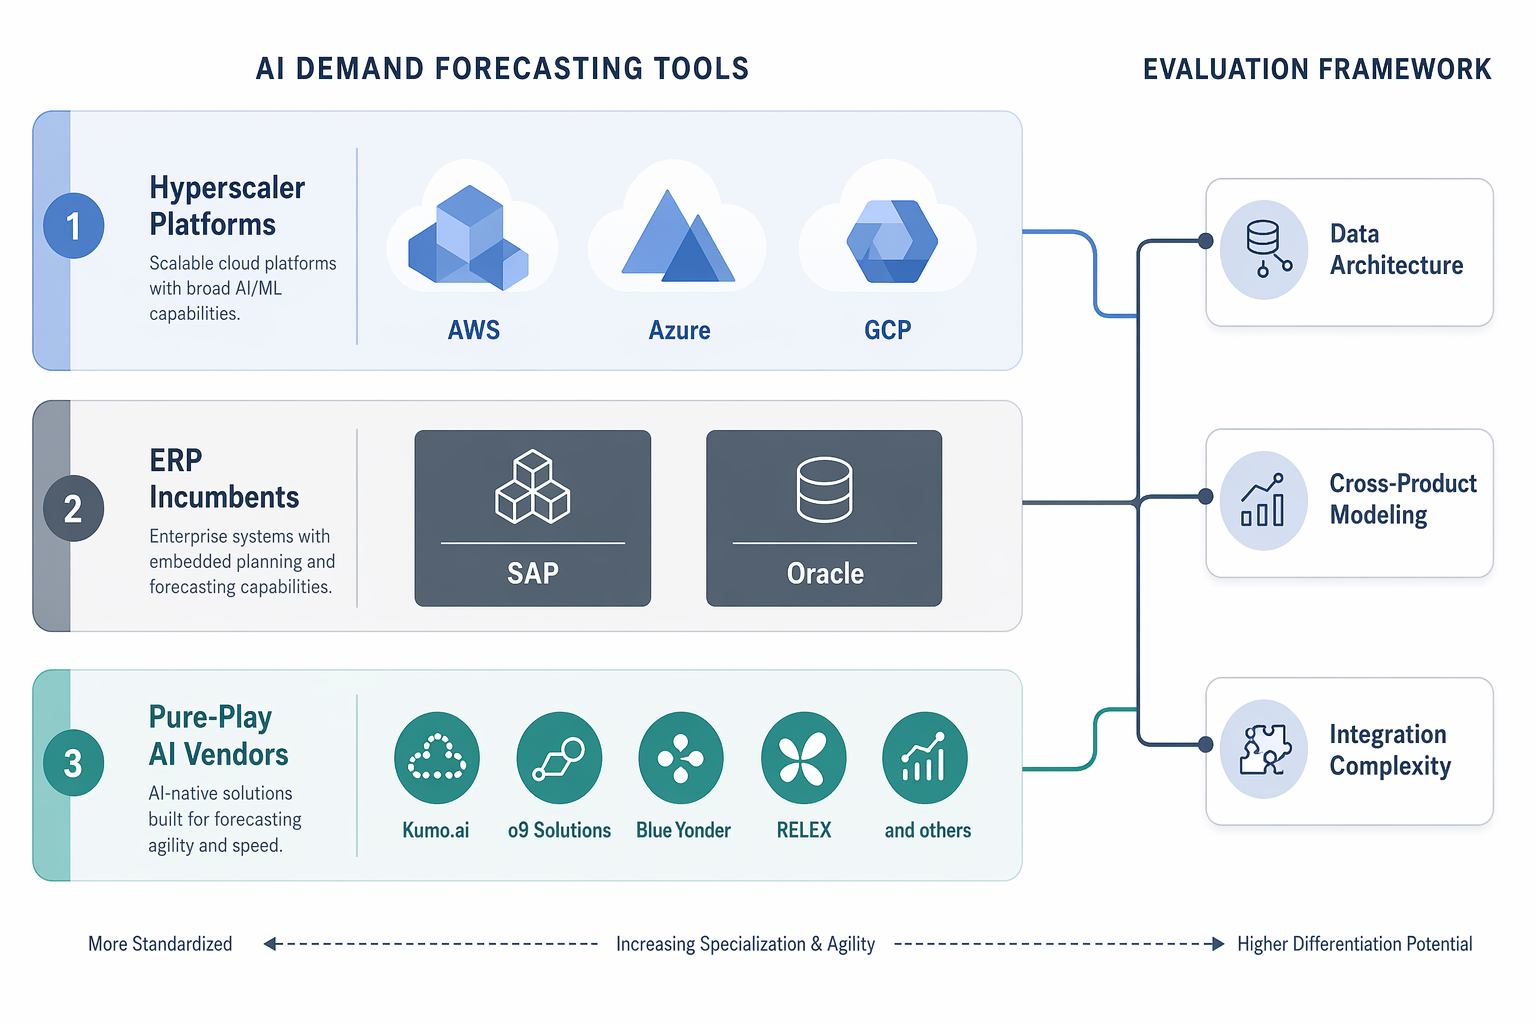
The AI Forecasting Landscape: Three Tiers of Vendors
The AI demand forecasting vendor ecosystem has matured into three distinct tiers, each with different trade-offs in capability, integration complexity, and total cost of ownership. Understanding these tiers is the first step in narrowing the field before detailed evaluation.

| Tier | Representative Vendors | Core Strength | Typical Trade-off |
|---|---|---|---|
| Hyperscaler Platforms | AWS Forecast, Google Cloud Vertex AI, Azure Machine Learning | Elastic infrastructure, native data pipeline integration, pay-as-you-go pricing | Requires in-house ML expertise; limited supply-chain-specific features out of the box |
| ERP Incumbents | SAP IBP, Blue Yonder, Kinaxis Maestro, Oracle SCM | Deep ERP integration, embedded S&OP/IBP workflows, enterprise-grade security | Longer implementation timelines (6–18 months); higher total cost of ownership; less flexibility for custom modeling |
| Pure-Play AI Vendors | o9 Solutions, RELEX, Kumo.ai, Anaplan, DataRobot | Purpose-built for demand forecasting; advanced modeling (relational/GNN, AutoML); faster time-to-value in focused deployments | May require separate integration layer; smaller vendors may have limited support for complex enterprise environments |
Hyperscaler platforms appeal to organizations with strong internal data science teams who want to build custom forecasting pipelines on flexible infrastructure. ERP incumbents are the natural choice for enterprises already running SAP or Oracle and prioritizing seamless integration over modeling innovation. Pure-play vendors offer the most advanced AI capabilities — including relational models that capture cross-product effects — but require careful evaluation of integration requirements and vendor stability.
For a detailed feature-by-feature comparison of these vendors, see our AI-Powered Demand Forecasting Tools: A Structured Comparison article, which covers deployment models, integration ecosystems, and pricing structures for each platform.
Key Evaluation Dimensions: Beyond Forecast Accuracy Claims
Every vendor will present a forecast accuracy number. These claims are almost never comparable across tools because they are measured on different datasets, time horizons, and product mixes. No publicly available independent benchmark systematically compares all major AI forecasting tools on identical datasets at SKU-store-week granularity. Evaluating tools on accuracy alone is a trap.
Instead, supply chain leaders should evaluate tools across five structural dimensions that determine whether a platform will deliver value in their specific operational context:
- Data architecture: Does the tool require a single flat table of historical sales data, or can it work with relational, multi-table schemas that represent products, stores, promotions, and suppliers as connected entities? Relational models — particularly graph neural network (GNN) approaches — can capture cross-product substitution and promotional lift interactions that flat-table models miss. On the SAP SALT enterprise benchmark, Kumo.ai reports that its relational model scored 89% accuracy versus 75% for PhD data scientists using XGBoost and 63% for LLM+AutoML approaches.
- Cross-product substitution handling: When a product stocks out, demand shifts to substitutes. Time-series models that treat each SKU independently cannot see this effect. Ask vendors specifically how their model handles substitution — and demand the answer in terms of model architecture, not marketing language.
- Promotional lift modeling: Promotions create demand spikes that cannibalize adjacent SKUs and periods. Does the tool ingest promotional calendars as structured features, or does it treat promotions as unexplained variance? The ability to model halo and cannibalization effects across a category is a strong differentiator between basic and advanced platforms.
- Supplier constraint propagation: If a key supplier faces a disruption, how does the forecast model adjust? Most tools forecast demand independently of supply. Advanced platforms can ingest supplier lead time data and capacity constraints to produce feasible, constrained forecasts rather than unconstrained demand estimates.
- Integration complexity and model explainability: How does the tool connect to your existing ERP, WMS, and POS systems? Can planners see why the model made a specific prediction — which features drove the forecast — or is it a black box? Explainability is not just a nice-to-have; it is a prerequisite for building organizational trust in AI outputs. IBM notes that 90% of executives expect supply chain workflows to include AI assistants by 2026, but trust remains a barrier: 54% of companies cite lack of trust in AI as a barrier to adoption.
For a deeper technical explanation of how time-series and relational models differ under the hood, see our article How AI Demand Planning Software Actually Works.
Vendor Comparison Matrix: Capabilities at a Glance
The following matrix maps eight representative vendors across the evaluation dimensions that matter most for enterprise and mid-market deployments. Use this as a starting point for shortlisting, not as a final recommendation — every organization's data environment, integration landscape, and forecasting requirements are different.
| Vendor | Model Approach | Deployment Model | Target Company Size | Typical Implementation Timeline |
|---|---|---|---|---|
| Kumo.ai | Relational / GNN | Cloud SaaS | Mid-market to Enterprise | 8–16 weeks |
| o9 Solutions | Integrated AI planning platform | Cloud SaaS | Enterprise | 6–12 months |
| Blue Yonder | Supply chain AI + ML | Cloud SaaS / Hybrid | Enterprise | 6–18 months |
| Kinaxis Maestro | Concurrent planning + AI | Cloud SaaS | Enterprise | 6–12 months |
| RELEX | Unified retail planning + ML | Cloud SaaS | Mid-market to Enterprise | 3–6 months |
| Anaplan | Connected planning + scenario modeling | Cloud SaaS | Mid-market to Enterprise | 3–9 months |
| DataRobot | AutoML on flat tables | Cloud SaaS / On-premise | Mid-market to Enterprise | 4–12 weeks |
| SAP IBP | Integrated business planning + ML | Cloud SaaS | Enterprise | 9–18 months |
The global AI-powered demand forecasting market was valued at $7.4 billion in 2025 and is projected to reach $28.6 billion by 2034, growing at a 16.2% CAGR (Dataintelo). Cloud deployments now account for 67.4% of new implementations, up from 51.2% in 2022, and SMEs are the fastest-growing segment at a 20.3% CAGR. These trends confirm that the market is shifting decisively toward cloud-native, AI-first platforms — but the pace of adoption varies widely by industry and company size.
Step-by-Step Selection Framework
The following six-step framework is designed to prevent feature-list-driven decisions and keep the evaluation anchored to business outcomes. Each step builds on the previous one, creating a decision trail that can be audited and revisited as requirements evolve.
- Define business objectives and success metrics. Before looking at any tool, document what you need the forecast to improve: service level, inventory turns, stockout reduction, working capital, or a combination. Attach specific targets and time horizons. McKinsey research shows AI-driven forecasting can reduce errors by 20–50% and product unavailability by up to 65% — but your baseline and target will determine which tools are capable of delivering.
- Assess data architecture and readiness. Map your available data: historical sales at SKU-location-week granularity (minimum 2–3 years), promotional calendar, pricing data, inventory levels, and any external signals you can access. Evaluate data quality — completeness, consistency, timeliness. LatentView notes that a strong data foundation (3–6 months to clean and unify sources) is more important than model sophistication. If your data is fragmented across silos, that is the first problem to solve, not the tool selection.
- Map required capabilities to vendor tiers. Based on your objectives and data environment, determine which vendor tier is the best fit. If you need deep ERP integration and have a long implementation horizon, ERP incumbents may be appropriate. If you need advanced relational modeling and faster time-to-value, pure-play vendors are likely a better match. If you have strong internal ML talent and want maximum flexibility, hyperscaler platforms are worth evaluating.
- Conduct a structured demo with your own data. Vendor demos using curated datasets are designed to showcase strengths. Insist on a proof-of-concept using a representative sample of your actual data — at least 50–100 SKUs across multiple categories and regions, with real promotional history. Measure the vendor's forecast against your current baseline using the same error metrics (MAPE, WAPE, bias). The World Journal of Advanced Engineering Technology and Sciences reports that AI integration can lower WAPE by 40–75% and reduce forecast bias by 30–70% — but those results depend on the fit between the tool and your data.
- Run a controlled pilot with pre-defined KPIs. Select a limited scope — one product category, one region, or one channel — and run the AI forecast in parallel with your existing process for 8–12 weeks. Measure not just accuracy but also business impact: did stockouts decrease? Did inventory turns improve? Did planners trust the AI outputs enough to act on them? The pilot should answer the question: "Does this tool work in our specific operational context?"
- Evaluate total cost of ownership and integration effort. Beyond the license cost, factor in data pipeline development, ERP integration, change management, training, and ongoing model maintenance. Kanerika notes that 85% of AI projects fail due to poor data quality, unclear objectives, and lack of organizational alignment — not because the technology was inferior. A tool that requires six months of data engineering before it can produce a single forecast may have a higher true cost than a more expensive tool that integrates in weeks.
Data Readiness Checklist for AI Forecasting
Data readiness is the single largest determinant of AI forecasting success. The following checklist covers the essential prerequisites. For a comprehensive treatment of data quality, pipeline architecture, and governance, see our Data Readiness Assessment for AI Demand Forecasting Implementation.
- Historical sales data at SKU-location-week granularity for a minimum of 2–3 years. Shorter histories limit the model's ability to learn seasonality and trend patterns. Ensure the data covers normal demand periods, not just promotional or disrupted periods.
- Promotional calendar with lift factors. The model needs to distinguish between baseline demand and promotion-driven spikes. Without structured promotion data, the model will treat promotional periods as unexplained variance.
- Pricing data at SKU-location-week level. Price elasticity is a critical demand driver. If pricing data is not available at the same granularity as sales data, the model will miss a major signal.
- Inventory levels and stockout events. Without inventory data, the model cannot distinguish between "nobody wanted it" and "it was out of stock." Stockout events must be flagged so the model does not learn that demand is zero when inventory is zero.
- External signals where available. Weather data, economic indicators, social media trends, and competitor pricing can improve forecast accuracy, particularly for seasonal or trend-sensitive categories. Start with the signals that have the strongest historical correlation to your demand.
- Data quality metrics. Measure completeness (what percentage of SKU-location-week combinations have valid data?), consistency (are the same metrics defined the same way across systems?), and timeliness (how quickly does data become available for forecasting?). ThroughPut.AI reports that 29% of firms cite data silos and incompatible IT infrastructure as a major barrier to AI forecasting adoption.
Implementation Roadmap: From Pilot to Adaptive Enterprise
AI demand forecasting is not a one-time deployment — it is a capability that matures over time as the model learns from more data, integrates more signals, and becomes embedded in planning processes. The following phased roadmap, adapted from GroupBWT's maturity model and supported by industry benchmarks, provides a realistic progression.

| Phase | Timeline | Scope | Typical Budget | Expected Outcomes |
|---|---|---|---|---|
| Pilot | 0–3 months | 1–2 product categories, 1 region, 50–100 SKUs | $100K–$500K | 10–16% forecast error; proof of concept validated with own data |
| Expand | 6–12 months | Scale to 500+ SKUs, multiple regions, integrate external signals | $500K–$2M | 20–50% error reduction (McKinsey); integrate into weekly S&OP cycle |
| Enterprise | 18–24 months | Full SKU-location coverage, embed into IBP/ERP, connect to procurement and inventory systems | $2M–$5M | Up to 65% reduction in product unavailability; 23% reduction in stockout incidents (Dataintelo) |
| Adaptive | 36+ months | AI as operational core; continuous learning; autonomous planning for stable categories | $5M+ | Real-time demand sensing; automated replenishment for select categories; full organizational trust in AI outputs |
Each phase has specific organizational prerequisites. The pilot requires executive sponsorship, a dedicated data engineer, and a demand planning champion who will advocate for the AI outputs. The expand phase requires cross-functional buy-in from IT (for integration), procurement (for supplier data), and finance (for working capital targets). The enterprise phase requires a formal change management program and retraining of planning teams. The adaptive phase requires ongoing model governance — monitoring for drift, retraining schedules, and human-in-the-loop oversight for exceptions.
Enterprises using AI demand forecasting reported an average 23% reduction in stockout incidents and a 17% decrease in excess inventory carrying costs, according to Dataintelo's 2025 market analysis. These outcomes are achievable, but they depend on following the phased approach rather than attempting a big-bang deployment.
Risk and Governance Considerations in Tool Selection
Selecting an AI forecasting tool is also an exercise in risk management. The following risks should be evaluated as part of the selection process, not after deployment. For readers building a business case alongside selection, our Measurable ROI of AI in Demand Forecasting article provides the financial framework.
- Data quality and model drift: AI models are only as good as the data they train on. If data quality degrades — due to system changes, new product introductions, or shifts in consumer behavior — model accuracy will decline. Ask vendors: What model monitoring and drift detection capabilities do you provide? How is the model retrained, and how often? Is there a mechanism to flag when accuracy drops below a threshold?
- Organizational trust and adoption: A 2025 Gartner survey cited by Dataintelo found that 79% of global supply chain leaders rated demand volatility as their top operational risk, with 68% investing in AI-powered planning tools. Yet 54% of companies cite lack of trust in AI as a barrier. If planners do not trust the forecast, they will override it — negating the accuracy gains. Evaluate the tool's explainability features: Can planners see which features drove a specific prediction? Can they compare AI forecasts against historical baselines? Does the tool provide confidence intervals, not just point estimates?
- Vendor lock-in and data portability: Some platforms store forecast data in proprietary formats that are difficult to export. Before signing, clarify: Can you export raw forecast data, model configurations, and training datasets? What happens to your data if you terminate the contract? Is there a standard API for integrating with other systems, or are you locked into the vendor's ecosystem?
- Model explainability and auditability: For regulated industries (pharma, food safety, financial services), the ability to explain why a forecast was made is not optional — it is a compliance requirement. Ask vendors: Is the model fully explainable (e.g., SHAP values, feature importance), or is it a black box? Can you generate audit trails showing which data inputs and model parameters produced each forecast? Does the vendor provide documentation for model validation and testing?
- Integration complexity and legacy system compatibility: IBM notes that 88% of retail executives say demand forecasting is a key area for improvement through AI, but siloed systems remain a barrier. Evaluate the vendor's integration track record with your specific ERP, WMS, and POS systems. Ask for reference customers with similar tech stacks. If the vendor requires extensive custom integration work, factor that into both the timeline and the total cost of ownership.
The goal of the evaluation and selection process is not to find the "best" AI forecasting tool in the abstract — it is to find the tool that best fits your specific data environment, operational requirements, organizational maturity, and risk tolerance. A structured framework that addresses data readiness, model architecture, integration complexity, and governance will produce a more durable decision than any feature checklist or accuracy claim.
Comments
Join the discussion with an anonymous comment.