Why the Comparison Matters Now: The Disruption Imperative
The operating environment for demand planning has shifted structurally. According to Gartner, 76% of supply chain leaders report that disruptions are more frequent now than they were three years ago. This is not a temporary spike — it reflects a permanent increase in volatility driven by geopolitical realignments, tariff policy swings, climate events, and shifting consumer behavior patterns. Traditional forecasting methods, designed for relatively stable markets with linear demand patterns, are increasingly inadequate for this reality.
The gap between intent and execution is wide. While 94% of supply chain companies plan to use AI for decision support within two years (ABI Research 2025), only 23% have a formal AI strategy in place (Gartner 2025). Most organizations are still operating on a project-by-project basis rather than with a defined investment portfolio. This decision framework is designed to help supply chain leaders and demand planning managers close that gap — by providing a structured, quantifiable comparison between traditional and AI-based forecasting methods, and a clear ROI framework for building a board-level business case.
How Traditional Forecasting Works — and Its Structural Limitations
Traditional demand forecasting methods — moving averages, exponential smoothing, ARIMA, and basic regression models — share a common set of assumptions: that historical patterns repeat in a predictable manner, that relationships between variables are linear, and that external conditions remain relatively stable. These methods were developed in an era when data was scarce, computing power was limited, and supply chains operated with longer lead times and less variability.
The structural limitations of these approaches are well documented. Gartner benchmarks indicate that traditional forecasting error rates typically range from 25% to 40%, with significant variation by industry. In Food & Beverage, the median forecast error sits around 25%, with the upper quartile at 20%. For Durable Consumer Products, error rates can reach up to 50%. These are not edge cases — they represent the baseline performance of conventional methods across large portfolios.
- Inability to integrate external signals: Traditional models rely almost exclusively on internal historical data (order history, shipment records). They cannot incorporate weather patterns, economic indicators, social sentiment, or competitor actions in real time.
- Slow responsiveness: Exponential smoothing and ARIMA models require multiple periods to adjust to a demand shift. In a disruption-prone environment, this lag can mean weeks of misaligned inventory positions.
- Linear pattern detection: These methods assume that past relationships will hold. They fail to capture non-linear interactions, such as the compounding effect of a promotion during a weather event.
- High manual effort: Planners spend a disproportionate amount of time on data cleansing, exception handling, and manual overrides — activities that add little analytical value.
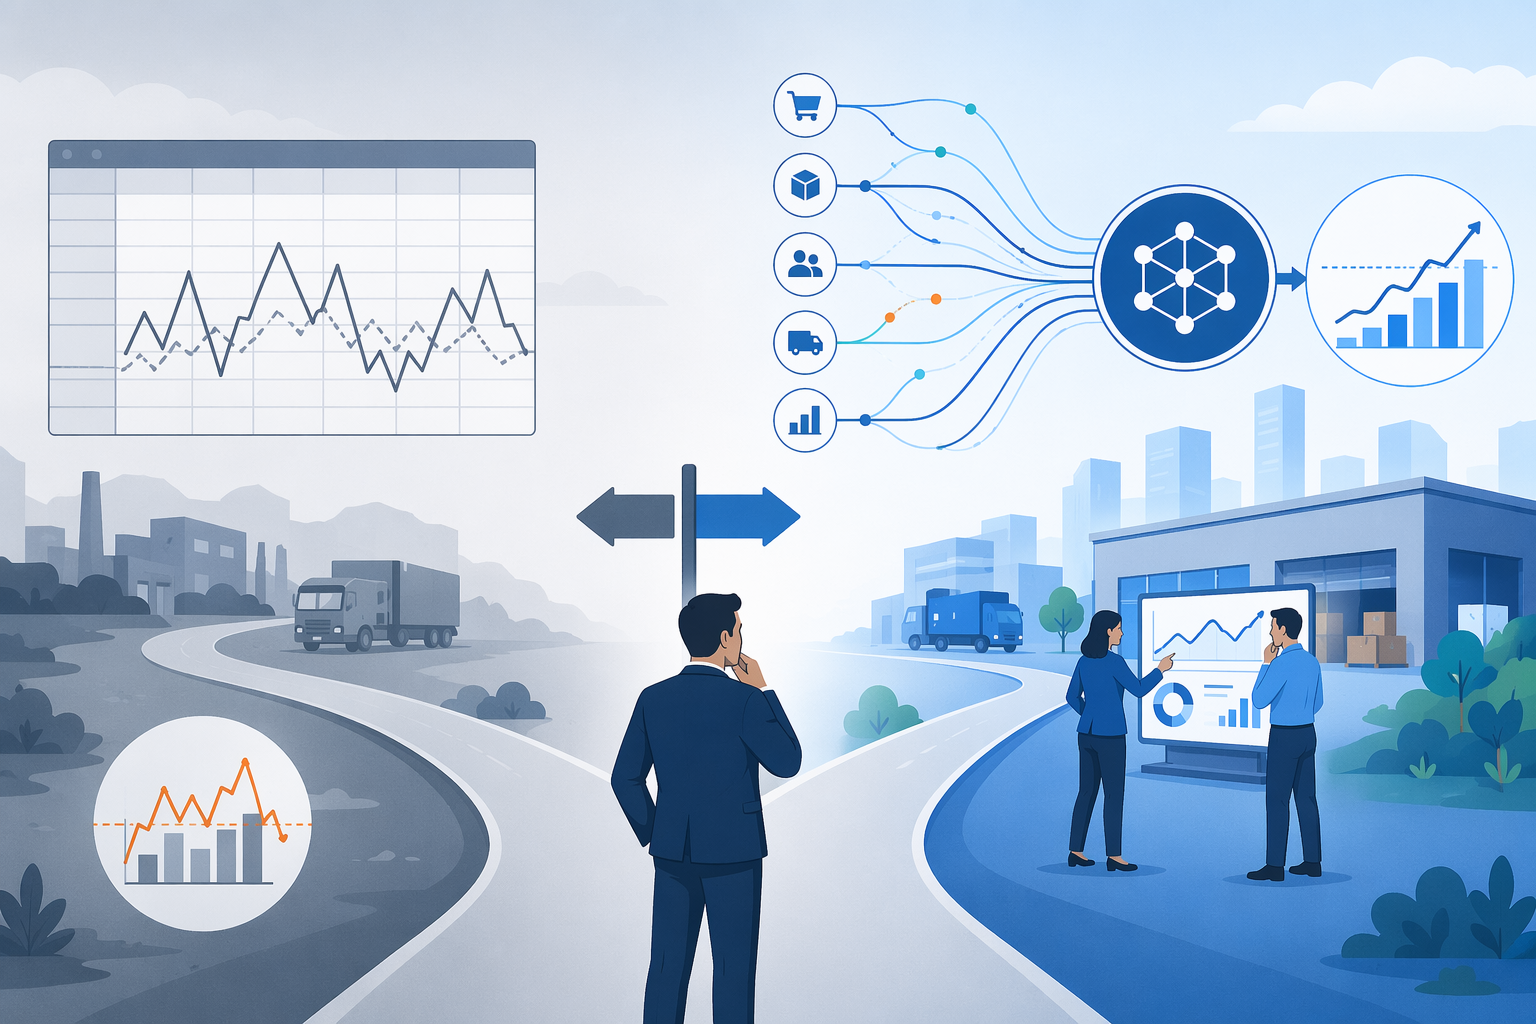
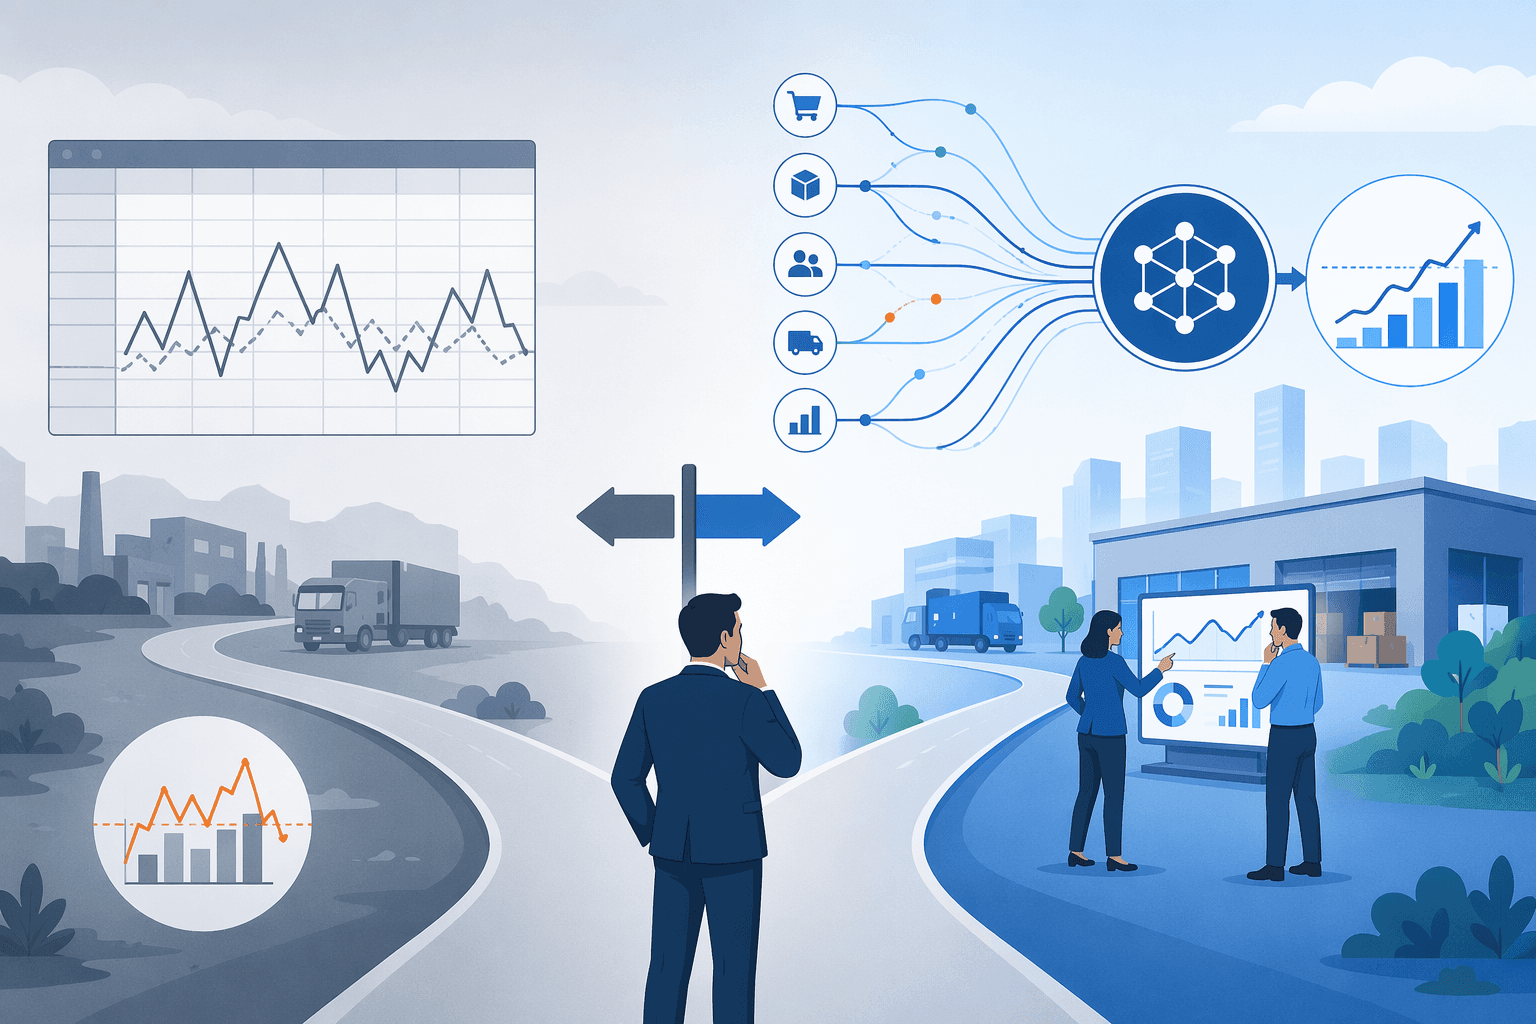
How AI Forecasting Works: Key Technical Differences
AI-based forecasting methods differ from traditional approaches in three fundamental ways: they learn dynamically from data rather than assuming fixed relationships, they detect non-linear patterns that traditional models miss, and they can incorporate a much wider range of input signals — both internal (POS data, promotion calendars, inventory positions, lead times) and external (weather forecasts, economic indicators, market trends, social sentiment).
The core techniques include gradient boosting machines (XGBoost, LightGBM), deep learning architectures (LSTM, Transformers), and hybrid models that combine multiple approaches. Ensemble methods — which blend predictions from several models — typically deliver the most consistent results across heterogeneous product portfolios. These models do not require manual re-specification when demand patterns shift; they adapt continuously as new data becomes available.
A critical distinction to understand is the difference between demand sensing and baseline forecasting. Demand sensing focuses on short-term adjustments (days to weeks) using real-time signals like point-of-sale data and weather. Baseline forecasting looks further ahead (weeks to months) using historical patterns and planned events. AI methods can support both, but they serve different planning horizons and require different data inputs. For a deeper explanation of this distinction, see our Demand Sensing vs. Demand Forecasting glossary entry.
Side-by-Side Comparison: Six Dimensions
The following table provides a structured comparison across six dimensions that matter most for demand planning performance. This is the core artifact that supply chain leaders can use in evaluation meetings and vendor selection processes.
| Dimension | Traditional Forecasting | AI Forecasting |
|---|---|---|
| Data Scope | Internal historical data only (orders, shipments, limited POS) | Internal + external signals: weather, economic indicators, social sentiment, market trends, competitor activity |
| Model Adaptability | Fixed model structure; manual re-specification required when patterns change | Continuous learning; models adapt automatically as new data arrives |
| Responsiveness | Slow (multiple periods to adjust to shifts); lagging indicator | Fast (near real-time adjustments); leading indicator capability |
| Pattern Recognition | Linear; assumes past relationships hold; fails on non-linear interactions | Non-linear; detects complex interactions, seasonality shifts, and causal relationships |
| Output Type | Point forecast (single number); limited confidence intervals | Probabilistic forecast (distribution); scenario-based outputs; confidence bands |
| Manual Effort | High: data cleansing, exception handling, manual overrides consume planner time | Lower: automation of routine adjustments; planners focus on exceptions and strategic decisions |
The differences in data scope and model adaptability are the most consequential. Traditional methods are fundamentally constrained by their reliance on limited internal data and fixed mathematical structures. AI methods, by contrast, can ingest dozens of external data streams and adjust their internal parameters without human intervention. This is not a marginal improvement — it is a different class of capability.
Quantified Accuracy Differential: What the Research Shows
The accuracy gap between traditional and AI methods is substantial and well documented across multiple independent studies. The following table summarizes the key findings from the most frequently cited research.
| Metric | Traditional Methods | AI Methods | Source |
|---|---|---|---|
| Forecast error range | 25–40% | 10–16% | IJSAT 2025; McKinsey |
| WAPE reduction | Baseline | 40–75% reduction | WJAETS 2025 |
| Forecast bias reduction | Baseline | 30–70% reduction | WJAETS 2025 |
| Food & Beverage median error | ~25% | 10–15% (estimated) | Gartner (via ThroughPut) |
| Durable Consumer Products error | Up to 50% | 15–25% (estimated) | Gartner (via ThroughPut) |
Comments
Join the discussion with an anonymous comment.