
The hard part of multi tier supplier mapping with AI is not drawing more nodes on a screen. It is getting past the point where the map depends on every Tier 1 supplier voluntarily explaining who sits behind them, which materials they source, and which relationships they consider commercially sensitive.
That dependency is where many mapping programs stall. A procurement team can ask for sub-tier disclosure, add it to onboarding, and escalate non-response. It still runs into the same structural problem: the companies closest to the buyer may treat their own supplier base as proprietary. Sphera’s 2025 CPO survey, as summarized by JAGGAER, found that Tier 1 suppliers often withhold sub-tier data for that reason.[1]
AI changes the starting point. Instead of waiting for the whole network to self-report, it reconstructs probable supplier-customer relationships from public and semi-public traces: financial filings, earnings call transcripts, bills of lading, trade and shipment records, corporate registries, and news signals. That does not make every inferred edge safe to operationalize. It does make a previously blank part of the network visible enough to investigate.

What AI Is Actually Reconstructing
A useful AI-generated supplier map usually begins at company-level relationships: Company A supplies Company B, Company C appears to be a customer of Company D, or two entities are connected through a shipment, disclosure, or public statement. That is a different object from a compliance-grade trace saying a specific part came from a specific factory and entered a specific production line.
The distinction matters because the consequence of a map is work. A relationship edge can trigger an analyst review, a supplier questionnaire, a sanctions or geographic exposure check, a business-continuity escalation, or a tense conversation with a strategic supplier. If the map is treated as a lead-generation layer for supply chain intelligence, false positives are manageable. If it is treated as proof of part-to-site traceability, they become dangerous.
The strongest public evidence that this reconstruction is feasible comes from an MIT proof-of-concept published in January 2026 in the Journal of the Operational Research Society. The study mapped supplier-customer networks around three major electronics contract manufacturers—Foxconn, Flex, and Jabil—and produced 4,644 nodes and 8,341 directed edges, with 82.7% precision when validated against S&P Capital IQ ground-truth data.[2]
That result is strong enough to matter and imperfect enough to keep everyone honest. An 82.7% precision figure says the approach has moved beyond speculative visualization. It also implies that a meaningful share of inferred supplier relationships are wrong, ambiguous, stale, or not supported strongly enough for direct operational use without validation.[2]
The RAG Pipeline Turns Documents Into Edges
Retrieval-Augmented Generation is the load-bearing mechanism because most supplier evidence is not sitting in a tidy table. It is buried in filings, transcripts, shipping records, and narrative disclosures. A large language model can read these materials, but a raw pass over a large corpus is too loose for supplier mapping. The retrieval layer narrows the evidence before the model extracts relationships.
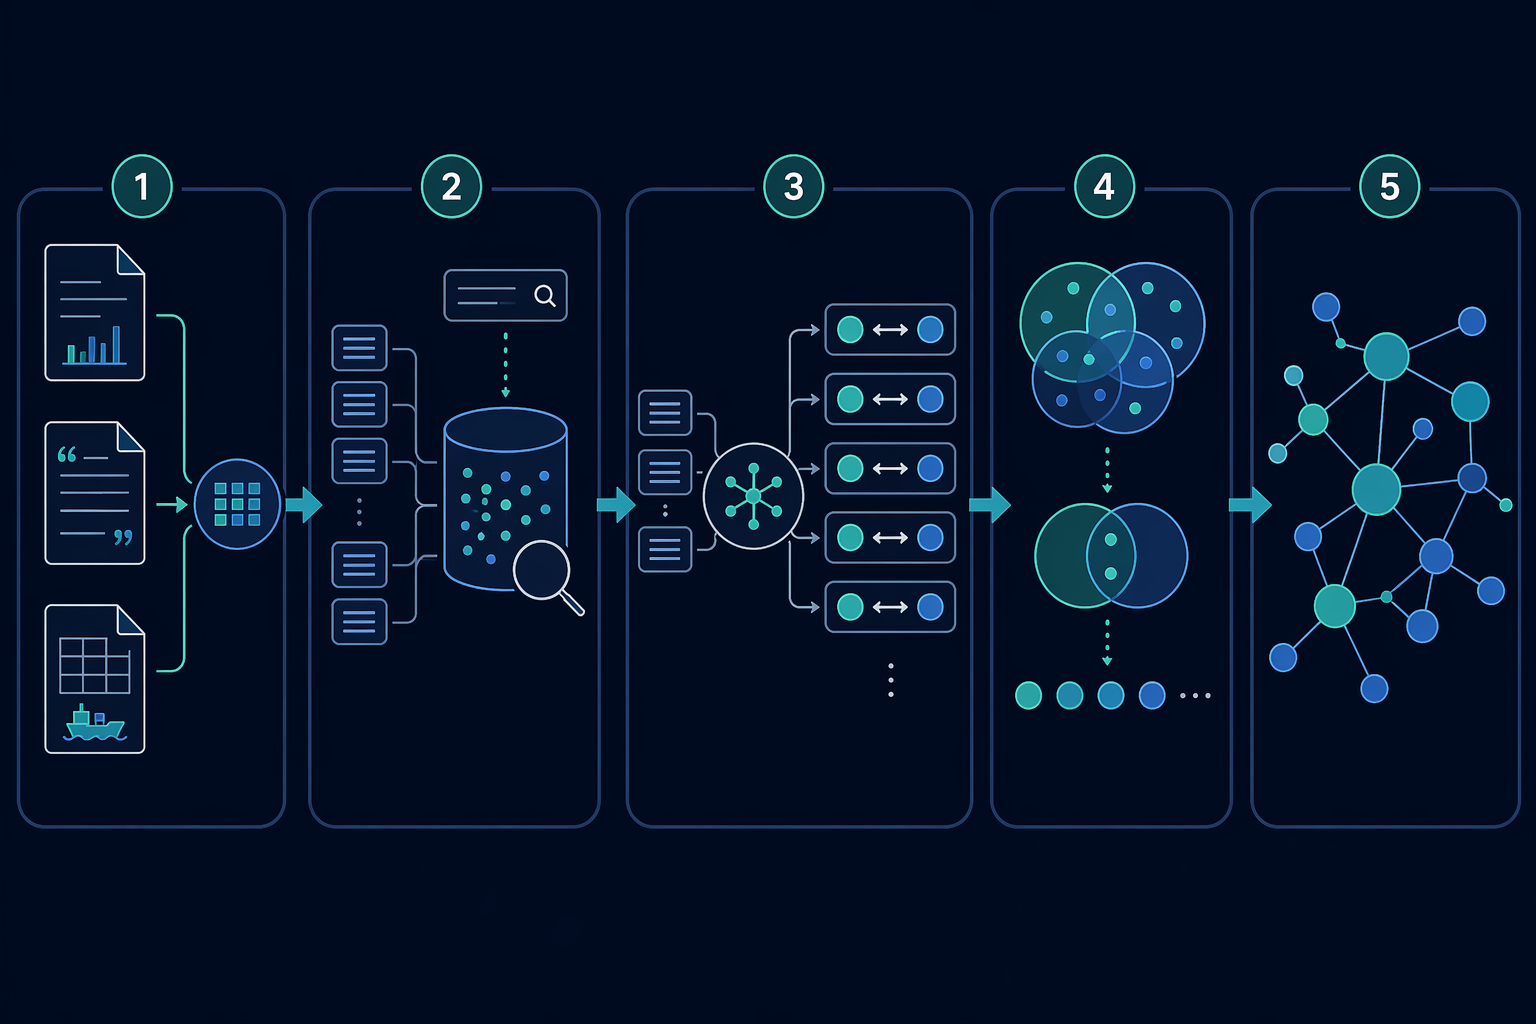
In the MIT workflow, public financial documents were chunked into smaller passages, embedded for retrieval, searched for relevant segments, and then passed to an LLM instruction that extracted structured supplier-customer relationships. The extracted names were deduplicated through entity resolution, and the final network was built with NetworkX for graph analysis.[2]
| Pipeline stage | What it does | Why it matters for supplier mapping |
|---|---|---|
| Document chunking | Breaks long filings and transcripts into smaller passages | Prevents the model from treating a whole document as equally relevant |
| Embedding retrieval | Finds passages likely to contain supplier-customer evidence | Focuses extraction on the sentences that can support an edge |
| LLM extraction | Converts text into structured relationship candidates | Turns narrative disclosures into supplier-customer pairs |
| Entity resolution | Merges names that refer to the same company | Avoids splitting one supplier into multiple nodes |
| Graph construction | Creates nodes and directed edges | Makes network position and dependency structure analyzable |
The retrieval step is doing more than saving compute. It gives the eventual relationship a traceable evidence base. If an LLM says a company is a supplier, an analyst should be able to inspect the passage that caused that extraction. Without that evidentiary trail, the output is a black-box guess with a polished interface.
Entity resolution is just as important and usually less glamorous. Supplier data is full of subsidiaries, abbreviations, legal suffixes, local-language names, acquired entities, and inconsistent spellings. If “Hon Hai Precision Industry,” “Foxconn,” and a subsidiary name are treated as unrelated companies in one part of the map but collapsed too aggressively in another, the graph becomes misleading. The model may extract the relationship correctly and still damage the network if identity matching is weak.
The MIT study’s reported precision exceeded 90% for direct supplier relationships, while the broader supplier relationship extraction reached 82.7% precision across the tested network.[2] That spread is intuitive: relationships closest to named focal firms are easier to validate and more likely to be documented clearly. As the system moves outward into sub-tier relationships, evidence becomes thinner, names become noisier, and the analyst’s burden increases.
The Graph Layer Changes Which Relationships Get Attention
Once relationships are structured as a graph, the question shifts from “Who is connected?” to “Which connections matter enough to investigate first?” A flat list of 8,341 inferred edges is not a working risk program. A network view can show which companies sit at important junctions, which clusters look tightly connected, and where a disruption might travel across customers or suppliers.
Betweenness centrality is useful here because it highlights nodes that sit on many shortest paths between other nodes. In supplier-risk terms, those nodes can behave like nexus suppliers: companies whose disruption may affect otherwise separate parts of the network. The metric is not a prediction that a supplier will fail. It is a prioritization signal for where failure could propagate if it occurs.
Modularity looks at community structure. The MIT study applied modularity analysis and noted that Q values above 0.3 indicate meaningful community structure, while Q values above 0.48 correlated with disruption containment capacity in the studied networks.[2] For a supply chain team, that does not mean a high-modularity network is automatically safe. It means the map may have separable communities where a disruption is more likely to remain contained than in a network where the same suppliers bridge many clusters.
Those metrics matter only if they change the next action. A high-centrality inferred sub-tier supplier might justify validation with the Tier 1, a request for alternate-source information, or closer monitoring in a risk scoring model. A peripheral edge supported by weak evidence might sit in an intelligence queue until another signal appears. The graph does not remove judgment; it gives judgment a better queue.
Why 82.7% Precision Is Useful, And Not Enough
Precision measures how many extracted relationships are correct among the relationships the system claims. At 82.7%, the MIT result means most claimed edges were validated against the chosen ground truth, but it also leaves a 17.3% false-positive share among claimed relationships.[2] In practice, that is the difference between using the map to guide inquiry and using it as final proof.
The company-level granularity is the other boundary. A system may identify that one company supplies another, but not which component, from which facility, under which contract, or for which product family. For disruption sensing, that may still be valuable. For forced-labor compliance, export-control determinations, medical-device traceability, or automotive part qualification, it is not enough by itself.
The MIT study is also a proof-of-concept in a specific setting: large electronics contract manufacturers. Foxconn, Flex, and Jabil are heavily documented compared with smaller private firms and many lower-tier suppliers.[2] The result should not be casually generalized to every industry, region, or supplier size without additional validation.
Still, the finding changes the practical conversation. A sub-tier map that is mostly right, evidence-linked, and reviewable can support triage in a way that a blank spreadsheet cannot. The right internal label is not “source of truth.” It is closer to “network intelligence layer.”
How Production Systems Are Using the Same Pattern
The vendor market is already moving along the same spectrum, although the evidence is not as clean as a peer-reviewed study with named validation data. Resilinc describes a hybrid model that uses AI inference from trade and shipment data, then layers supplier-validated enrichment for critical nodes.[3] That distinction is important: broad inference gives coverage; validation gives confidence where the cost of being wrong is high.
Interos applies entity resolution across corporate registry data, which addresses a different but central failure mode: knowing whether two names in different datasets refer to the same real organization.[3] A supplier graph can become noisy very quickly if registry names, parent companies, operating subsidiaries, and local legal entities are not reconciled carefully.
Semantic Visions represents another signal type: multilingual news parsing. It uses LLMs to parse more than 50,000 news articles in 12 languages to detect sub-tier relationships and risk signals.[3] News alone is not a supply map, but it can surface relationships or events that formal supplier disclosures miss.
These approaches are not interchangeable. Shipment inference can be broad but may miss contractual nuance. Registry resolution can clean up identities but does not prove supply flow. News parsing can detect emerging signals but may be uneven across languages, regions, and media environments. Supplier validation is slower and politically harder, but it is still the route to higher-confidence detail for critical parts and sites.
The Investment Case Is Exposure, Not a Prettier Map
The reason companies tolerate this technical complexity is not curiosity about graphs. It is the cost of being surprised beyond Tier 1. JAGGAER’s discussion of supply chain visibility cites McKinsey and World Economic Forum data indicating that disruptions lasting more than one month can cost up to 45% of annual profit.[1] That figure should be treated as a broad exposure frame, not as a guaranteed savings estimate for any one mapping project.
The economic logic is more grounded when stated narrowly. If a buyer cannot see which sub-tier suppliers connect multiple product lines, it may discover a shared dependency only after a fire, flood, insolvency, sanctions event, port disruption, or quality failure. AI-assisted mapping can bring those candidate dependencies forward earlier, especially when combined with review workflows and supplier confirmation for the nodes that matter most.
Vendor-reported savings claims can be useful anecdotes, but they should not carry the argument alone. The more defensible case is that a broad, imperfect, evidence-linked network helps risk teams aim their scarce validation effort. Instead of asking every Tier 1 for every sub-tier detail at once, they can start with high-centrality suppliers, high-exposure regions, single-source categories, or nodes that appear across multiple signal types.
Where AI Mapping Should Stop
AI-powered multi-tier mapping is credible for broad company-level discovery. It can ingest messy documents, retrieve relevant evidence, extract likely supplier-customer relationships, reconcile entity names, and arrange the result as a network that supports prioritization. The MIT proof-of-concept gives that claim a public anchor: thousands of nodes and edges, named manufacturers, a defined extraction workflow, and measured precision.[2]
It should not be trusted alone for part-to-site traceability. It should not replace supplier confirmation where compliance, safety, or contractual obligations require proof. It should not turn an inferred company relationship into an automatic escalation without a review path. And it should not be assumed to perform equally well in industries or supplier populations that have not been tested with the same rigor.
The practical architecture is therefore hybrid: use AI to reconstruct the broad network and expose likely hidden dependencies; use graph metrics to decide what deserves attention; use human review, supplier validation, and part-level data to harden the pieces that will drive operational decisions. That is less dramatic than claiming the map is solved. It is also much closer to how supplier-risk work survives contact with the real network.
References
- Why Supply Chain Visibility Breaks Down Beyond Tier 1 in 2026, JAGGAER.
- MIT RAG study on supplier-customer network reconstruction, Journal of the Operational Research Society, January 2026.
- Supply Chain Mapping: AI vs. Supplier-Validated Mapping, Resilinc.
Comments
Join the discussion with an anonymous comment.