
The hard decision in wildfire logistics is made before the column of smoke is confirmed. At that point, the question is no longer which engine, crew, dozer, or aircraft can be dispatched fastest from wherever it happens to be. The better question is where scarce resources should have been staged before the next ignition pattern became visible. That is where AI for wildfire response logistics is starting to matter: not as a replacement for dispatch judgment, but as a way to make prepositioning less dependent on habit, district politics, and last season’s memorable fire.
The strongest current evidence comes from a 2026 Nature Scientific Reports study built around 544 wildfire events in Taiwan from 2011 through 2024. The framework used an XGBoost wildfire-risk predictor and then fed those forecasts into a multi-objective evolutionary allocation model. Against uniform deployment, the model reported a 27.7% reduction in a response-time proxy, while also treating workload balance and burned-area control as part of the optimization problem rather than afterthoughts.[1]
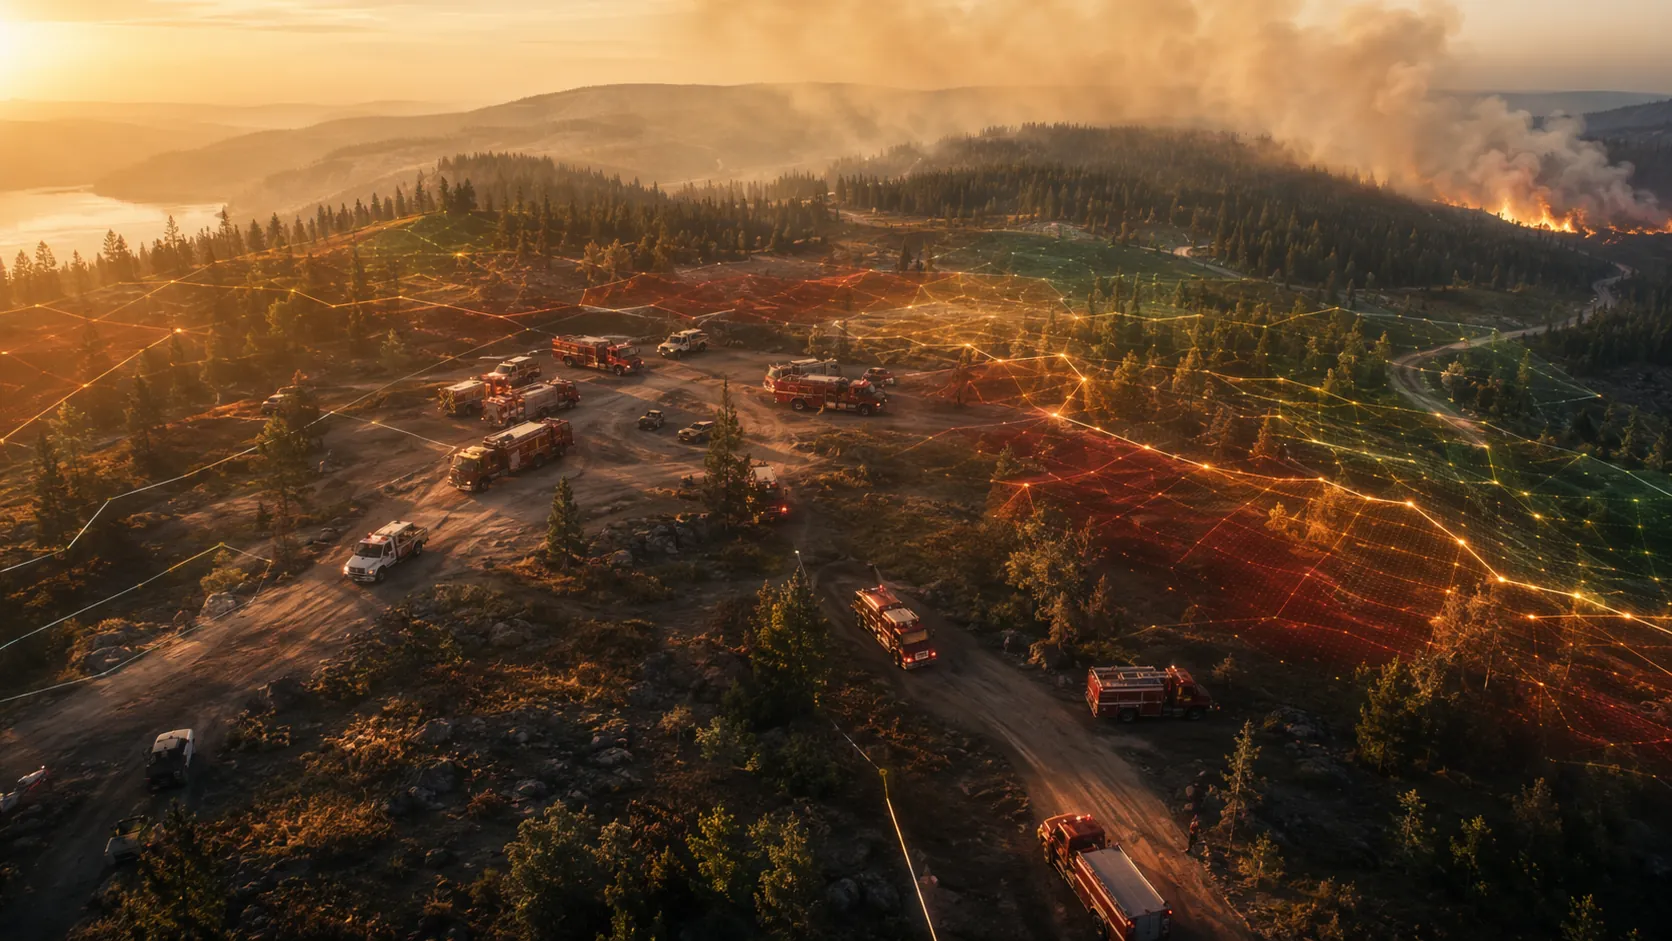
The Useful Shift Is From Dispatch Speed to Staging Logic
A clean dispatch chart can make every resource look available. A staging yard tells a different story. Engines need to leave without blocking one another. Crews may already have been moved twice in two days. Aircraft may be nominally ready but constrained by coverage, timing, or the next assignment. A useful model has to respect those frictions, because the logistics manager at 6 a.m. is not defending an abstract optimum. They are explaining why one district gets more coverage, another gets less, and a tired crew is not being treated as an endlessly reusable input.
That is why the Taiwan study is more interesting than a simple “AI makes response faster” claim. The workflow matters. First, the risk model estimates where fire risk is higher. Then the allocation model searches for resource placements that improve several outcomes at once. The benchmark is not an imaginary perfect deployment; it is uniform allocation, the kind of even spread that is administratively easy to explain but often operationally blunt.[1]
The reported 27.7% gain is also narrower than it may sound in a procurement slide. It is a reduction in a response-time proxy, not a universal guarantee that every incident will see engines arrive 27.7% faster. That distinction is important. A proxy can be a legitimate planning measure, especially when comparing allocation strategies across historical events, but it still needs local validation before being treated as a field promise.
| Planning question | What the model contributes | What still needs human review |
|---|---|---|
| Where is ignition risk likely to be higher? | A risk forecast trained on historical wildfire events and relevant local variables | Whether local data are current, complete, and comparable to the model’s training region |
| Where should limited resources be staged? | A multi-objective search across response-time proxy, workload balance, and burned-area control | Whether the resulting placement can be staffed, moved, fueled, and defended politically |
| Is the allocation operationally durable? | Trade-off visibility across competing objectives | Whether crews, stations, aircraft, and mutual-aid partners can sustain the pattern |
Why the Best Allocation Is Not Maximum Concentration
Once a model shows that high-risk zones deserve more resources, the tempting next move is to push harder: put nearly everything where the forecast burns brightest. That looks decisive. It is also where many optimization charts become too neat for the field.
The important trade-off in the research is the near-knee allocation: roughly 60% of resources to high-risk zones, 30% to medium-risk zones, and 10% to low-risk zones. That distribution sits near the point where the system captures most of the response benefit without making the rest of the coverage map brittle. Pushing beyond 65% in high-risk zones yields only about 3% additional response gain while increasing workload concentration by 28%.[1]
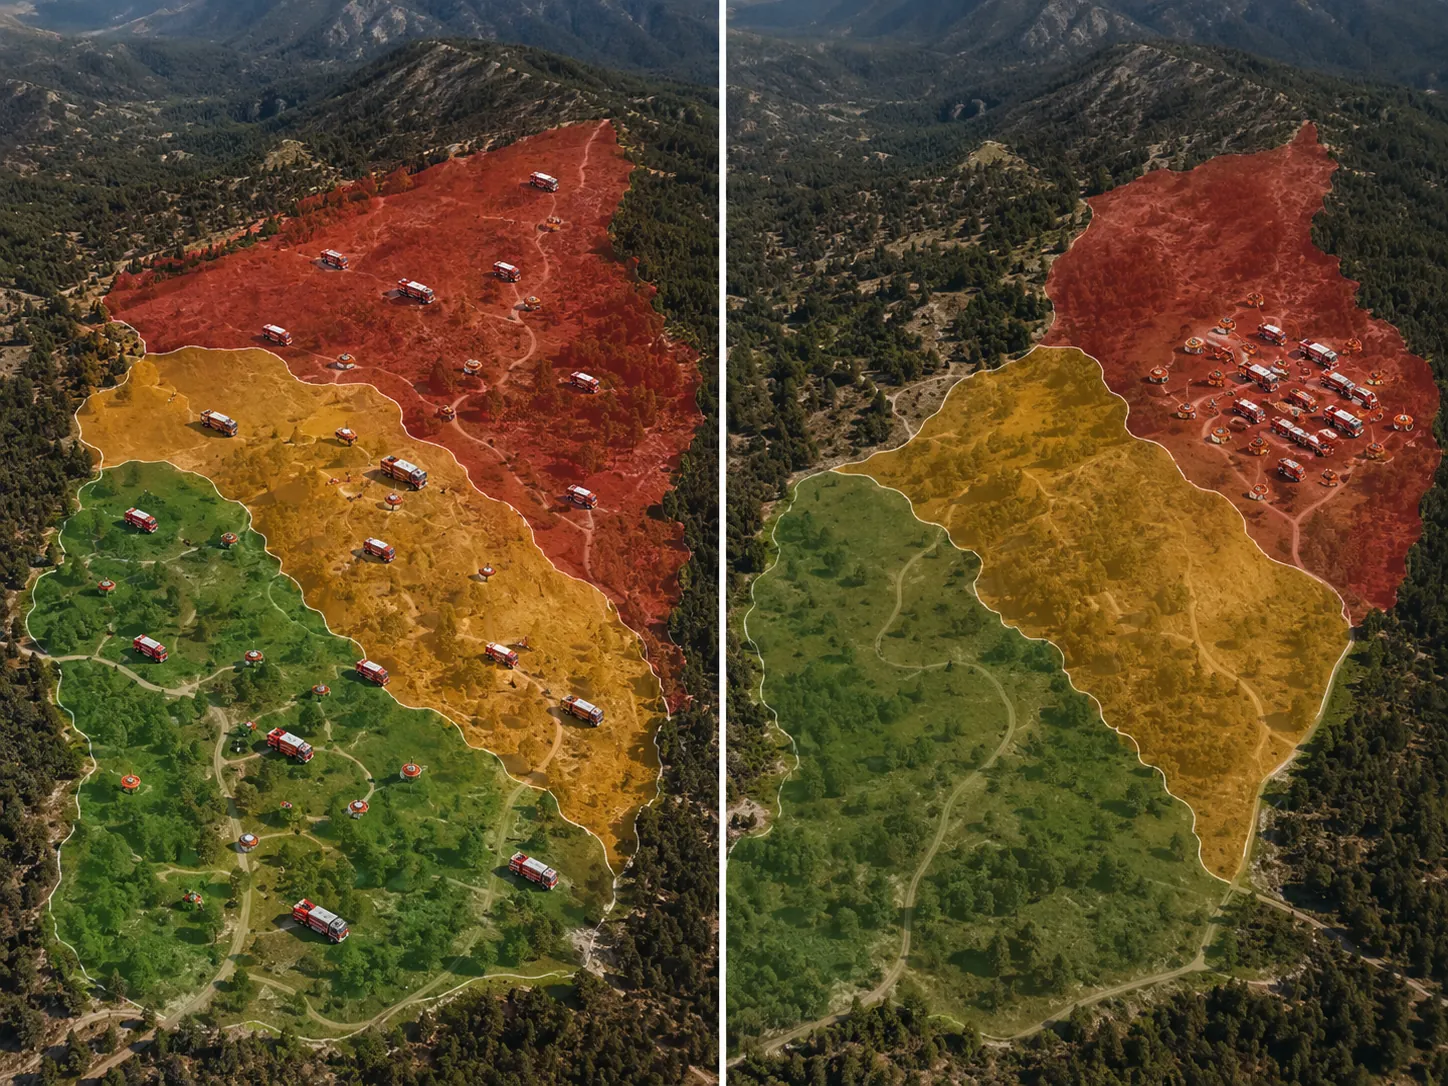
That is the kind of number a logistics manager can use. The point is not that 60-30-10 should be copied into every region. The point is that the model exposes the price of squeezing out marginal speed. A few more minutes saved on paper can come with a workload pattern that repeatedly pulls the same crews, stations, or aviation bases into the hardest operating tempo.
A Pareto frontier can sound like an academic abstraction, but in this setting it is just a map of trade-offs. One allocation may reduce response time but overload a subset of crews. Another may distribute workload fairly but leave too many high-risk starts farther from initial attack. The near-knee point is where the next increment of performance starts costing too much in another part of the system.
That matters because wildfire response is not a one-incident contest. The hidden bill for over-concentration arrives after the first operational period: crew fatigue, uncovered flanks of the service area, more repositioning, and a command staff that has to keep explaining why nominally lower-risk communities have almost no nearby capacity. A model that makes that bill visible is more useful than one that only ranks plans by average response speed.
Aerial Prepositioning Shows the Same Logic at a Different Tempo
The FIRECAST work points in the same direction for aircraft, with a different kind of operational pressure. Aerial resources are fast once launched, but staging them poorly can still lose the initial-attack window. The 2026 FIRECAST AI preprint analyzed 42,807 fire detections and reported forecast-driven aerial prepositioning with sub-second optimization, an average response-time reduction of about 10 minutes per incident, and a 21 percentage-point improvement in the share of fires reached within the critical initial-attack window.[2]
Those figures are vivid because they attach the model to a recognizable operating constraint. Ten minutes can be the difference between arriving while a fire is still containable and arriving after the first tactical opportunity has narrowed. A 21-point improvement in initial-attack-window reach is not just a cleaner average; it speaks to how often the system puts a resource close enough, early enough, to matter.[2]
The caution is also straightforward. As of July 2026, FIRECAST is an arXiv preprint, not settled peer-reviewed evidence. Its implementation-cost estimate of $4.15 million and stated return-on-investment range of 10:1 to 40:1 should therefore be treated as procurement inputs to scrutinize, not as finished budget truth.[2]
For aircraft, the procurement questions get very concrete. Which bases are actually available during the target period? Which aircraft are constrained by crew duty limits, maintenance, airspace, or competing missions? Does the optimization account for coverage gaps created when an aircraft is staged aggressively toward one forecast cluster? A sub-second optimization run is impressive only if the inputs describe the real fleet rather than a simplified fleet.
What an Evaluator Should Ask Before Adoption
The first adoption question is calibration. The Taiwan framework is parameterized on Taiwan wildfire data, and its authors warn that shape parameters are region-specific and must be recalibrated before deployment elsewhere.[1] That warning should not be treated as a footnote. A model that performs well on one geography, vegetation pattern, road network, or reporting regime may need substantial adjustment before it can guide staging in another.
The second question is the baseline. A vendor or internal analytics team should say exactly what the model beats. Uniform allocation is a reasonable research benchmark, but an agency may already use seasonal severity maps, duty-chief judgment, mutual-aid plans, or known wind corridors. The relevant comparison is not AI versus no thinking. It is AI-assisted prepositioning versus the agency’s current prepositioning practice, including all the informal knowledge that practice contains.
- Ask what the response-time metric measures: actual travel time, distance-weighted coverage, simulated arrival, or another proxy.
- Ask whether workload is an explicit constraint or merely reviewed after the fastest plan is selected.
- Ask how often the risk model is recalibrated and who approves the change.
- Ask whether low-risk zones retain minimum coverage when high-risk areas intensify.
- Ask how the system handles unavailable resources, crew rest, maintenance, and mutual-aid commitments.
The third question is data readiness. These systems need digitized resource inventories, GIS capability, and consistent incident logs. Agencies still running large parts of the operation through radio traffic, whiteboards, spreadsheets, and after-the-fact cleanup may still benefit from better analytics, but they should not expect a mature allocation model to emerge from incomplete records. The model will inherit the condition of the operating data.
The fourth question is governance. If the model recommends moving resources away from a district that expects protection, somebody has to explain why. If the model repeatedly assigns the same aviation base to high-tempo coverage, somebody has to monitor the fatigue and maintenance consequences. Transparent workload constraints are not a nicety; they are what make the recommendation defensible when every affected manager can see the map.
The Operational Standard
AI-driven wildfire resource prepositioning is credible when it couples calibrated local risk forecasts with multi-objective allocation, visible workload constraints, digitized inventories, GIS-ready coverage analysis, and consistent incident logs. The Taiwan result is strong enough to justify serious evaluation, and FIRECAST adds useful evidence that the same staging logic can apply to aerial initial attack. Neither supports blind adoption.
The durable lesson is the allocation strategy. Faster response matters, but the strongest plans do not simply chase maximum concentration in the hottest forecast zones. The balanced allocation is the one that looks most runnable: enough weight toward high-risk areas to improve response, enough remaining coverage to keep the system from exhausting itself before the next call.
References
- Nature Scientific Reports (2026), Nature Scientific Reports, 2026.
- FIRECAST: Forecast-Driven Prepositioning for Initial Attack Wildfire Response, arXiv preprint, 2026.
Comments
Join the discussion with an anonymous comment.