
Offshore wind O&M does not become expensive in the abstract. It becomes expensive when a crew transfer vessel leaves port for too little work, when a service operation vessel waits through a marginal sea state, when a jack-up is mobilized before enough major-component work has been bundled, or when technicians reach a turbine and the access window closes before the job is complete.
That is why the clearest current ROI case for AI in offshore wind supply-chain planning is not a broad promise about digital transformation. It is vessel scheduling, weather-window prediction, and maintenance-task bundling. The cost pool is large enough to matter: Shoreline Wind reports that logistics and vessel operations represent 25–30% of total offshore wind project cost, while iFactory cites offshore O&M costs of $65,000–$85,000 per MW per year and logistics at more than 70% of total O&M expenditure.[1][2]
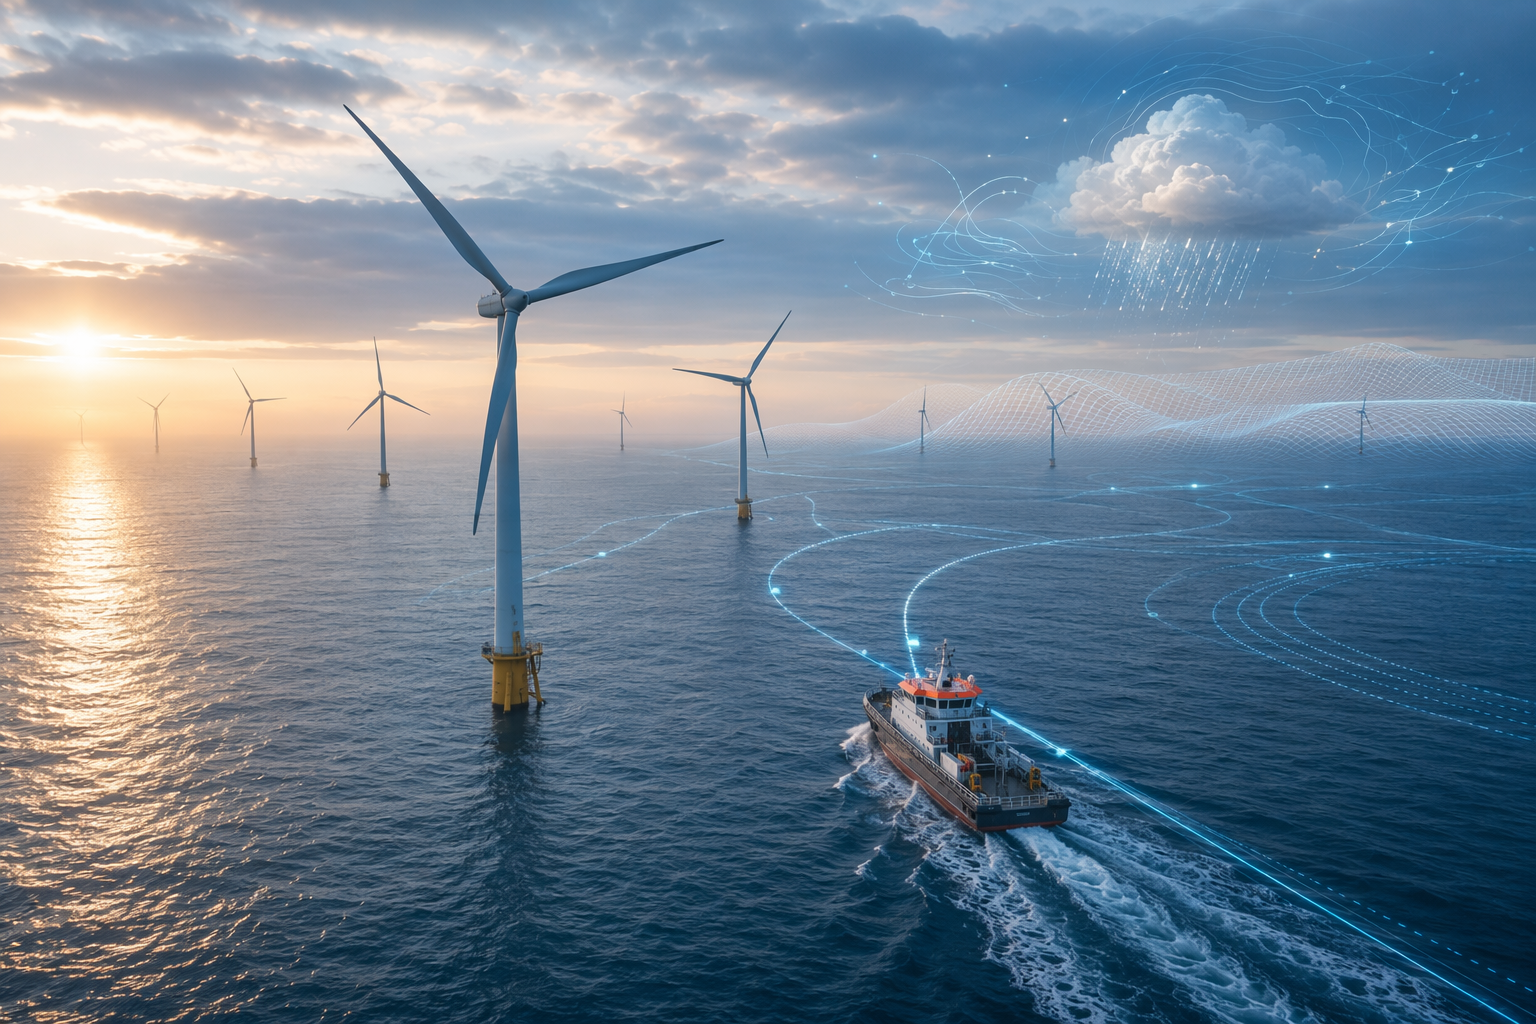
Those numbers point to a narrow but consequential question: can AI reduce the vessel miles, waiting hours, and half-used crew days that sit between a work order and a turbine back online? Per iFactory's published offshore wind maintenance case results, AI-optimized routing reduced total vessel distance by 25–36%, weather-window prediction reduced waiting-on-weather hours by 41% per quarter, completed maintenance tasks per vessel day rose 2.3x, optimized routing reduced fuel consumption by 36%, AI barge scheduling supported 97.1% turbine availability, and payback was reported at 3–6 months.[2]
Those are vendor-published case outcomes, not independent industry averages. That distinction matters. A planner can still use them as business-case evidence, but only after mapping them to the operator's own vessel mix, weather regime, backlog shape, contract structure, and failure profile.
Where the ROI actually appears
The offshore maintenance schedule is a constraint problem before it is a software problem. A vessel has a day rate, range, deck limits, crew limits, and access limits. A turbine has a work order, a fault priority, a spare-parts requirement, and a weather-dependent access risk. The site has metocean forecasts that shift faster than procurement decks usually admit. The plan fails when those elements are optimized separately.
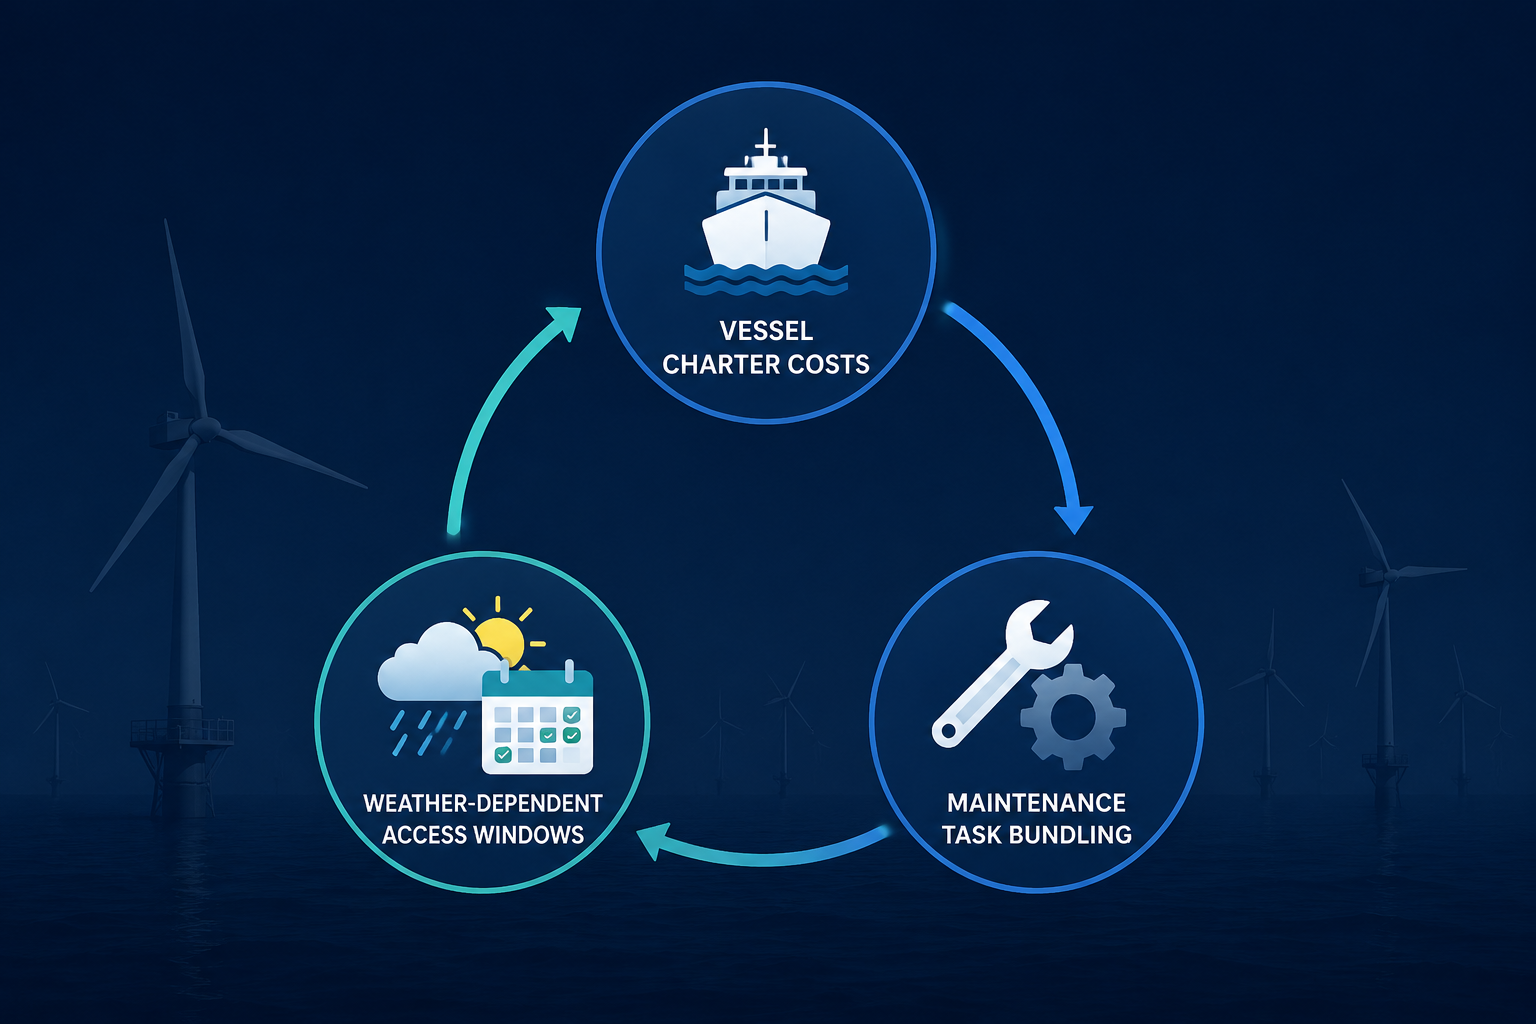
The strongest AI scheduling systems attack three linked variables at once: vessel charter cost, weather-dependent access, and maintenance bundling. Change only one and the saving can disappear. A shorter route is not useful if it sends the crew to turbines that cannot be accessed. A good access forecast is wasted if the vessel carries the wrong technicians or parts. A full backlog is not enough if tasks are scattered across the array in a way that burns transit time.
| Optimization target | Operational meaning | Reported evidence |
|---|---|---|
| Vessel distance | Fewer nautical miles across the array and less repeated repositioning between turbines | 25–36% reduction in total vessel distance in iFactory-published case results |
| Waiting on weather | Fewer crew and vessel hours lost after mobilization because the access window is not usable | 41% reduction in waiting-on-weather hours per quarter in iFactory-published case results |
| Tasks per vessel day | More work completed per chartered day through better grouping of turbines, technicians, parts, and access windows | 2.3x increase in maintenance tasks completed per vessel day in iFactory-published case results |
| Fuel use | Less transit and idling from route optimization | 36% reduction in fuel consumption in iFactory-published case results |
| Payback | Savings recover implementation cost quickly if the operator has enough vessel spend and schedulable backlog | 3–6 month payback in iFactory-published case results |
The table is useful only if each metric is translated back into the daily plan. A 25–36% reduction in vessel distance is not just a route drawn more neatly on a screen. It implies fewer duplicated legs, fewer single-stop trips, and better sequencing across turbines that can be serviced under the same forecast window.[2]
The 41% reduction in waiting-on-weather hours is the sharper figure for marine coordination. Waiting on weather is paid time without production benefit. It also disrupts the next day’s plan: technicians return with unfinished work, parts remain allocated, and the planner now has to decide whether to reattempt the same job, downgrade it, or use the vessel for a different cluster.[2]
The 2.3x increase in tasks per vessel day is where the gains compound. More completed tasks per day can mean fewer charter days for the same backlog, or it can mean the same fleet catches up on deferred work sooner. Either way, the saving is not just fuel or distance. It is higher utilization of the vessel, crew, spare parts, and access window at the same time.[2]
The mechanism: clustered routes, usable forecasts, and bundled work
Clustered multi-stop routing is the simplest part to understand and often the hardest to execute consistently. The scheduling engine groups turbines and work orders so the vessel is not zigzagging across the site. That sounds basic until the constraints are added: technician qualifications, fault urgency, part availability, transfer limits, tide, wave height, daylight, port departure time, and the probability that the last turbine in the cluster is still accessible when the vessel arrives.
Weather-window prediction matters because offshore access is not a binary forecast. A plan can be technically possible at 06:00 and commercially poor by 10:00 if sea state, wind, or transfer conditions make the last jobs uncertain. Better prediction shifts the decision from “can we sail?” to “can we complete enough of this bundled work to justify sailing?” That is the decision that determines whether a vessel day produces availability or becomes an expensive holding pattern.
Maintenance bundling is the bridge between the routing model and the asset model. Minor corrective tasks, inspections, planned service, and opportunistic work can be grouped when they share location, access conditions, skills, or parts. The planner wants the turbine visit to absorb more work without overloading the day so badly that the vessel misses the window for the next stop.
This is why vessel scheduling tends to produce a more visible ROI case than generic predictive maintenance. Predictive maintenance may identify a future failure, but the saving is not captured until the work is folded into a feasible offshore plan. The offshore supply chain gets paid back when fewer sailings, fewer waits, and more completed tasks show up in the operating record.
Vessel class changes the value of the same algorithm
A scheduling model that treats every vessel day as roughly equivalent will mislead the buyer. The optimization logic may be similar across vessel classes, but the financial leverage is not.
| Vessel class | Typical planning constraint | Where AI scheduling has leverage |
|---|---|---|
| CTV | Lower cost, short transit ranges, and access commonly limited around 1.5m wave height | Selecting nearby task clusters that fit short weather windows and avoid low-value sailings |
| SOV | Higher day-rate, 2.5m+ wave operation, walk-to-work gangway, and onboard accommodation | Building multi-day campaigns that keep technicians productive offshore and reduce return-to-port losses |
| Jack-up | Very high cost, stable platform for major component replacement, and need for extended weather certainty | Bundling major-component work and mobilizing only when the campaign and forecast justify the cost |
For CTV-heavy operations, AI value often comes from avoiding weak sailings. A lower day rate does not make a poor trip cheap if the crew reaches one turbine, completes one small task, and returns with the rest of the work unfinished. Short-range planning and wave-height sensitivity make route clustering and access probability especially important.
For SOV campaigns, the model has a different job. The vessel is already offshore, with accommodation and walk-to-work capability changing the access equation. The scheduling problem shifts toward keeping the onboard team productive over multiple days, balancing fatigue, skills, spare parts, and turbine priority while the vessel remains near the field.
For jack-ups, the penalty for bad timing is harsher. These vessels are used for major component replacement and need longer weather certainty. The AI case is less about shaving a few transit legs and more about avoiding under-bundled mobilization, sequencing high-value work, and protecting the campaign from forecast risk that would strand an expensive asset.
Simulation scale is useful, but it is not the same as deployment savings
Shoreline Wind says its AI systems ran nearly 2 million simulations in 2025, and that small efficiency improvements can cut up to $300,000 per day in transport costs.[3] Those figures help explain why offshore logistics attracts optimization software: the system is sensitive, and the daily cost of getting it wrong can be large.
But simulations, savings potential, and realized deployment outcomes should stay in separate lanes. A simulation count shows analytical scale. A potential daily saving shows cost sensitivity. A measured deployment result shows what changed after the system met real vessels, real weather, and real work orders. Business cases should not blend those into one implied industry average.
GE Vernova's AI and machine-learning work on reducing wind turbine logistics and installation costs is a useful credibility signal because a major OEM is targeting the same cost pool.[4] It does not remove the need for site-level validation. Installation logistics and O&M vessel scheduling overlap in constraint logic, but they are not identical buying decisions.
How to test the business case without believing the brochure
A credible 2026 business case should start with the operator's actual operating record, not a market-size slide. The buyer needs enough completed work-order history, vessel movement data, weather observations, forecast records, charter costs, fuel consumption, technician availability, spare-parts constraints, and downtime cost assumptions to reconstruct what the scheduler would have changed.
- Build the baseline from real vessel days: distance sailed, hours waiting on weather, jobs attempted, jobs completed, and return-to-port events.
- Separate vessel classes in the model instead of averaging CTV, SOV, and jack-up economics.
- Replay past maintenance weeks using historical weather and work orders to see whether the AI plan would have been feasible.
- Measure completed work, not only optimized schedules, because the value appears when tasks close and turbines return to service.
- Validate payback against charter terms, fuel, standby rules, crew costs, and the operator's own backlog profile.
The cleanest pilot is usually not a full-fleet transformation. It is a bounded campaign or operating period where the operator can compare planned versus actual outcomes: vessel distance, waiting-on-weather hours, tasks per vessel day, cancelled sailings, incomplete visits, and availability impact. If the software improves the plan but the marine team cannot execute it, the ROI is theoretical.
Policy and project uncertainty still matter
The offshore wind investment environment is not uniform in 2026. Deloitte identifies US renewable-energy headwinds including offshore wind leasing pauses, FEOC restrictions, and tariff impacts.[5] Those conditions can slow capital decisions, change project timing, and make some operators more cautious about new technology spend, even when the operational case is strong.
Floating offshore wind also deserves narrower language. It is not just fixed-bottom logistics moved farther offshore. Vessel requirements, mooring systems, port interfaces, weather exposure, and maintenance concepts are still evolving. The same AI scheduling principles may apply, but the benchmark data and vessel assumptions should not be borrowed casually from fixed-bottom O&M.
The practical investment judgment
For offshore wind operators building a 2026 AI business case, vessel scheduling and weather-window optimization is the clearest current ROI candidate in the supply chain. It attacks a visible cost pool, changes decisions that planners already make every day, and can be measured against operational records rather than abstract digital maturity.
The buyer should still treat published savings as case-specific. The right question is not whether AI can optimize offshore wind logistics in general. It is whether the operator has enough vessel spend, weather downtime, route inefficiency, and bundleable maintenance work for the system to move fewer vessels, waste fewer access windows, and complete more work per offshore day.
References
- Shoreline Wind Report: AI on rise in wind projects, Wind Systems Magazine
- Offshore Wind Farm Maintenance — Logistics, Vessel Scheduling & AI Weather Window Optimization, iFactory
- Offshore supply chain can boost profits despite challenging times ahead, Shoreline Wind
- GE Using AI/ML to Reduce Wind Turbine Logistics and Installation Costs, GE Vernova
- 2026 renewable energy industry outlook, Deloitte
Comments
Join the discussion with an anonymous comment.