The ROI Imperative: Why AI Inventory Optimization Demands a New Timeline
The headline figures are compelling enough to grab any CFO’s attention: AI-driven inventory optimization can reduce inventory carrying costs by 15–30% and cut stockouts by 20–50%. Those are the kinds of numbers that get a budget approved. But the uncomfortable truth, one that rarely makes it into the vendor pitch deck, is that only 6% of organizations see a return on their AI investment in under a year. The vast majority require two to four years to achieve satisfactory ROI.
This gap between the promise and the timeline is the central tension supply chain leaders must navigate. It is not a sign that the technology is failing. It is a structural feature of how AI inventory optimization delivers value. The returns compound over time as data quality improves, models are retrained, and organizational processes adapt. Understanding this compounding curve is the difference between a project that gets abandoned at month 14 and one that delivers a 293% ROI by year three.
This article provides a quantified ROI framework grounded in the latest benchmarks from ToolsGroup, McKinsey, Deloitte, and others. It includes a worked example you can adapt for your own business case, a realistic timeline broken down by quarter, and industry-specific context to calibrate expectations. If you are preparing to present an AI inventory optimization proposal to your executive team, this is the framework you need.
Key Metrics That Drive ROI in Inventory Optimization
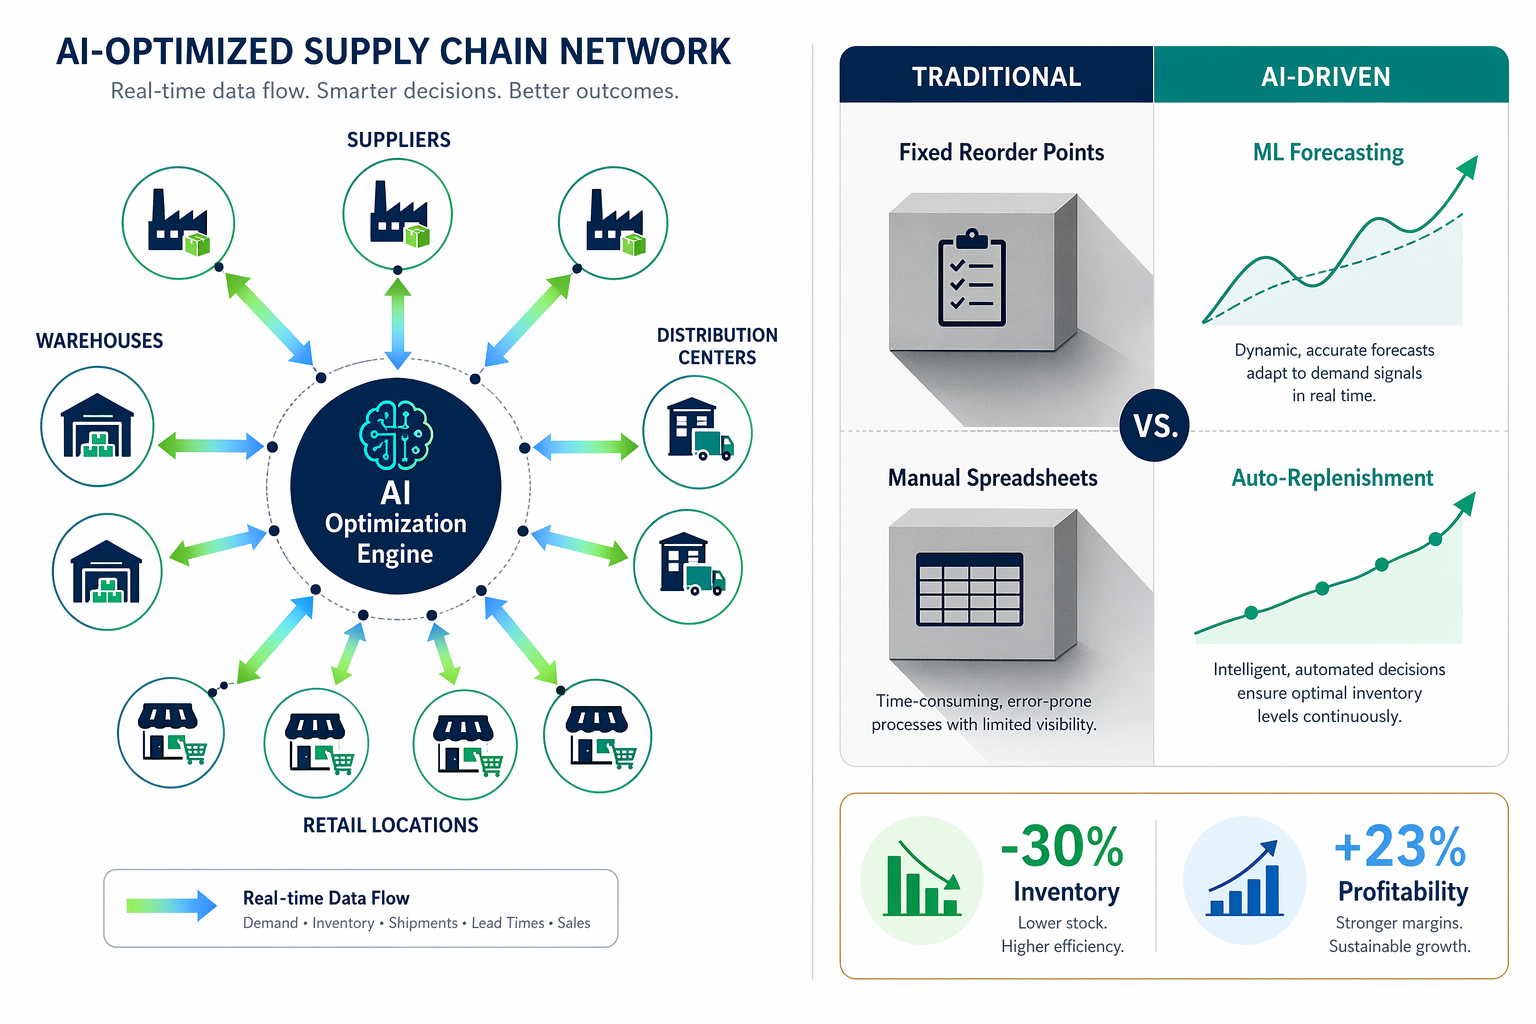
Before calculating ROI, it is essential to understand which levers AI inventory optimization actually pulls. Traditional rule-based systems rely on static reorder points and fixed safety stock levels. AI-driven systems, by contrast, adapt in real time to demand signals, lead time variability, and supply constraints. This changes the economics of inventory management across five primary value levers.
- Carrying costs. Warehousing, insurance, financing, and obsolescence typically account for 20–30% of inventory value annually. AI reduces the total inventory footprint by 20–35%, directly lowering these costs.
- Stockout costs. Lost sales, expedited shipping, and customer churn from stockouts can represent 4–8% of revenue. AI-driven demand sensing and probabilistic forecasting cut stockout frequency by 20–50%.
- Service level improvements. Higher order fill rates without proportional inventory increases. AI enables SKU-specific service level targeting, so high-margin products get tighter coverage while slow movers are optimized for cost.
- Working capital release. Every dollar freed from excess inventory drops directly to the bottom line. Large-scale deployments have freed up tens of millions in working capital.
- Obsolescence reduction. Better demand alignment means fewer products reach end-of-life with excess stock. Write-off reductions of 30–50% are common in industries with short product lifecycles.
Each of these levers connects to a specific P&L line item. The table below maps each metric to its financial impact and shows the typical improvement range from AI-driven optimization.
| Value Lever | P&L Impact | Typical AI Improvement Range |
|---|---|---|
| Carrying costs | COGS / Operating expense | 15–30% reduction |
| Stockout costs | Revenue loss / Expedite expense | 20–50% reduction |
| Service levels | Revenue / Customer retention | 5–15% fill rate improvement |
| Working capital | Balance sheet / Cash flow | 20–35% inventory value reduction |
| Obsolescence | Write-off expense | 30–50% reduction |
Comments
Join the discussion with an anonymous comment.