
The useful clock started before the price chart moved.
On July 20, 2026, the Houthis declared a blockade on Saudi Red Sea shipping. By July 21, tanker U-turns were already being reported near the threatened routes.[1] That one-day gap matters more to a logistics desk than a later freight-rate headline. It is the interval in which a planner can still question a sailing plan, a procurement team can still look at contract flexibility, and an inventory lead can still decide whether the next replenishment cycle needs protection.
This is not a thought experiment. The current situation combines a Houthi threat to Red Sea oil flows with an earlier Strait of Hormuz closure from the Iran war. Saudi Arabia’s Red Sea export route through Yanbu has become much more important because Hormuz is closed: roughly 4 million barrels per day are moving through Yanbu, about 400% above pre-war levels, while the Bab el-Mandeb threat puts more than 7 million barrels per day at risk.[2]
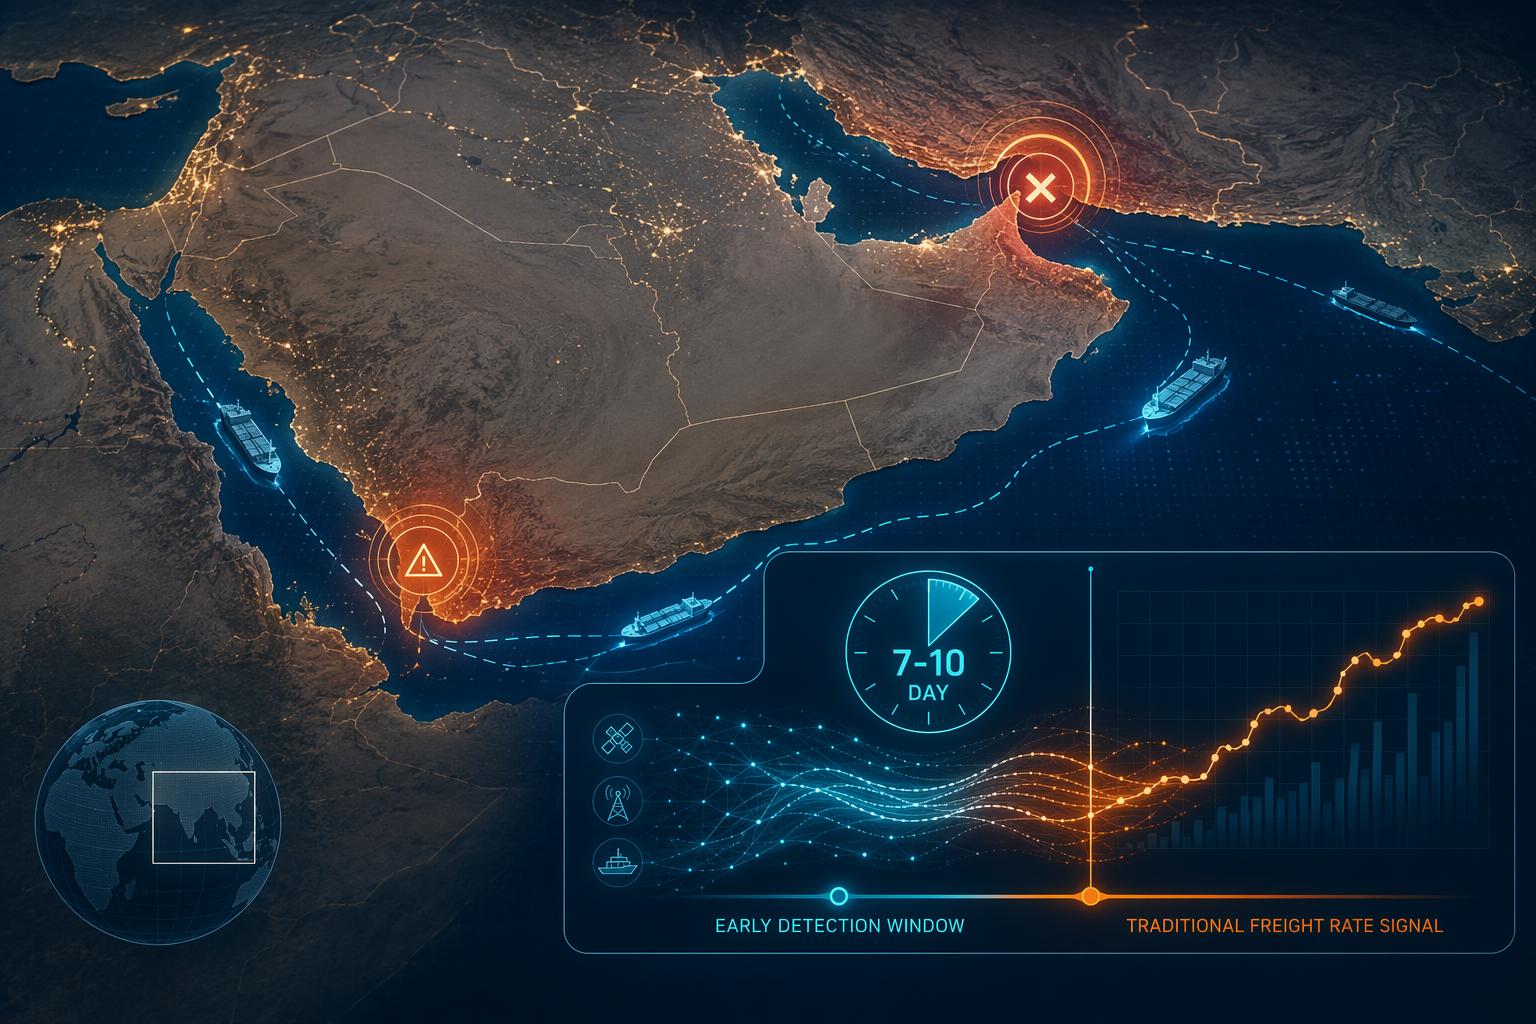
Oil-linked costs were not waiting politely for the weekly reporting cycle. European diesel refining margins surged to a record above $65 per barrel after the Houthi announcement.[3] That does not prove every shipment will become uneconomic, and it does not mean every vessel movement is a reliable signal. It does mean the market was repricing stress while many conventional visibility systems would still be waiting for cleaner, later data.
The 7-10 Day Window Is Operational, Not Mystical
A seven-to-ten-day warning window is not interesting because it sounds like a prediction demo. It is interesting because it sits inside the decision cycle. That is often enough time to ask whether a vessel should keep its current plan, whether inventory should be pulled forward, whether a contract has a usable exception clause, or whether a port call needs a different berth before the queue becomes visible to everyone.
Traditional tracking systems are badly positioned for that kind of work when the signal begins as behavior rather than a published metric. Carrier-reported ETAs tend to normalize uncertainty until a schedule has already lost credibility. Published freight rates and fuel-linked surcharges describe a market that has already absorbed stress. By the time those indicators become tidy enough to chart, the best operational options may have narrowed.
The tanker U-turns reported on July 21 are the kind of messy signal that matters. They do not, by themselves, establish the full scale or duration of a blockade. They do show that vessel operators were adjusting before a stable market consensus formed.[1] A control tower that can recognize that behavior, compare it with route exposure, port capacity, schedules, weather, and price-sensitive lanes, and then push exceptions to the right team has a different job from a dashboard that refreshes an ETA.
What AI Can See Earlier Than Legacy Visibility
The serious case for AI control towers is not that a model understands geopolitics. That claim would be too broad, especially in this crisis. The Houthis’ expanded targeting scope toward Saudi oil is not simply a replay of earlier Red Sea disruption patterns. Historical data helps with repeatable operational effects, such as congestion formation, weather exposure, schedule slippage, and reroute duration. It is less reliable as a claim that the model has learned the political boundaries of a novel escalation.
The credible mechanism is narrower and more useful: AI systems can fuse signals that become visible before conventional data products update. Satellite AIS can show vessel speed changes, loitering, route deviation, U-turns, and clustering. Marine weather tells an operations team whether a theoretically available reroute is likely to compound delay. Port terminal utilization shows whether diverted cargo is heading toward a workable berth or a queue. Carrier schedules reveal whether planned rotations are losing internal consistency. Economic indices can show margin and fuel-cost stress before a formal freight benchmark catches up.
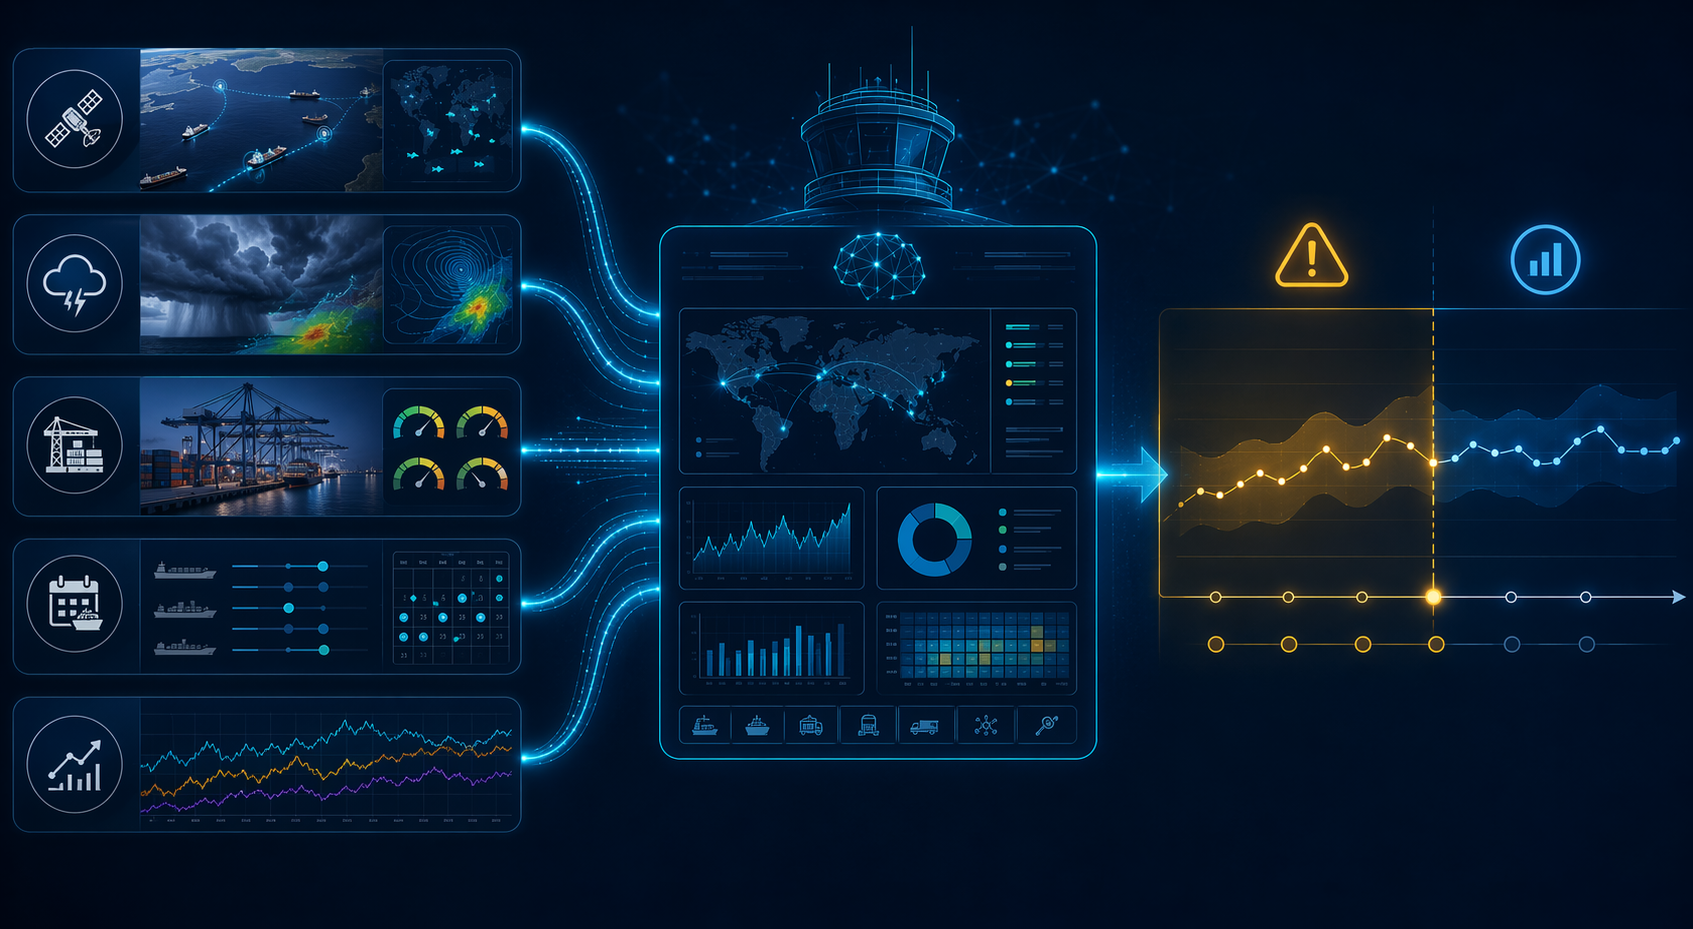
Those feeds are often described as a decorative list. In a live disruption, each one changes a different decision. AIS behavior helps identify which cargo is no longer following the plan. Weather changes the feasibility of the alternative. Terminal utilization changes the berth choice. Carrier schedules change confidence in the arrival promise. Economic signals change the urgency of acting before diesel, bunker, detention, and expedited freight costs reprice the exception.
| Signal | Earlier Operational Read |
|---|---|
| Satellite AIS | Vessels slowing, turning, clustering, or avoiding a lane before official schedule changes are reflected |
| Marine weather | Whether a reroute is merely available on a map or practical for the next sailing window |
| Port terminal utilization | Which terminal or berth still has usable capacity before congestion hardens |
| Carrier schedules | Whether promised ETAs remain credible across rotations and transshipment points |
| Economic indices | Whether diesel, fuel, and freight-cost pressure is moving before published rate data confirms it |
The Port Decision Is Where Predictive Visibility Becomes Real
Rerouting is the loud version of disruption management. The quieter, often more valuable decision is choosing the better arrival point before everyone else reaches the same conclusion.
The Le Havre example shows the difference. Siemens, discussing Portcast data, describes terminal-level visibility in which Terminal de l'Atlantique is running at about 50% utilization while GMP is at 85-90%.[4] That is not just a nicer dashboard. It changes the instruction. The action is not simply, "avoid congestion in northern Europe." The action is to evaluate a more viable terminal or berthing option while the choice still exists.
This is also where a control tower earns or loses trust. If it only says a lane is disrupted, the operations team still has to translate that warning into the next move. If it can show that one terminal is close to saturation while another has materially more capacity, the exception becomes reviewable. A planner can ask whether the carrier can support the move, whether drayage changes are acceptable, whether customs and documentation can follow, and whether the cost of adjustment is better than waiting.
Siemens reports that Portcast-supported workflows reduced manual status updates by 80%, lowered detention charges by 15%, and cut expedited freight spend by 5%.[4] Those figures are useful as vendor-reported benchmarks, not independent proof that every implementation will deliver the same result. The more defensible point is the mechanism: fewer manual checks, earlier exception surfacing, and more specific routing or terminal decisions should reduce the number of expensive surprises that land after the fact.
The Dual-Chokepoint Crisis Compresses the Room for Error
A single chokepoint disruption is already difficult because it turns a routing problem into a capacity problem. A dual-chokepoint crisis is nastier. Hormuz being closed changes the value of Red Sea alternatives. Yanbu’s elevated role concentrates attention on Saudi Red Sea flows. A Houthi blockade threat against those flows then pressures the workaround itself.
That is why the Yanbu number is not background color. If roughly 4 million barrels per day are moving through Yanbu because Hormuz is closed, then Bab el-Mandeb risk is not an isolated Red Sea concern; it is tied to the workaround for the earlier shock.[2] When the workaround becomes threatened, there is less slack in the system and less patience in the cost structure.
The oil-price question then arrives through operations, not through a model’s geopolitical confidence score. Which tankers change course? Which ports become substitutes? Which diesel markets tighten first? Which contracts absorb the first surcharge? Which customer orders sit behind inventory that was planned under a calmer assumption? Those answers begin forming before they become a neat price series.
The broader cost base was already sensitive. During the first Red Sea crisis, container spot rates from Shanghai to Europe tripled, according to GEP and UNCTAD material cited by Xeneta.[5] The current crisis does not repeat that event mechanically, but it compounds a market memory in which alternative routings, insurance, fuel, and schedule disruption are already familiar budget wounds.
Oil inventories add another constraint. The IMF warned in July 2026 that global oil inventories were nearing operational minimums, according to reporting in The Conversation.[6] In that setting, waiting for published freight rates to confirm stress is a governance choice. It may still be the right choice for some cargo, but it should be recognized as a choice to act later.
What Changes Inside the Control Room
The practical advantage of AI is not that it replaces the logistics director. It changes what reaches that person before the meeting is over.
In a conventional workflow, teams often discover the same disruption in fragments. One analyst sees an ETA slip. A trade-lane manager hears from a carrier. Procurement notices a surcharge conversation becoming less theoretical. Finance sees fuel assumptions aging badly. Customer service receives the first awkward question from a sales region. The control tower’s job is to join those fragments early enough that the company can make one defensible decision instead of five local reactions.
In the current Red Sea and Hormuz environment, that might mean flagging a Saudi-linked exposure list, ranking shipments by oil-cost sensitivity and delivery criticality, testing whether inventory can be buffered for the highest-risk SKUs, and escalating contract options before the market reprices them. It might also mean doing nothing for a shipment whose delay tolerance is high and whose reroute would be more expensive than the risk. Good predictive visibility should make inaction more deliberate, not merely make action faster.
The buyer interest is real, but it should not be mistaken for proof of effectiveness. ABI Research cites a maritime AI market at $4.3 billion growing 40.6% annually, and says 65% of supply chain professionals in a survey of 490 professionals consider AI or generative AI important for purchase decisions.[7] Those numbers show attention and budget pressure. They do not prove that a specific control tower will produce savings during a novel blockade.
Implementation quality still decides a lot. A control tower that cannot access clean purchase-order data, contract terms, inventory positions, or lane-level priorities may detect the external signal and still fail to recommend a useful move. A model that floods planners with low-confidence alerts will be muted. A dashboard that treats every disruption as equal will send scarce management attention to the wrong exception.
A Narrower Standard for AI During the Houthi Blockade
The fair test is not whether AI can predict the next Houthi statement, the next military response, or the final oil-price outcome. That would turn decision support into certainty theater. The fair test is whether the system detects operational consequences earlier than the tools it replaces.
For supply chain leaders, that test can be phrased plainly: did the system identify vessel behavior changes before carrier ETAs were revised; did it separate congested and viable terminals before the berth choice disappeared; did it connect diesel margin pressure to the right lanes and contracts; did it show which inventory buffers were worth using; did it help the team document why a more expensive move was still rational before costs moved higher?
This is where the seven-to-ten-day window becomes operationally meaningful. It gives teams a short interval to move from passive visibility to controlled exception management while the facts are still forming.
As of July 23, 2026, the crisis is still moving quickly. The blockade declaration, the reported tanker U-turns, the elevated Yanbu flows, and the diesel margin response are early evidence of a compressed operating environment, not a settled map of the next quarter.[1][2][3] In Q3 2026, predictive visibility is not a guarantee against oil shocks. It is becoming the difference between reacting to a published price surge and making defensible operational moves before that surge arrives.
References
- Houthis threaten to attack tankers using Saudi Arabian ports in Red Sea shipping blockade, The Guardian, July 21, 2026
- The Houthis just announced a blockade on Saudi Arabia. What does it mean for the global economy?, Atlantic Council
- Houthi Red Sea blockade would lift oil prices, workarounds could limit impact, Reuters, July 20, 2026
- When sea freight gets smarter, Siemens Digital Logistics, September 5, 2025
- The biggest supply chain risks of 2026 and how to navigate them, Xeneta
- Why new Houthi threats in the Red Sea could spell trouble for global oil prices and inflation, The Conversation
- Supply Chain Disruptions 2026: How to Build Resilience with AI and Automation, ABI Research
Comments
Join the discussion with an anonymous comment.