
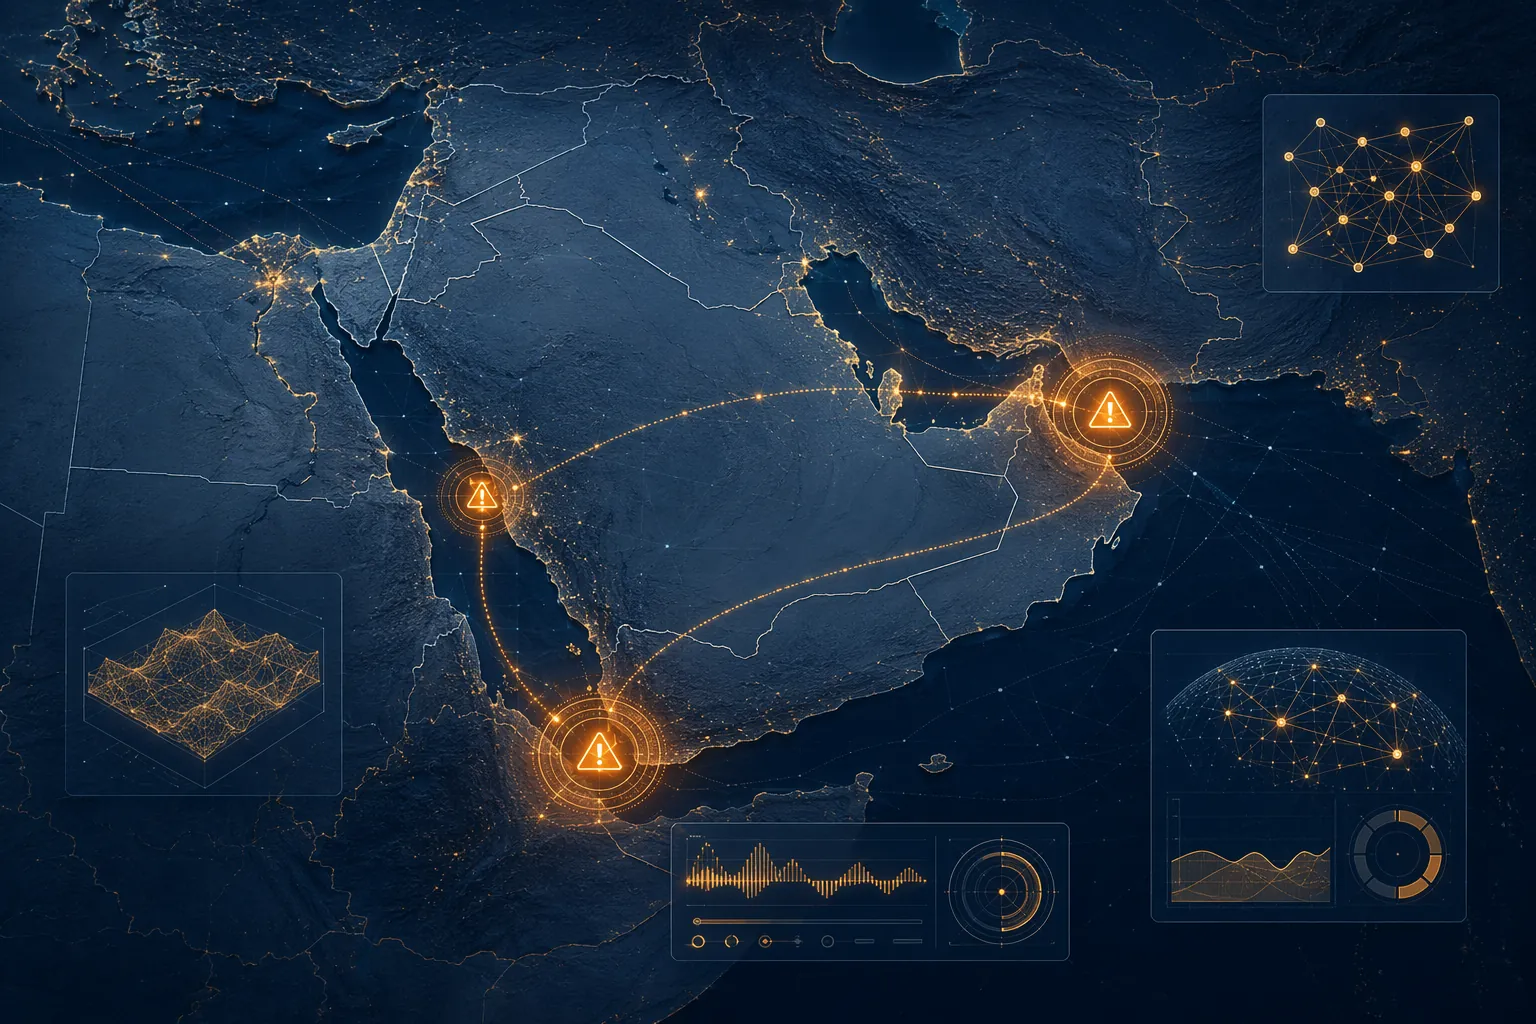
The July 2026 Houthi threat to oil tankers is not just another Red Sea delay story. The sequence matters: the Strait of Hormuz had already been closed since February, Saudi crude had shifted toward Yanbu on the Red Sea, and then the July 20 Houthi blockade threat put Bab el-Mandeb under pressure as well. That made Yanbu less like an alternate port and more like the last release valve in a system that had already lost its first one. Roughly 4 million barrels per day of Saudi crude were moving through Yanbu, while more than 7 million barrels per day were moving through Bab el-Mandeb in June 2026, according to the Atlantic Council’s July analysis of the blockade threat.[1]
The operational signal arrived before any model had time to look elegant. After the Houthi threat, the BBC reported that more than seven tankers made sharp U-turns, a detail sourced to tanker-tracking data rather than to a policy forecast.[2] That is the kind of evidence crisis teams pay attention to: vessels changing behavior, capacity being pulled out of expected rotations, and downstream planners realizing that the workaround they had been using is now part of the exposure.
Reuters framed the July 20 blockade threat as a shock that could lift oil prices, while also noting that workarounds could limit the impact.[3] The problem for supply chain teams is that “workaround” now has a narrower meaning. When Hormuz was available, Red Sea disruption could be modeled as a painful but familiar rerouting problem. When Hormuz is already unavailable, Bab el-Mandeb risk becomes a constraint on the workaround itself.
The Route Optionality That Contained the Last Crisis Is Thinner Now
The 2023–2025 Red Sea crisis trained many companies to think in terms of detours: avoid the southern Red Sea, go around the Cape of Good Hope, absorb longer lead times, reprice freight, and update customer commitments. That muscle memory is useful, but it can also mislead. In the July 2026 configuration, the issue is not whether a ship can draw a longer line around Africa. The issue is what remains protected once that line becomes the default option for too many flows at once.
For crude and chemicals planners, the immediate questions are concrete. Which liftings out of Yanbu are exposed to Bab el-Mandeb? Which refineries or customers have inventory cover long enough to tolerate a Cape route? Which contracts assume lead times that no longer match the sea path? Which downstream products inherit the same risk through feedstock dependency even if they are not physically shipped through the Red Sea?
For manufacturers importing from Asia into Europe, the same geometry shows up differently. The shipment may not be crude. The supplier may not be in the Gulf. But the lane, carrier rotation, insurance assumptions, or container availability can still be affected by longer voyages and displaced capacity. A procurement lead does not need a perfect forecast of Houthi behavior to have a real problem. They need to know whether the supplier they depend on is tied to a lane that just lost schedule reliability.
That is where AI disruption tools become useful, but only if the task is defined tightly. They are not being asked to predict political intent with certainty. They are being asked to shorten the time between a weak signal and an executable plan: detect the chokepoint shock, map it onto the company’s own network, simulate constrained options, and rank the exposures that deserve scarce attention first.
Detection: The Alert Has To Arrive Before the Escalation Email
The first tool cluster is disruption detection: systems that ingest AIS vessel movements, geopolitical event feeds, carrier notices, insurance signals, port advisories, and news events. In a cleaner world, the signal would arrive in sequence: threat announced, carrier advisory issued, route changed, planning system updated. In the real world, those signals often arrive out of order. A sales manager hears a customer is nervous before the control tower has matched the risk to a purchase order. A carrier rep hints at schedule changes before the shipment milestone updates. A vessel stops transmitting cleanly before anyone knows whether it is tactical avoidance, congestion, or data noise.
AI-assisted detection earns its keep when it joins those fragments faster than manual monitoring can. A control tower does not need to wait for a formal disruption bulletin if it can see a cluster of tanker U-turns, a new security threat, a carrier notice, and rising insurance concern around the same chokepoint. The output should not be a dramatic red badge on a map. It should be a ranked set of shipments, lanes, suppliers, customers, and inventory buffers that are likely to feel the consequence first.
This is also where weaker systems show themselves. “Bab el-Mandeb risk rising” is not enough. A planner needs to know whether any open sales orders rely on a lane through that strait, whether the backup carrier has already withdrawn capacity, whether safety stock is physically in the right region, and whether a contract allows substitution, delay, or premium freight. The difference between an alert and a decision is the network context attached to it.
A useful detection workflow in this crisis would look less like a news dashboard and more like a queue for action.
| Signal | What the system should connect it to | Decision it should support |
|---|---|---|
| Tanker U-turns near the threatened route | Expected liftings, vessel schedules, exposed ports, customer allocations | Whether to hold, divert, substitute, or escalate |
| Carrier or port advisories | Bookings, incoterms, contractual lead times, exception rules | Which commitments need revised ETAs or commercial approval |
| Insurance or security changes | Lane cost assumptions, approved carriers, freight budgets | Whether the current plan is still commercially executable |
| Geopolitical event feed updates | Supplier locations, tier-two exposure, alternate sourcing status | Which procurement categories need manual review |
The hard part is not detecting that the Middle East is risky. Everyone can detect that by now. The hard part is detecting which part of the company’s promise book just became fragile.
Digital Twins: Cape Rerouting Is a Capacity Problem, Not Just a Longer Line
Once detection has surfaced the exposed flows, the second tool cluster becomes more important: digital twin scenario modeling. This is where teams test the practical consequences of rerouting around the Cape of Good Hope, changing ports, reallocating inventory, or delaying lower-priority orders.
The Cape route is easy to describe and hard to absorb. Suaid Global estimated that Cape rerouting adds 10–14 days of transit time and raises Asia–Europe container rates by 25–40%, though its figures reflect its own client base and should not be treated as a full-market benchmark.[4] project44 has also highlighted the way Houthi attacks disrupt global supply chains through container routing and schedule effects, which matters because longer voyages absorb vessel capacity even when cargo is still technically moving.[5]
The planning consequence is not simply “add two weeks.” A 10–14 day extension can push inbound components outside a production window, consume safety stock before the next replenishment arrives, trigger air-freight exceptions, or force allocation decisions between customers. A 25–40% rate increase can break a margin assumption that finance approved months earlier. Longer voyages can also absorb fleet capacity, reducing the availability of vessels and containers for lanes that are not politically exposed but still share the same asset pool.
A digital twin is useful here only if it is grounded in real operating constraints. It should know that a refinery cannot treat every crude grade as interchangeable, that a plant may have a frozen production sequence, that a customer contract may penalize late delivery more heavily than premium freight, and that an alternate port may already be congested or commercially unavailable. Without those constraints, the model produces route diagrams. With them, it can show which promises remain feasible.
A practical scenario model for the July 2026 crisis would not stop at “Red Sea closed” or “Cape route selected.” It would compare a small set of options that planners can actually execute.
| Scenario | What changes | What the model needs to expose |
|---|---|---|
| Cape reroute | Transit time, freight cost, vessel utilization, inventory arrival dates | Which SKUs or barrels miss required windows and which buffers are consumed |
| Partial allocation | High-priority customers or assets receive limited supply first | Which commitments are protected and which require commercial escalation |
| Supplier substitution | Approved alternate suppliers or grades replace exposed supply | Qualification limits, price changes, volume gaps, quality constraints |
| Demand deferral | Lower-priority orders or production runs move later | Revenue timing, penalty exposure, service-level impact |
The strongest digital twin output is not the most complex map. It is the cleanest statement of tradeoff: protect these commitments, delay those orders, consume this inventory, pay this freight premium, and escalate these exceptions before the next planning cycle locks.
This is also where AI language can get ahead of reality. The data behind scenario models may be late, incomplete, or commercially stale. A carrier’s public advisory may lag actual network decisions. AIS can be noisy or intentionally obscured. Rate estimates can vary by customer, contract, lane, and timing. If the model treats every input as equally fresh and equally reliable, it can give a false sense of precision at exactly the moment planners need to know what is uncertain.
Supplier-Risk Scoring Has a Narrower Job
The third tool cluster, supplier-risk scoring, should be handled with less drama. It is not a conflict prediction engine. Its job is to identify where the company’s supplier base is structurally exposed to the chokepoint shock: single-sourced materials, suppliers dependent on Red Sea lanes, tier-two inputs tied to Gulf energy flows, or categories where qualification timelines make substitution unrealistic.
A good supplier-risk model connects external events to internal dependency. If a supplier is geographically distant from Bab el-Mandeb but ships through a carrier network that is now rerouting around the Cape, that supplier may still deserve a higher risk score. If a component is low value but production-stopping, it should not be buried under higher-spend categories. If a chemical feedstock depends on crude flows that were shifted through Yanbu, procurement and operations need to see that dependency before the shortage appears as a missed delivery.
Knowledge-graph approaches can help here because they represent relationships rather than just supplier attributes: supplier to site, site to lane, lane to port, port to chokepoint, chokepoint to geopolitical event. That is the logic behind multi-tier visibility work such as supply chain visibility knowledge graphs. The value is not that the graph knows the future. It is that it can reveal the hidden path by which a maritime security event reaches a purchase order.
The scoring output should stay modest. “Supplier likely disrupted” is too blunt. More useful scores separate exposure, substitutability, inventory cover, revenue impact, and confidence in the underlying data. A supplier with high exposure but ample regional stock is a different problem from a supplier with moderate exposure, no qualified alternate, and a part that stops a line.
Where the AI Layer Breaks Down
The July 2026 case exposes the gap between visibility and control. AI tools can surface tanker movements, flag exposed lanes, simulate Cape rerouting, and rank supplier nodes. They cannot create convoy capacity, reopen a strait, renegotiate every freight contract, qualify a new supplier overnight, or manufacture inventory that was never positioned outside the disruption zone.
Data latency is the first constraint. The most important signals in a chokepoint crisis are often private, delayed, or ambiguous. A ship may change course before a formal notice is issued. A carrier may revise rotations before the customer-facing system reflects it. A supplier may know that an input is constrained before the buyer sees a missed ASN. AI can reduce the delay between signal and action, but it still depends on the freshness and trustworthiness of the feeds it receives.
Model calibration is the second constraint. Historical Red Sea disruptions help train assumptions about rerouting, congestion, and rate escalation, but the simultaneous threat to Hormuz and Bab el-Mandeb is not a clean repeat of that history. A model trained on single-chokepoint disruption may understate the effect of losing the fallback route, especially when oil, container, chemicals, and insurance markets are all adjusting at once.
Commercial executability is the third constraint. A scenario can say “use alternate carrier” or “switch supplier,” but contracts, allocation rules, credit limits, quality approvals, and customer commitments determine whether that option exists. The best systems make those constraints visible. They do not erase them.
That distinction matters for teams comparing AI capability roadmaps. Earlier Red Sea planning playbooks, including AI scenario planning for Red Sea supply chain disruption, still apply, but the July 2026 configuration demands a tighter standard. Detection has to connect to dependency mapping. Scenario planning has to connect to cost, capacity, and service commitments. Supplier scoring has to connect to qualification and inventory realities. Otherwise the organization gets faster at seeing a problem it still cannot act on.
The Operational Boundary
The July 2026 Houthi blockade threat makes AI disruption tooling mission-critical for a specific reason: manual monitoring is too slow for cascading chokepoint shocks. By the time a planner manually reconciles tanker behavior, carrier notices, geopolitical updates, inventory positions, and supplier dependencies, the best rerouting capacity may already be gone.
But mission-critical is not the same as sufficient. In this crisis, the alternate route was already impaired before the new threat arrived. That changes the value of AI from “find another path” to “measure the damage, rank the exposure, and decide which commitments can still be protected.” The tool can shorten decision latency and clarify tradeoffs. It cannot restore lost geography.
References
- The Houthis just announced a blockade on Saudi Arabia. What does it mean for the global economy? — Atlantic Council
- Tankers make sharp U-turns after Houthi shipping threat — BBC
- Houthi Red Sea blockade would lift oil prices, but workarounds could limit impact — Reuters, July 20, 2026
- Red Sea Shipping Crisis 2026: Impact on Your Supply Chain — Suaid Global
- Houthi Attacks Disrupt Global Supply Chains — project44
Comments
Join the discussion with an anonymous comment.