
The annual flood plan usually fails in a very ordinary moment: a forecast shifts, a supplier location moves from watchlist to exposed, and a transportation lane that looked usable on Monday may be underwater by Friday. The binder still contains the right names, the right escalation tree, and last year’s flood maps. What it does not contain is a current answer to the question the planner actually has to decide: expedite now, pre-position inventory, reroute around the corridor, or keep watching.
That gap matters because flood disruption is no longer a seasonal exception that can be reviewed once a year. Everstream Analytics reported that flooding accounted for 70% of weather-related supply chain disruptions in 2024, while Resilinc 2024 data cited by the World Certification Institute found flood alerts up 214% year over year and extreme-weather alerts up 119%.[1][2] At the same time, C2ES warns that climate change acts as a threat multiplier and makes historical patterns less reliable as a guide for future supply chain risk.[3]
The practical problem is not that companies have no flood plans. Many do. The problem is that a plan updated on an annual cadence is being asked to govern decisions on a rolling weekly, daily, and sometimes hourly cadence. AI flood risk supply chain disruption planning is useful only if it closes that operating gap: current hazard data in, exposed nodes and routes scored automatically, and recommended actions ranked clearly enough that someone can move before the exception call starts.
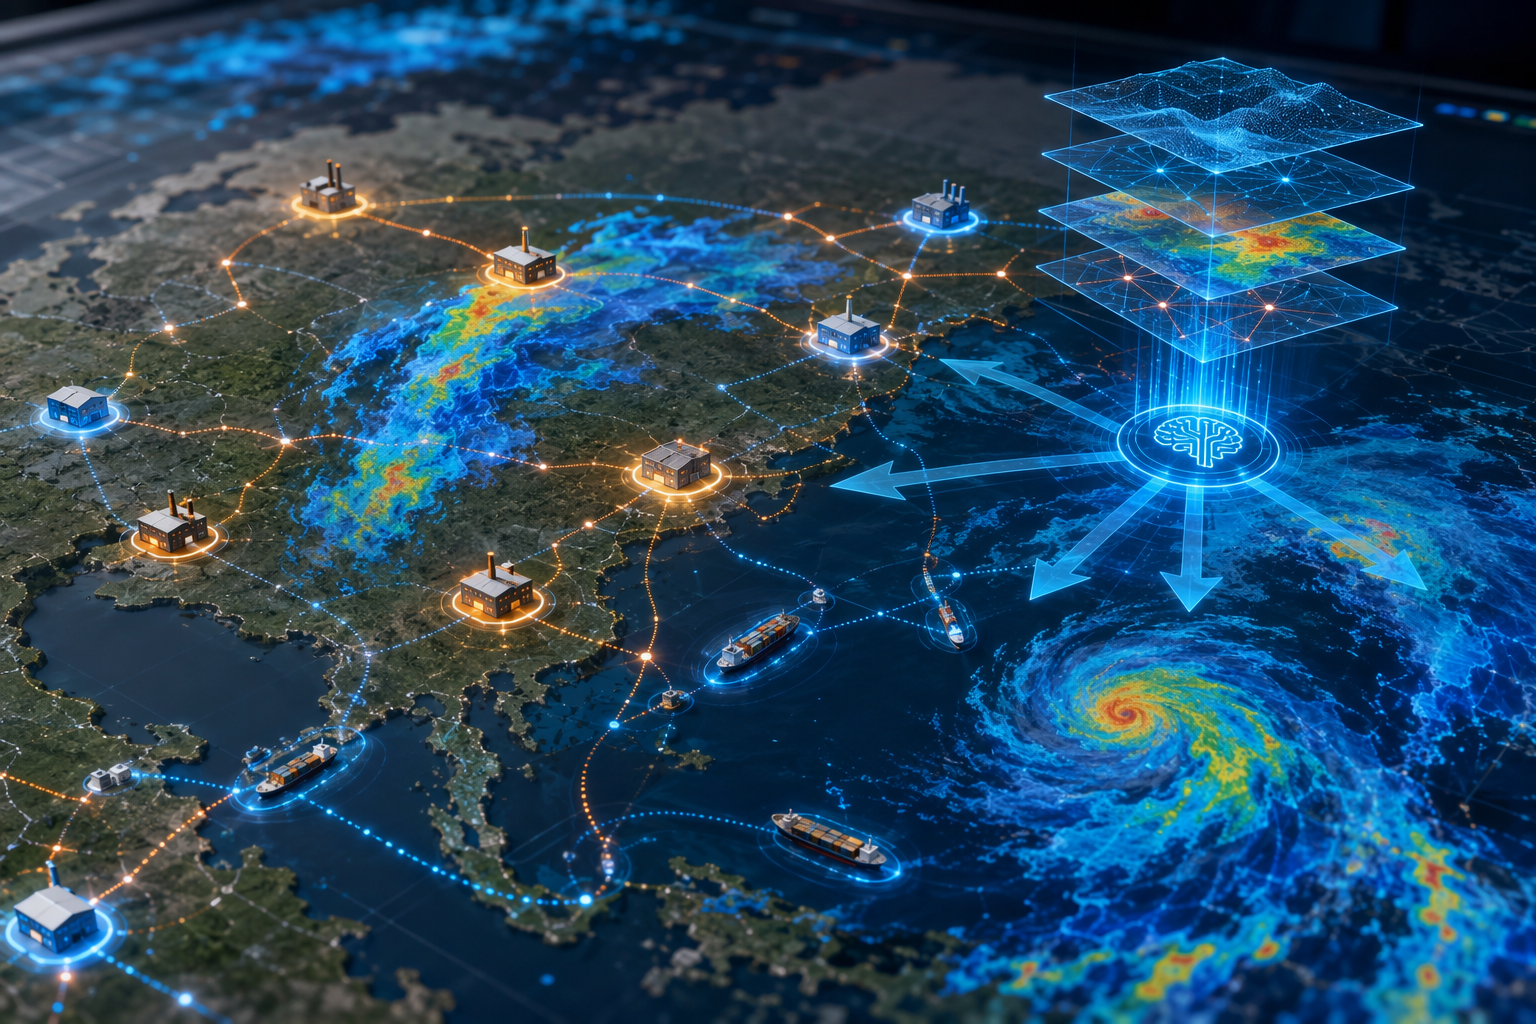
What Changes When the Flood Plan Becomes Dynamic
A static flood plan stores assumptions. A dynamic flood playbook keeps testing them.
The static version says which suppliers are in flood-prone regions, which alternate carriers have been approved, and which plants should be prioritized. That information still matters. But during an actual storm week, the useful plan has to know whether a particular supplier’s latitude and longitude sit inside the newest flood forecast, whether the river gauge upstream is rising, whether the preferred road leg crosses an exposed corridor, whether available inventory can cover the delay, and whether the cost of moving product early is justified by the service risk.
AI does not make those decisions magically clean. It does make it possible to refresh the evidence fast enough to support a decision window that still exists. The playbook becomes a system that continuously compares hazard signals against the supply network and translates the result into action choices.
| Static flood plan | Dynamic AI flood playbook |
|---|---|
| Updated during annual risk review or after a major incident | Refreshes as forecasts, gauge readings, imagery, orders, inventory, and lane status change |
| Ranks suppliers by broad regional exposure | Scores individual supplier nodes, facilities, ports, warehouses, and route segments |
| Lists generic contingency options | Generates ranked actions such as expedite, pre-position, reroute, dual-source, or monitor |
| Depends on manual interpretation during the event | Pushes alerts and recommendations to named owners based on thresholds |
| Captures lessons after the fact, if time allows | Feeds event outcomes back into thresholds, lead times, and model assumptions |
The Workflow That Turns Flood Signals Into Planning Decisions
The center of the dynamic playbook is not a weather dashboard. Weather data is only the first input. The useful workflow connects five moving pieces: real-time data ingestion, node-and-route risk scoring, scenario simulation, recommendation ranking, and post-event learning.
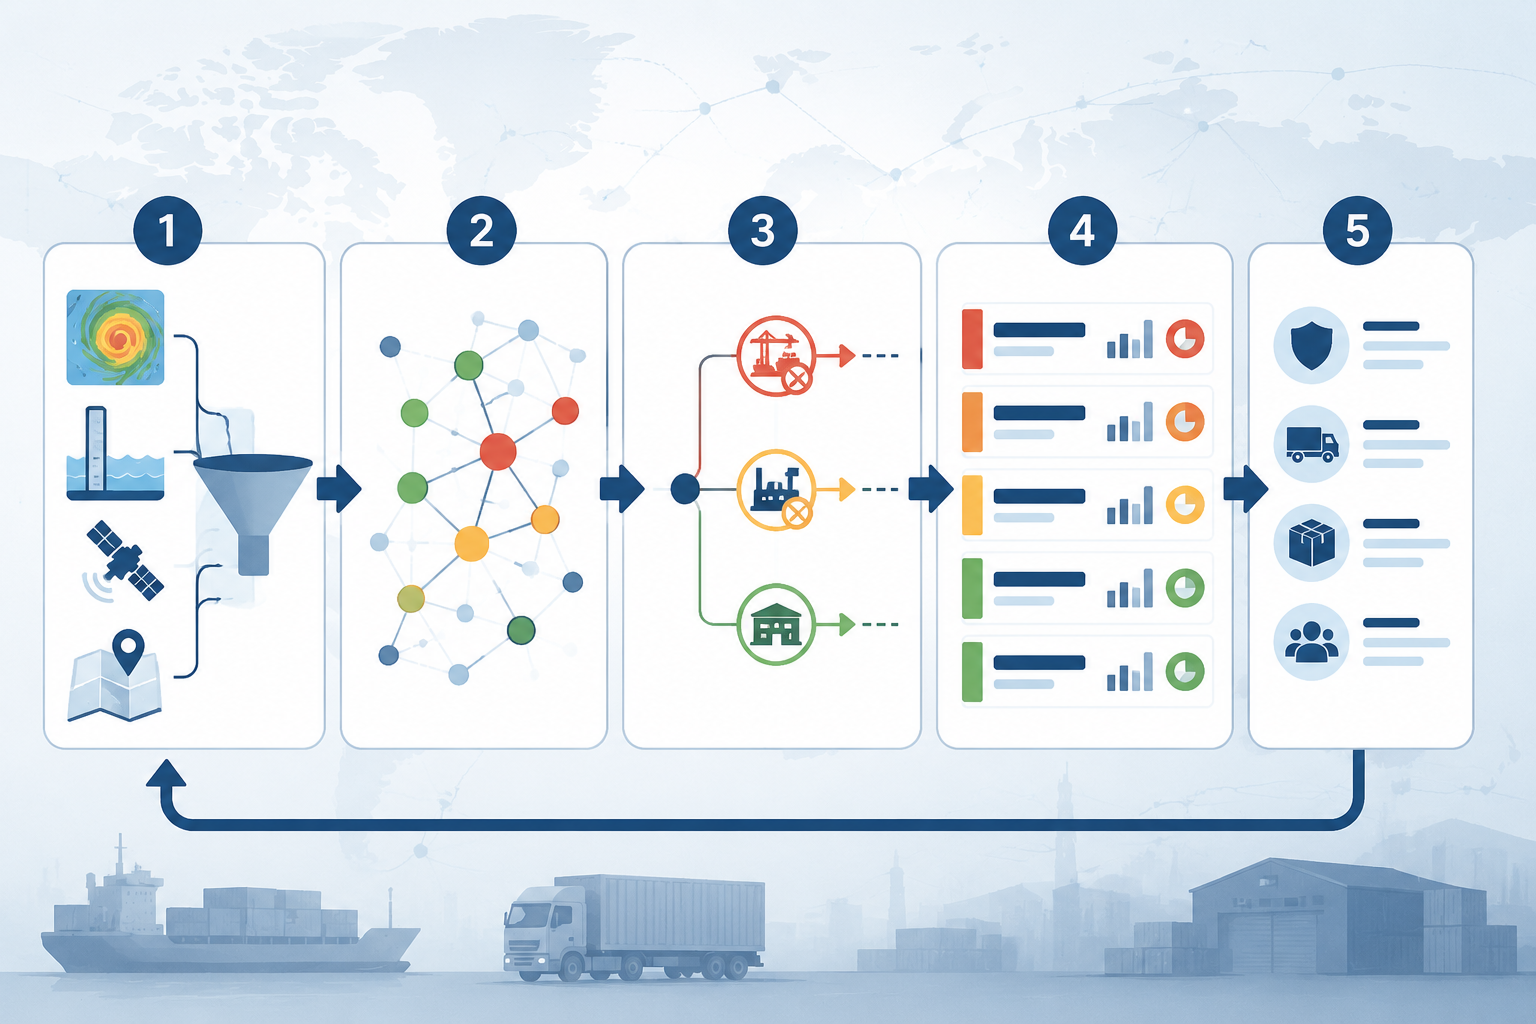
1. Ingest flood signals and supply chain context together
A flood model by itself can tell a team that water risk is rising. A planning system has to know what sits in the path of that risk.
The ingestion layer should combine external hazard signals with internal supply chain context. On the hazard side, that can include weather models, precipitation forecasts, river gauges, flood watches and warnings, satellite imagery, and road or port status feeds where available. On the supply chain side, it needs supplier locations, plant and warehouse coordinates, port and terminal dependencies, approved lanes, carrier commitments, open purchase orders, in-transit shipments, inventory positions, customer demand priorities, and service-level commitments.
The weak point is usually not the sophistication of the model. It is location quality. A supplier record that only says “Houston area” is not good enough when flood exposure can change across a few miles. A lane described only as origin-to-destination city pair hides the bridge, port access road, rail interchange, or cross-dock that may become the actual constraint.
This is where the annual risk register often needs unglamorous repair before AI adds much value. Supplier addresses have to be geocoded. Critical sub-tier nodes need to be identified where the company has visibility. Route legs need enough detail to show the infrastructure actually used. ERP and SCM data need stable identifiers so the flood engine can connect a supplier site to the SKUs, orders, inventory, lanes, and customers that depend on it.
2. Score each node and route on a rolling horizon
The scoring layer is where the playbook starts to become operational. It should not simply mark a region red. It should answer: which specific supplier sites, warehouses, ports, and lanes are likely to be affected, how soon, and with what consequence for supply?
A workable scoring model separates at least three dimensions. Exposure asks whether the node or route sits in the forecast hazard area. Vulnerability asks whether that location or lane is likely to fail under the expected conditions, based on characteristics such as flood history, elevation where available, infrastructure type, and known operating constraints. Business impact asks what happens if the node or route is disrupted: which SKUs are affected, whether alternatives exist, how much inventory is on hand, how long recovery usually takes, and which customers or production lines are waiting.
Those dimensions should not be collapsed too early. A low-value supplier in a severe flood zone may warrant monitoring, while a single-source component supplier with moderate exposure may deserve immediate action. A route segment can be more urgent than the supplier itself if the plant is dry but the outbound corridor is forecast to close.
A seven-day lead-time reference from a Johnson & Johnson AI system reported by the World Certification Institute should be treated as directional rather than a universal flood-planning guarantee.[2] In practice, the horizon should be long enough to support actions that require time: accelerating inbound material, shifting loads to another port, pre-positioning finished goods, or reserving carrier capacity before the market tightens.
A useful score therefore changes as both the storm and the network change. If the rainfall forecast worsens, the exposure score rises. If inventory is consumed faster than expected, business impact rises. If a backup supplier confirms capacity, the recommended action may shift from expedite to monitor. The point is not to produce a perfect red-yellow-green display. It is to keep the ranking current enough that planners can spend their time on the few risks that have become decision-grade.
3. Simulate scenarios that match real operating choices
Scenario simulation should be narrower than many resilience teams make it. A planner does not need twenty theatrical storm paths if only three choices are actionable before the weather arrives.
The useful simulations are tied to decisions: What if the port closes for several days? What if the primary supplier misses one shipment cycle? What if a distribution center remains open but the main inbound lane is unavailable? What if demand spikes in the affected region while replenishment is constrained? The model should test these against inventory, order priority, production schedules, carrier availability, and substitute sourcing rules.
This is also where flood planning can borrow from other disruption playbooks. The same pattern appears in hazard-specific work such as AI supply chain earthquake planning: define the exposed nodes, estimate operational impact, and decide which mitigation options are worth triggering before certainty arrives. Floods differ in data signals and lead time, but the planning discipline is similar.
4. Rank recommendations by cost, timing, and service impact
The recommendation layer is the difference between an alerting system and a planning system.
“Flood risk elevated near Supplier A” is information. “Move two days of critical SKU coverage from Warehouse X to Distribution Center Y by Wednesday because the primary inbound lane has a high closure risk and the alternate lane adds a day of transit” is a planning recommendation. The second version contains a target, an action, a deadline, a reason, and an implied tradeoff.
A ranked recommendation should make four things visible:
- Trigger: the threshold or combination of signals that caused the recommendation.
- Action: expedite, pre-position, reroute, allocate, dual-source, reserve capacity, contact supplier, or monitor.
- Tradeoff: incremental freight cost, inventory imbalance, service protection, production continuity, or customer allocation impact.
- Owner: the role responsible for accepting, rejecting, or modifying the recommendation.
The ranking should not be based only on hazard severity. It should weigh whether action is still possible. A high-risk site with no available mitigation may need executive visibility and customer communication, but it may not deserve the next planner hour if another medium-risk lane can still be protected by rerouting today. Likewise, a recommendation to expedite has to compete with the cost of premium freight and the possibility that the forecast changes.
This is where AI can help with more than prediction. It can compare many combinations of node exposure, inventory coverage, transit time, cost, and service risk faster than a human team can do manually during a storm week. But the output has to stay reviewable. If the recommendation cannot explain why it moved one supplier above another, it will be treated as another dashboard tile rather than a decision aid.
ClimateAi describes a roofing manufacturer that used its platform before Hurricane Ian to identify areas likely to face storm impact and pre-position inventory, resulting in $15 million in additional sales. That is a useful example because the action happened before the hurricane’s demand and logistics effects fully played out. It should not be read as a universal ROI benchmark; it is a single vendor-reported customer case.[4]
McKinsey figures cited by Körber and the World Certification Institute give broader directional support for AI-enabled supply chain planning, with reported reductions in supply chain errors of 20% to 50% and mitigation of lost-sales risk by up to 65%.[2][5] Those are not flood-specific guarantees. They are better used as evidence that better planning signals and faster decision cycles can reduce operational error and lost-sales exposure when the underlying data and workflows are strong enough.
5. Learn from the event instead of archiving it
After the flood, the playbook should not return to its old state. It should absorb what the organization just learned.
The post-event loop compares forecasts against actual impacts, recommended actions against decisions taken, and expected costs against realized costs. If the model flagged a lane as safe but the carrier could not use it, the route data or vulnerability assumption needs repair. If the system recommended expediting and the team ignored it, the review should ask whether the recommendation was wrong, too expensive, too late, or sent to the wrong owner. If a supplier recovered faster than expected, the recovery-time assumption may need adjustment.
This is not just model tuning. It is governance tuning. Thresholds, approval rights, escalation paths, and supplier communication rules all need to reflect what happened under pressure.
Implementation Starts Before the AI Model
The implementation path is less glamorous than a demo, but it is where most of the value is either protected or lost. The sensible order is data readiness, geography mapping, model configuration, threshold design, escalation workflow, and continuous learning.
Clean the records the model will depend on
Start with the nodes that matter most: strategic suppliers, single-source suppliers, high-revenue SKU suppliers, constrained plants, major distribution centers, ports, and recurring lanes. Confirm address quality, coordinates, facility type, dependency relationships, lead times, SKU links, inventory policies, and recovery assumptions. Where supplier visibility stops at tier one, mark that limitation rather than pretending the network is complete.
The same discipline applies to transportation. A route in the transportation management system may be too abstract for flood exposure scoring. If the company knows the port, rail ramp, cross-dock, or highway corridor normally used, that detail belongs in the model. If it does not know, the implementation should identify which lanes are worth enriching first.
Map geography to business consequence
Once the physical network is mapped, connect it to business consequence. A supplier node is not important because it is red on a map. It is important because it supplies a constrained component, supports a high-priority customer, feeds a plant with limited buffer stock, or sits on a route with few usable alternatives.
This mapping should produce a short list of decision categories, not a decorative heat map. For example, one node category may require pre-event inventory positioning because lead times are long and substitutes are weak. Another may only require supplier confirmation because inventory coverage is adequate. A third may need customer allocation rules because demand cannot be fully protected if the site fails.
Configure models around decisions, not curiosity
Model configuration should begin with the decisions the organization is willing to make early. If the company will never pay premium freight before a formal closure, the model should not keep recommending early expedite without an approval rule that can override normal cost controls. If a planner can reserve carrier capacity but cannot shift inventory across regions, the recommendation engine should reflect that authority.
Vendor systems increasingly support this kind of overlay rather than requiring a full replacement of existing planning infrastructure. ClimateAi describes LensConnect as an API that integrates climate intelligence into enterprise systems, Everstream positions its platform around supply chain risk monitoring and event management, and TraxTech describes AI weather forecasting as a layer that can work with supply chain risk processes and operational systems.[4][6][7] The important point is architectural: flood intelligence has to connect to ERP, SCM, TMS, and planning data where decisions are already made.
That also keeps the adoption question sober. The organization is not buying a replacement brain for supply chain planning. It is adding a faster hazard-and-impact layer that can feed existing workflows with better timing and prioritization.
Set thresholds that match action windows
Thresholds are where many dynamic systems become either noisy or timid. If every forecast change generates a high-priority alert, planners will mute the system. If the threshold waits for near certainty, the action window may be gone.
A better threshold design ties alert levels to decisions. A watch threshold may trigger supplier outreach and inventory review. A warning threshold may trigger carrier reservation, production resequencing, or customer allocation preparation. A critical threshold may trigger pre-approved expedite, reroute, or pre-positioning actions. The threshold should include both flood probability and business impact; a forecast does not deserve the same escalation for every node.
The escalation clock should be explicit. If pre-positioning requires four days, an alert at two days is an explanation, not a useful recommendation. The model should know the minimum viable lead time for each action and stop suggesting options whose windows have already closed.
Assign owners before the storm
A dynamic playbook can still fail if recommendations land in a shared inbox with no decision rights. Each action class needs an owner, a backup owner, an approval rule, and a communication path. Supplier outreach, transportation reroute, inventory repositioning, production change, customer allocation, and executive escalation are different jobs. They should not all fall to the person who noticed the alert first.
This is one reason non-flood disruption cases can be useful to planning teams. A case such as the Garden Grove chemical leak AI response is not evidence about flood frequency, but it illustrates the same operating requirement: prediction only matters when it reaches accountable people early enough to change the response.
Keep the learning loop small enough to use
Post-event review should not wait for a quarterly resilience meeting. Within days of the event, the team should capture which alerts were useful, which were late, which recommendations were accepted, which were rejected, and why. The review should update thresholds, lead times, supplier assumptions, route vulnerability, approval rules, and data gaps while the details are still fresh.
The learning loop should also track false positives carefully. A recommendation that protected service but proved unnecessary after the forecast changed is not automatically a failure. But if the system repeatedly triggers expensive moves that do not protect meaningful service risk, thresholds and cost weighting need adjustment.
Where Forecasting Ends and Planning Begins
Real-time forecasting is the visible part of the system, and it deserves attention. Better lead time can create options that did not exist once a closure was confirmed. For readers focused on that predictive layer, the same lead-time pattern appears in logistics applications such as AI demand forecasting for flight cancellations, where the value lies in acting before disruption becomes visible in normal operating reports.
Flood planning, however, cannot stop at prediction. A forecast does not know the organization’s inventory tolerance, margin tradeoffs, customer promises, or internal approval delays unless those rules are connected to it. The planning layer has to translate exposure into ranked options and make the cost of each option visible.
That translation is also what keeps AI from becoming a resilience slide. A board-level claim that AI improves agility is easy to make and hard to operationalize. A recommendation that says to pre-position specific inventory before a hurricane, or to reroute a specific lane while capacity is still available, is the kind of output that can be judged after the event.
The Practical Boundary
AI will not eliminate flood disruption. It will not make river behavior perfectly predictable, guarantee supplier recovery, or replace the ERP and SCM systems that already run orders, inventory, transportation, and production planning. It also will not compensate for missing supplier locations, vague route data, thresholds no one trusts, or escalation paths no one owns.
It can, however, change the operating cadence of flood planning. With usable location data, calibrated thresholds, accountable owners, and a post-event learning habit, the flood plan stops being an annual document and becomes a continuously updated decision system. That is the standard worth applying: not whether the dashboard looks intelligent, but whether it helps the planner take a better action while there is still time.
References
- Report: Floods Pose Top Threat to Supply Chains in 2025, SupplyChainBrain
- Resilinc 2024 data cited by World Certification Institute
- Assessing the Landscape of Climate Risk and Supply Chain Resilience: A Primer for Corporate Leaders and Climate Risk Professionals, Center for Climate and Energy Solutions
- Three ways AI can help companies de-risk supply chains and capture new opportunities during hurricane season, ClimateAi
- McKinsey supply-chain-AI benchmark cited by Körber
- ClimateAi LensConnect, ClimateAi
- AI Weather Forecasting and Supply Chain Risk Management, TraxTech
Comments
Join the discussion with an anonymous comment.