Why Forecasting Terminology Creates Operational Friction
Most experienced demand planners already know what ARIMA is. They have seen prediction intervals in their planning tools. They have sat through vendor demos that describe their platform as "probabilistic" and their competitor's as "statistical." The terminology is not unfamiliar — the problem is that the same words are being used to describe fundamentally different things depending on who is speaking and why.
In a typical vendor evaluation cycle, a planner might hear "statistical forecasting" used to mean: (a) a specific family of classical time-series models like ARIMA or exponential smoothing, (b) any model that uses historical data, (c) a legacy approach that the vendor is positioning against their own "AI-native" product. In the same week, "probabilistic forecasting" might mean: (a) a model that outputs a full distribution of possible outcomes, (b) any model that uses uncertainty quantification, (c) a marketing label for whatever the vendor's ML platform produces.
This inconsistency is not merely semantic. It causes real errors. Planning teams select tools based on a misunderstood capability claim. Internal S&OP alignment breaks down when one stakeholder means "output format" and another means "model architecture." RFP scoring criteria become incoherent when evaluators apply different definitions to the same term across vendor responses.
Core Term Definitions
Each of the five terms below describes either how a model is built (method class) or what a model produces (output format). These are different questions. Conflating them is the root cause of most forecasting terminology confusion in supply chain contexts.
| Term | What It Describes | Precise Definition | Common Misuse |
|---|---|---|---|
| Statistical forecasting | Method class | A family of models — including ARIMA, exponential smoothing (ETS), moving average, and regression — that fit mathematical structures to historical time-series data under explicit distributional assumptions. Describes how a model is built, not what it outputs. | Used as a synonym for 'legacy' or 'non-AI' forecasting, implying it produces only point estimates. In reality, statistical models can produce distributional output. |
| Probabilistic forecasting | Output format | A forecast that assigns probabilities to a range of possible future outcomes — expressed as a full distribution, quantiles, or prediction intervals — rather than a single value. Any method family can produce probabilistic output. | Used as a label for AI-native or ML-based forecasting, implying it is a technique class rather than an output type. Also conflated with 'confidence interval,' which is a narrower concept. |
| Deterministic forecasting | Output format | A forecast that produces a single value as its output — one number representing the expected or most likely demand. Term originates from operations research and planning traditions. Does not imply anything about the underlying model architecture. | Used as a synonym for 'statistical' or 'classical,' implying it is a method class. In practice, ML models also produce deterministic output when they output a single number. |
| Point forecast | Output format | Near-synonym for deterministic forecast. A single-value output representing a central estimate (mean, median, or mode) of expected demand. Term originates from the statistics tradition rather than operations research. | Used interchangeably with 'deterministic' without noting the different disciplinary origins. Also sometimes used to imply the model is simple or unsophisticated. |
| Stochastic forecasting | Output format | Synonym for probabilistic forecasting in certain academic, simulation, and operations research contexts. A stochastic output contains randomness or distributional information rather than a single fixed value. | Used interchangeably with 'probabilistic' without noting that 'stochastic' appears more frequently in simulation and OR literature, while 'probabilistic' is more common in ML and demand planning vendor contexts. |
The Two-Axis Framework: Method Class vs. Output Format
The core analytical problem with forecasting terminology is that two independent dimensions are routinely collapsed into one. Method class — how a model is built — and output format — what a model produces — are orthogonal. Neither axis determines the other.
A classical statistical model can produce a point forecast or a distributional output. An ML model can produce a point forecast or a distributional output. The sophistication of the technique does not determine the output type. The design choice — and the downstream tooling available to consume the output — determines the output type.
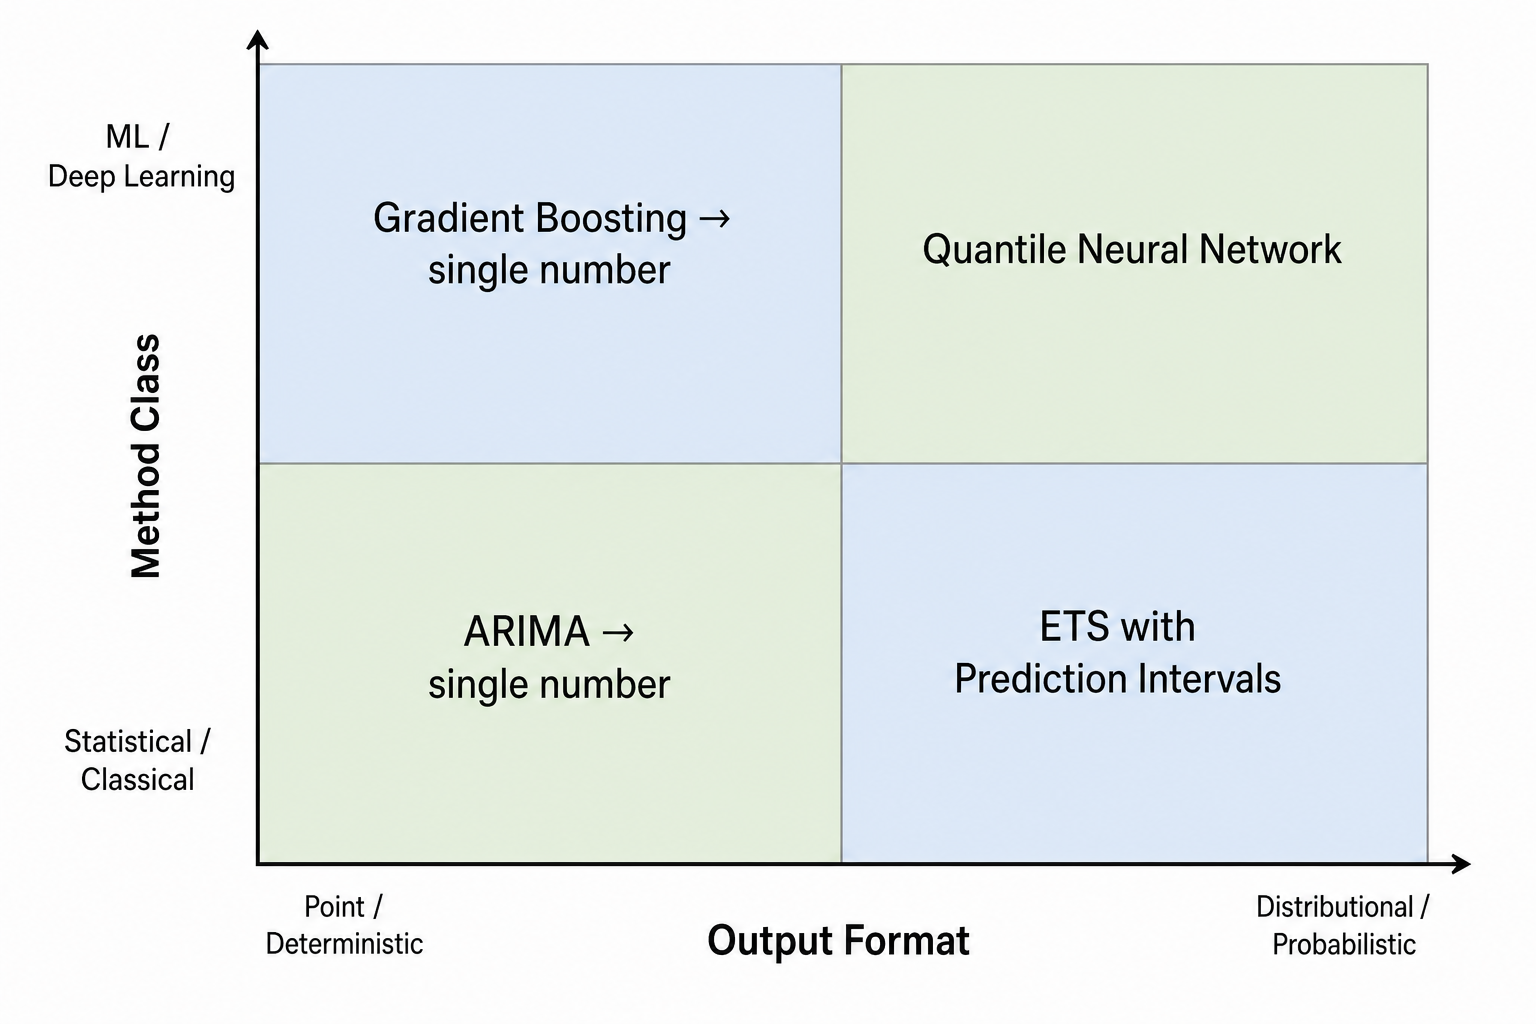
The four quadrants with concrete examples:
| Point / Deterministic Output | Distributional / Probabilistic Output | |
|---|---|---|
| Statistical / Classical Method | ARIMA producing a single demand number per period. Standard ETS producing a mean forecast. Moving average output used as a planning input. | ETS with bootstrapped prediction intervals. Bayesian ARIMA with posterior distribution. Seasonal decomposition with quantile outputs. |
| ML / Deep Learning Method | Gradient boosting (e.g., XGBoost) trained to minimize RMSE, producing a single number. Neural network with MSE loss producing a point estimate. | Quantile regression forest outputting P10/P50/P90 estimates. Quantile neural network with pinball loss. Deep AR or similar architectures trained to output distributional parameters. |
For further context on how ML-based demand forecasting methods fit into supply chain planning more broadly, see Demand Forecasting AI: Definition, Methods, and Operational Context.
Where the Axes Interact: Common, Possible, and Rare Combinations
Not all four quadrants appear with equal frequency in production supply chain systems. Understanding which combinations are common, which are possible but operationally rare, and what each implies for planning system compatibility is more useful than knowing the matrix exists.
- Statistical method + point output: The most common combination in legacy ERP-embedded forecasting. ARIMA or ETS producing a single number per SKU per period. This is what most planners have been working with for decades, and it is what vendors mean when they say 'statistical forecasting' in a dismissive context.
- Statistical method + probabilistic output: Well-established and common in mature demand planning environments. ETS with residual bootstrapping produces quantile estimates. Bayesian ARIMA produces a posterior distribution. Prediction intervals from classical models are a standard output in tools like R's forecast package. This combination directly contradicts the vendor claim that probabilistic output requires AI.
- ML method + point output: Extremely common in deployed ML demand forecasting systems, despite the probabilistic-AI marketing narrative. Most gradient boosting and neural network demand forecasting implementations in production environments output a single number, trained to minimize a symmetric error metric like RMSE or MAE. The model is sophisticated; the output is not distributional.
- ML method + probabilistic output: The combination most vendors are describing when they say 'probabilistic AI forecasting.' Quantile neural networks, deep probabilistic models (e.g., DeepAR), and quantile regression forests fall here. This combination is increasingly common in advanced demand planning platforms, but it is not the default state of most deployed ML forecasting.
For a domain-specific example of probabilistic output format applied in practice, see Probabilistic Demand Forecasting for Seasonal CPG Supply Chains, which illustrates how distributional forecasts connect to downstream inventory policy decisions in a high-seasonality context.
The Hidden Case: ERP Safety Stock as Probabilistic Assumption, Deterministic Output
The standard ERP-embedded safety stock formula — safety stock = z-score × demand standard deviation × lead time adjustment — is a useful worked example of how the two-axis framework breaks down simple categorical labels.
The formula implicitly assumes that demand follows a Gaussian (normal) distribution. The z-score is drawn from that distribution to achieve a target service level. This is a probabilistic assumption — the formula encodes a belief about the shape of the demand distribution and uses it to derive a planning parameter.
But the output is a single number: one safety stock quantity per SKU. The planner enters that number into the replenishment system and treats it as a fixed input. The distributional reasoning that produced the number is not visible in the planning workflow. The output is deterministic even though the underlying logic is probabilistic in assumption.
For operational context on how safety stock formulas relate to probabilistic assumptions and where AI-based approaches change the calculation, see AI Safety Stock Optimization for High-SKU Retail: SCOR Plan Stage Reference.
Common Vendor Misuse Patterns
Three misuse patterns appear consistently enough in vendor marketing, sales conversations, and trade press to warrant explicit identification. Each has direct consequences for tool evaluation.
Pattern 1: Statistical = Legacy, Probabilistic = AI-Native
The most common vendor framing positions statistical forecasting as an outdated baseline and probabilistic forecasting as its AI-powered replacement. This framing implies a quality hierarchy: one is inferior, the other is superior, and the upgrade path runs from left to right.
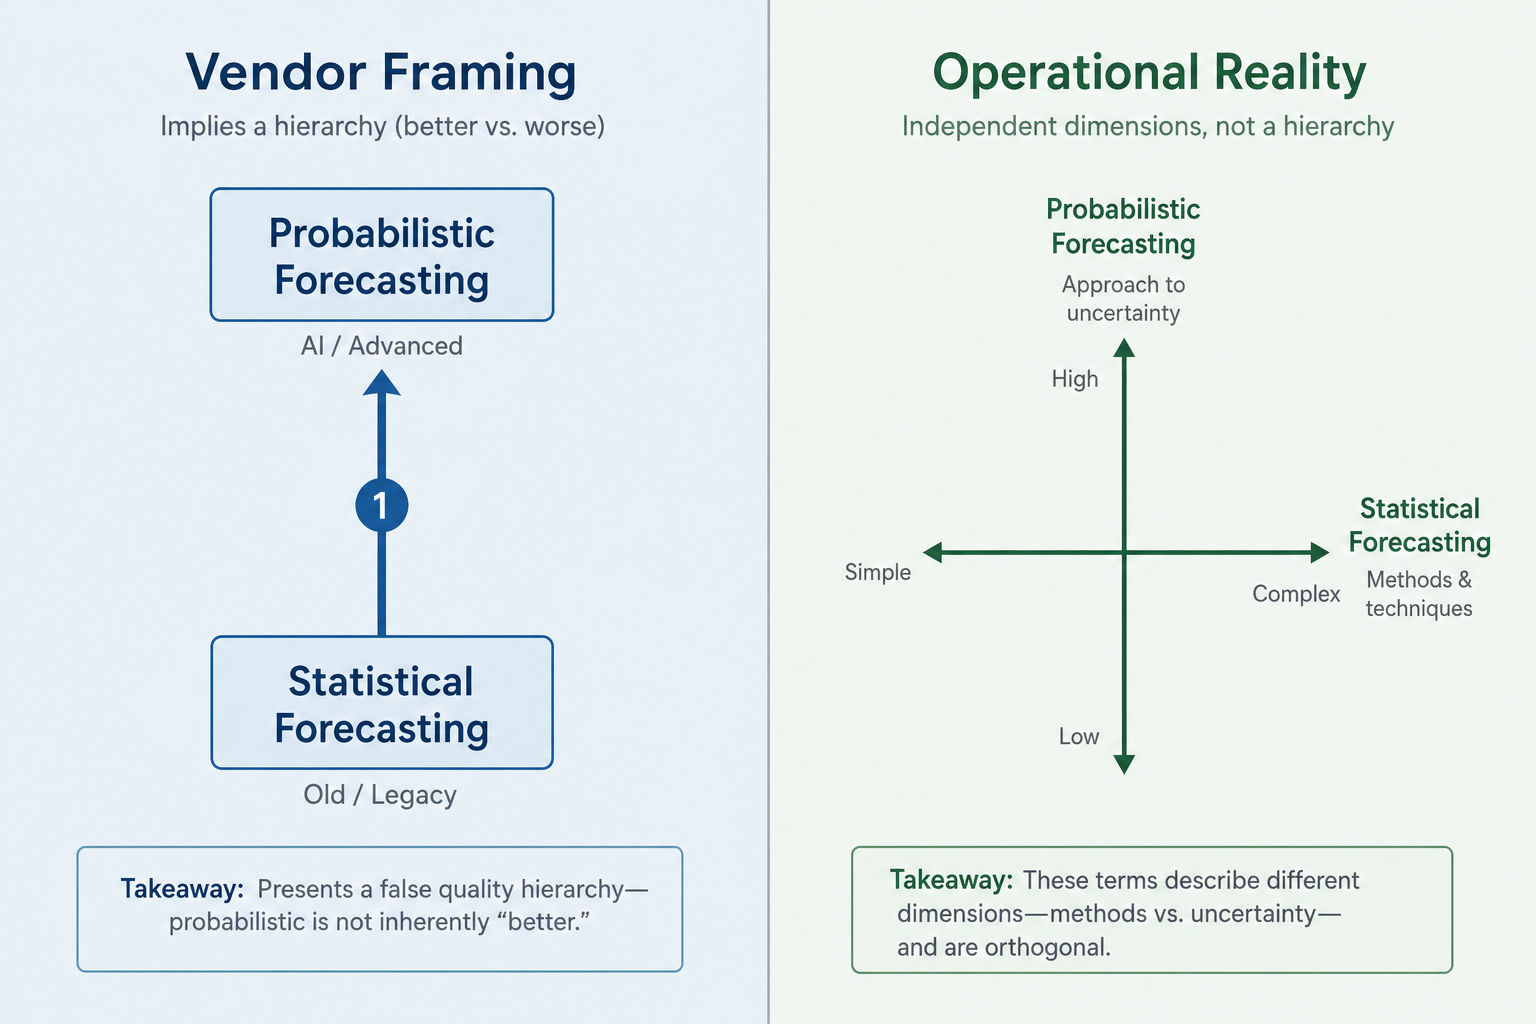
This framing is a marketing construct. Statistical models can produce probabilistic output. ML models frequently produce point forecasts. The output type is a design choice, not a property of the method family. A vendor claiming their AI platform is inherently probabilistic while a competitor's statistical approach is inherently deterministic is conflating two independent dimensions to create a false evaluative ladder.
Pattern 2: Output Type as Proxy for Technique Sophistication
A related pattern treats distributional output as evidence of a more sophisticated underlying model. The claim is implicit: because the system outputs quantiles or prediction intervals, the model must be more advanced than one that outputs a single number.
This conflates output type with model complexity. A simple ETS model with bootstrapped residuals produces probabilistic output. A deep neural network trained with MSE loss produces a point forecast. Output format reflects a design choice about what the planning system needs to consume — it does not index the sophistication of the model architecture.
Pattern 3: Claiming Probabilistic Forecasting Without the Downstream Tooling
The most operationally consequential misuse pattern is vendors who claim probabilistic forecasting capability without the downstream tooling to consume distributional output. A platform that generates quantile forecasts but feeds only a single number (typically the P50) into the replenishment or inventory optimization engine is not delivering probabilistic planning — it is delivering a point forecast with unused distributional information attached.
Many enterprise software vendors have joined the bandwagon and now claim to support probabilistic forecasting... but never actually went further than cosmetically implementing a few probabilistic models. Exhibiting a probabilistic forecasting model is worth next to nothing without the extensive tooling to leverage its numerical results.
This observation from Lokad's probabilistic forecasting reference identifies the practical test: not whether the model can produce a distribution, but whether the planning system downstream actually uses it. Evaluators should ask specifically what happens to the distributional output — does it flow into inventory policy decisions, safety stock calculations, or allocation logic, or does it get collapsed to a mean before it reaches any planning action?
- Ask whether the replenishment or inventory optimization engine consumes a full distribution or a single number. If it consumes a single number, the probabilistic output is being discarded at the planning boundary.
- Ask which quantiles are exposed to planners and in which workflows. Quantile output that is only visible in a reporting dashboard but not connected to order quantity decisions is not operationally probabilistic.
- Ask whether safety stock or reorder point calculations use the distributional output or a separate formula. Many platforms apply a standard z-score formula to a point forecast even when the upstream model is distributional.
Practitioner Vocabulary Guide: Questions to Ask
When a vendor or internal colleague uses one of these terms, the disambiguation question should separate method class from output format. The following questions are designed for use in vendor demos, RFP clarification rounds, and internal planning alignment conversations.
| When you hear... | The disambiguation question | What to listen for in the answer |
|---|---|---|
| "We use statistical forecasting" | Do you mean the model family (ARIMA, ETS, regression), or are you describing the output format? | A precise answer names the model family. A vague answer likely means 'classical/legacy' used as a positioning label. |
| "Our forecasting is probabilistic" | Does the model architecture produce a distribution, or does the system output a distribution to the planner? And does the downstream replenishment engine consume that distribution? | A precise answer distinguishes model output from planning system input, and names the specific downstream consumption point. |
| "We output a deterministic forecast" | Do you mean a single-value output from a model that may have distributional assumptions internally, or a model that produces no uncertainty estimate at all? | Clarifies whether deterministic refers to the output format only or to the absence of any uncertainty quantification. |
| "This is a point forecast" | Is this the P50 of a distributional model, the mean of a classical model, or a model trained directly to minimize a symmetric error metric with no distributional information? | Distinguishes a collapsed distributional output from a model that never produced a distribution. |
| "We provide prediction intervals" or "confidence intervals" | Are these prediction intervals for individual demand outcomes, or confidence intervals for the mean demand? What distributional assumption underlies them? | A prediction interval covers individual outcomes (including variance around the mean). A confidence interval covers the mean only. These are not equivalent for inventory planning purposes. |
The distinction between a probabilistic forecast (distribution of individual outcomes) and a confidence interval (range for the mean) is particularly important in vendor demos. A confidence interval uses normal distribution assumptions via the central limit theorem and applies to the average demand — it does not capture the actual demand distribution shape, which may be skewed, intermittent, or bimodal. A true probabilistic forecast captures individual outcome probabilities including non-Gaussian demand patterns.
For a structural analogue in the same reference series — another disambiguation entry covering two frequently conflated planning terms — see Demand Sensing vs. Demand Forecasting: Definition and Disambiguation.
Quick Reference: Term Definitions, Common Misuse, and Correct Usage Signals
The following table is designed for lookup use — before a vendor meeting, during an RFP review, or when aligning internal teams on planning terminology. It covers all five terms in scope.
| Term | Precise Definition | Describes | Common Misuse Pattern | Signal of Correct Usage |
|---|---|---|---|---|
| Statistical forecasting | A method family that fits mathematical structures (ARIMA, ETS, moving average, regression) to historical time-series data using explicit distributional assumptions. Describes how a model is constructed. | Method class | Used as a synonym for 'legacy,' 'non-AI,' or 'deterministic output' — implying the output format is always a point estimate. | Speaker names a specific model family (e.g., 'we use ETS with Holt-Winters seasonality') and separates it from a discussion of output format. |
| Probabilistic forecasting | A forecast output that assigns probabilities to a range of possible future outcomes — expressed as a full distribution, quantiles, or prediction intervals — rather than a single value. Any method family can produce this output. | Output format | Used as a label for AI or ML-based forecasting, implying it is a technique class rather than an output type. Also conflated with confidence intervals. | Speaker distinguishes the model output from what the downstream planning system actually consumes, and specifies which quantiles or distributional parameters are used in planning decisions. |
| Deterministic forecasting | A forecast output that produces a single value representing expected demand. Originates from operations research and planning traditions. Does not specify the underlying model architecture. | Output format | Used as a synonym for 'statistical' or 'classical,' implying it describes the method class rather than the output type. | Speaker uses it to describe what the planning system receives as input (one number per SKU per period), independent of how the model was built. |
| Point forecast | Near-synonym for deterministic forecast. A single-value output representing a central estimate (mean, median, or mode) of expected demand. Originates from the statistics tradition. | Output format | Used interchangeably with 'deterministic' without noting the different disciplinary origins. Also used to imply model simplicity. | Speaker uses it specifically to describe the output format and distinguishes it from the P50 of a distributional model vs. a model trained with no distributional information. |
| Stochastic forecasting | Synonym for probabilistic forecasting in academic, simulation, and operations research contexts. A stochastic output contains randomness or distributional information rather than a fixed value. | Output format | Used interchangeably with 'probabilistic' without noting the different disciplinary contexts where each term is standard. | Speaker uses it in a simulation or OR context (e.g., Monte Carlo S&OP scenarios) where 'stochastic' is the conventional term, and distinguishes it from deterministic scenario outputs. |
Comments
Join the discussion with an anonymous comment.