
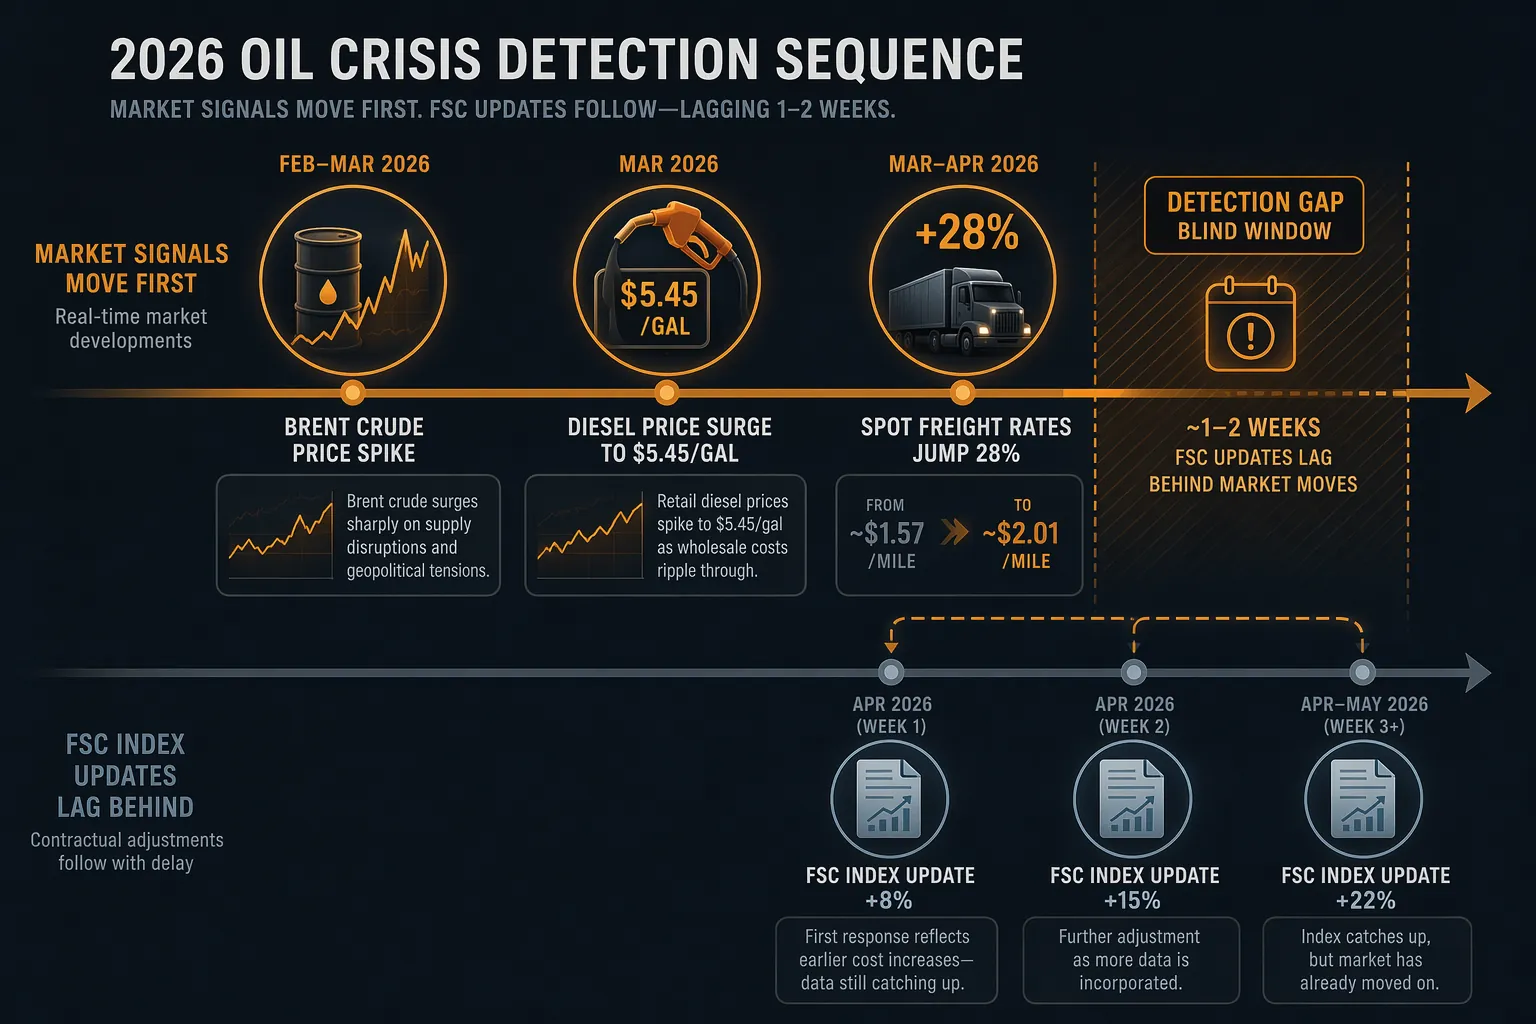
The logistics dashboard did not look broken during the 2026 oil shock. That was the problem. A procurement team could open the fuel surcharge tab, see the latest DOE-indexed table, and conclude the clause was doing its job. Meanwhile, the freight market had already moved: spot rates were up 28% during the Strait of Hormuz crisis, dry van spot pricing had climbed from about $1.57 to $2.01 per mile, and the contract-spot premium had narrowed from $0.39 to $0.11 per mile, a level that says routing-guide leverage is thinning fast rather than merely becoming more expensive.[1][2]
That is the real Brent crude oil price effect on supply chain logistics. The headline oil price matters, but the damage shows up in the clock mismatch: oil reprices in days, diesel follows quickly, capacity tightens before the weekly surcharge mechanism catches up, and carrier acceptance begins to deteriorate while the dashboard still looks administratively current.

The Blind Window Was Operational, Not Financial
Fuel surcharges are built to allocate cost. They are not built to detect capacity stress early. During a fast oil move, that distinction decides who still has options.
In the Q1-Q2 2026 crisis, Brent moved from roughly $80 per barrel to more than $119 per barrel intraday in days, while diesel reached $5.45 per gallon and rose sharply over a period measured in weeks.[2][3] A traditional logistics dashboard that centered the fuel index could show a recognizable escalation, but only after the market had already started repricing capacity. DOE-indexed fuel surcharge mechanisms commonly operate with a 1-2 week reporting lag, which means the carrier is often carrying the cash-flow delta before the shipper sees the full surcharge adjustment.[2]
That lag is tolerable in a gradual fuel cycle. It is much less useful when the freight market treats the oil shock as a capacity event. Carriers do not wait for the shipper’s surcharge table to refresh before deciding whether a lane still works, whether a driver should be repositioned, or whether an exposed spot move is worth covering. A transportation director may be fully compliant with the surcharge clause and still lose carrier acceptance on Monday morning.
What the Spot Market Was Saying First
The cleanest signal was not the crude chart. It was the spot rate move. A 28% jump in spot freight rates during the crisis is not just a higher line item; it is a market-wide message that capacity is being repriced faster than contract governance can absorb.[1]
| Signal | What Changed | Why It Mattered |
|---|---|---|
| Brent crude | Moved from roughly $80/bbl to more than $119/bbl intraday | Set the fuel-cost shock in motion |
| Diesel | Reached $5.45/gal | Raised carrier operating pressure before surcharge recovery was complete |
| Dry van spot rate | Rose from about $1.57/mile to about $2.01/mile | Showed capacity repricing in the transportation market |
| Contract-spot premium | Narrowed from $0.39/mile to $0.11/mile | Indicated that contracted capacity was losing relative protection |
| Fuel surcharge mechanism | Updated with a 1-2 week reporting lag | Confirmed cost movement after the response window had already narrowed |
The contract-spot premium compression deserves more attention than it usually gets. When contract rates sit comfortably above spot, carriers have less financial reason to defect from routing-guide commitments. When that cushion collapses from $0.39 to $0.11 per mile, the practical question changes. The issue is no longer whether the contract rate is theoretically valid; it is whether the carrier still sees the lane as worth protecting when its network is being disturbed by fuel, repositioning costs, and alternative demand.[2]
This is why a dashboard can be accurate and late at the same time. It can correctly report the indexed surcharge, correctly show that fuel is higher, and still fail to warn that the routing guide is about to behave differently. The missing layer is not another fuel tile. It is a capacity signal.
Why Fuel Surcharge Tracking Was Structurally Late
A fuel surcharge is a settlement instrument. It converts an index movement into a commercial adjustment. In a stable market, that is useful because it reduces weekly argument over who pays for diesel movement. In a shock, the same structure can lull teams into believing the exposure is being actively managed when it is only being allocated after the fact.
The delay has three parts. First, the index itself updates on a schedule rather than continuously. Second, the surcharge table translates that index into a rate adjustment after the market has already observed the change. Third, carrier behavior changes before the invoice catches up. A carrier watching diesel climb does not need a completed surcharge cycle to reassess marginal freight, especially on lanes with poor backhaul, tight appointment windows, or weak incumbent economics.
Fuel also does not hit every operation evenly. Research and industry commentary commonly place fuel at a large share of trucking operating cost, but the range varies by use case: long-haul reefer can be much more exposed than short-haul dry van, where the share may be closer to the lower end of the range.[2] That variance matters because a uniform executive fuel dashboard can hide which networks are most likely to break first.
A shipper with strong contract coverage on paper may therefore experience the shock unevenly. Long-haul lanes feel the diesel exposure. Temperature-controlled capacity may tighten faster. Routes with limited carrier density may show tender deterioration before the national spot chart looks dramatic. The surcharge clause can still be necessary, but it is not an early-warning system.
The Signals a Control Tower Should Have Been Watching
The useful claim for AI-powered logistics visibility is narrow. It is not that a platform predicts the next oil shock. It is that a real-time control tower can detect the freight-market response earlier than an index-based dashboard by watching the signals carriers and brokers act on.

The relevant inputs are not exotic: load-to-truck ratios, tender rejection rates, spot rate movement, port and terminal congestion, dwell time, fuel movement, lane-level acceptance, and carrier response times. The value comes from correlating those signals quickly enough to ask a different question: which lanes are losing capacity support before the surcharge table says the cost shock is fully here?
During the crisis, one freight-market analysis cited reefer load-to-truck ratios up 119.9% year over year and flatbed ratios up 89.7% year over year, citing DAT Freight & Analytics data.[3] Those figures should be cross-verified against DAT’s public data before being treated as settled benchmarks. Even with that caveat, the indicator category is the right one: load-to-truck ratios tell a control tower whether demand is outrunning available equipment in a specific market, which is closer to the tender decision than Brent futures are.
Tender rejection rates matter for the same reason. A rejection is not a forecast; it is an operational refusal. If a control tower sees rejections rise on fuel-sensitive lanes while spot rates are moving and diesel is climbing, it can flag a routing-guide failure risk before the procurement report records the full surcharge impact. That is where machine learning can help: not by creating a magic oil forecast, but by ranking which lanes, carriers, regions, and modes are changing behavior fastest.
The strongest technology claim is therefore about timing. Real-time visibility platforms that ingest load-to-truck ratios, tender rejection rates, and congestion data can surface capacity-tightening alerts 2-3 weeks earlier than dashboards that rely mainly on index-based fuel surcharge views.[1][2] That kind of lead time is the difference between having a response menu and having an explanation meeting.
Earlier Detection Only Matters If It Changes the Move
An alert is not a strategy. The test is whether it arrives early enough for the transportation team to change a routing, shift a mode, reserve capacity, or renegotiate a commitment before the market has finished repricing.
In practice, the first response is often lane triage. A control tower should separate lanes where the routing guide is still holding from lanes where spot exposure, rejection rates, or lead-time compression show that the guide is becoming nominal. That triage lets teams decide where to protect volume with incumbent carriers, where to open controlled spot bids, and where to relax service constraints before the network forces the decision.
- If tender rejections rise while spot rates climb, review the carrier sequence before the primary rejects into a more expensive market.
- If load-to-truck ratios spike in one origin market, check whether adjacent origins or different pickup windows preserve capacity.
- If diesel movement is pressuring long-haul lanes, test intermodal eligibility before truckload capacity fully tightens.
- If port congestion overlaps with fuel escalation, separate fuel-driven rate pressure from equipment and dwell-driven disruption.
- If contract-spot premiums compress, identify which routing-guide commitments need a commercial conversation rather than another escalation email.
Intermodal belongs in this response menu, but it should not be oversold. On suitable long-haul corridors, shifting from truckload to intermodal can reduce fuel costs by 15-30%, according to logistics industry analysis and benchmarks.[1] That does not make intermodal a universal answer during an oil shock. It does mean earlier detection gives teams time to evaluate lane length, service tolerance, dray capacity, rail reliability, and customer appointment flexibility before the truckload market is already charging the shock premium.
Contract response is more delicate. Finance wants governance, and rightly so. A fuel crisis is not an excuse to abandon surcharge discipline or convert every lane into a live auction. But contract governance that cannot see carrier behavior changing in real time will protect the spreadsheet longer than it protects the freight. The stronger approach is to use live market signals to decide where to reopen commitments, where to offer temporary relief, and where to enforce the routing guide because the data still supports it.
The Crisis Has Cooled; the Detection Gap Has Not
The Strait of Hormuz episode is now a case study, not a live alarm. By the July 2026 Short-Term Energy Outlook, the U.S. Energy Information Administration reported Brent averaging $85 per barrel in June and forecast Brent around $74 per barrel in Q3 2026 and $65 per barrel in 2027.[4] J.P. Morgan also placed its 2027 Brent forecast at $65 per barrel while noting risk premium tied to Iran and OPEC+ dynamics.[5]
That cooler price path should prevent a bad technology conclusion. The lesson is not that every shipper needs to operate as if Brent is about to revisit the crisis peak. It is that energy volatility keeps exposing the same logistics weakness: many organizations learn about capacity tightening through settlement mechanisms instead of operational signals.
There is also a broader supply chain consequence. Academy of Management Today has argued that oil shocks do more than raise transportation costs; they can push firms to rethink supply chain geography, accelerating regionalization and resilience-over-efficiency decisions.[6] That is a strategic version of the same problem. If fuel volatility changes the economics of distance, the first teams to know are usually not the ones reading a quarterly network design deck. They are the teams watching loads fail, tenders reject, and capacity move.
What Is Worth Buying
The investment case for AI visibility is strongest when it stays close to this operational failure. A platform does not need to claim it can predict oil politics. It needs to show that it can ingest live freight signals, correlate them with fuel movement, and push a lane-level exception early enough for someone to act.
The buying question is therefore not whether the dashboard has a cleaner fuel index widget. It is whether the control tower can answer four practical questions while there is still time left:
- Which contracted lanes are showing tender behavior inconsistent with the routing guide?
- Which markets show load-to-truck tightening before the spot rate fully reprices?
- Which shipments can still be rerouted, delayed, consolidated, or shifted to intermodal?
- Which carrier conversations need to happen before the next surcharge cycle confirms what the market already knows?
That is a narrower promise than the usual control-tower sales pitch, and a more useful one. The 2026 oil shock did not prove that logistics teams can automate their way out of fuel volatility. It proved that the decisive information often arrives below the executive fuel dashboard. When Brent moves fast, the winning signal is not the one that explains the shock most neatly afterward. It is the one that shows capacity tightening while there is still time to change the freight plan.
References
- Oil Price Surge: What It Means for Supply Chains, Logistics and Procurement — Bramwith Consulting
- How Oil Prices Affect Trucking & Freight Costs [2026] — WhyLoyalty
- Impacts of the 2026 Energy Crisis on the United States Freight Market — EZ-Crete
- Short-Term Energy Outlook, July 2026 — U.S. EIA, July 2026
- Oil Price Forecast for 2026 — J.P. Morgan Global Research
- When Oil Prices Rise, Supply Chains Get Costly—and Rewritten — Academy of Management Today
Comments
Join the discussion with an anonymous comment.