
The supply chain disruption from the Red Sea conflict is no longer best understood as an emergency surcharge or a temporary detour. By mid-2026, most major container carriers still treat the Cape of Good Hope as the default route for affected Asia-Europe and Asia-Mediterranean services, while Suez container traffic remains severely reduced from pre-crisis baselines and industry expectations point to diversions continuing through at least 2027.[1]
That operating baseline matters more than the latest headline. A carrier that avoids the Red Sea does not merely add nautical miles. It changes sailing schedules, equipment cycles, blank-sailing risk, booking cutoffs, inventory assumptions, and the credibility of the promised delivery date sitting inside a purchase order.
The Current Baseline: Cape Routing Is Still the Default
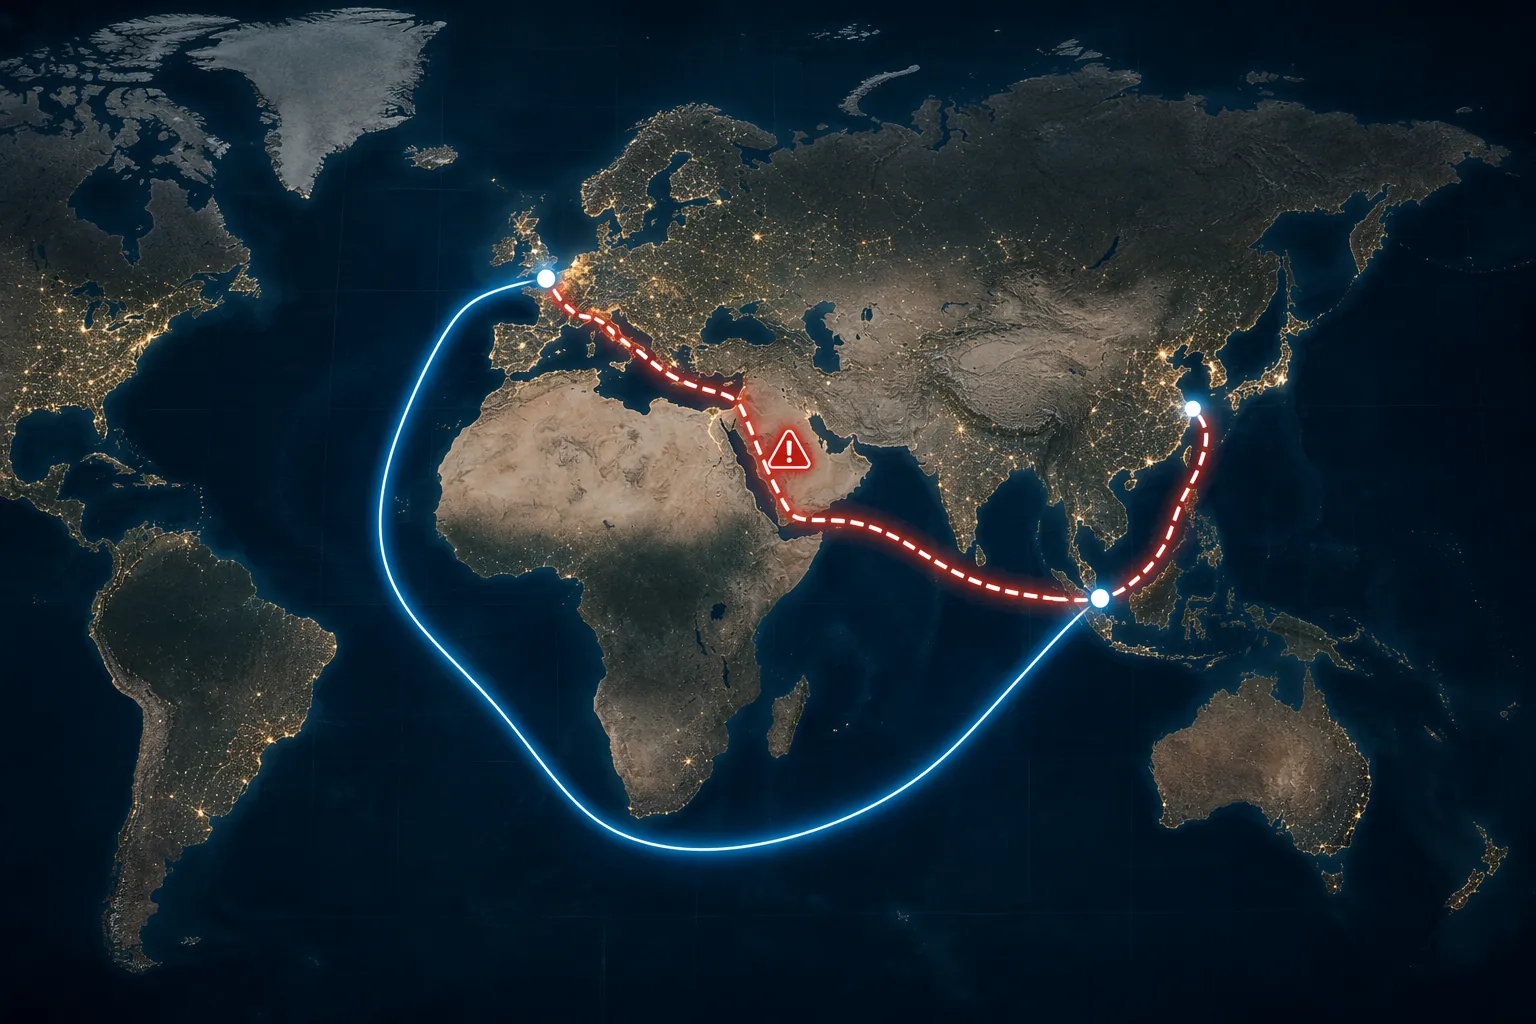
Before the crisis, the Red Sea-Suez corridor was the standard shortcut between Asia and Europe. The Red Sea connects the Indian Ocean to the Mediterranean through the Bab el-Mandeb Strait and the Suez Canal, making it one of the world’s most consequential commercial chokepoints.[2] When that corridor becomes too risky for container lines, the fallback is the long way around southern Africa.
The reroute is now embedded in planning. The usual Asia-Europe lead-time assumption has been stretched by 10-14 days, and the Asia-Mediterranean effect is similar.[1] That extra time is not a rounding error for importers running seasonal programs, spare-parts networks, fashion calendars, or promotional launches. It is the difference between a shipment arriving inside the sales window and a sales team asking why the container is still off West Africa.
The reason this has lasted is simple enough to state and hard to plan around: the security risk has not become reliably insurable, schedulable, or contractable. Carriers can test a return to Suez only if they believe crews, hulls, cargo, and schedules can move through the corridor without unacceptable risk. In early 2026, there was a brief window of cautious reopening, but renewed U.S.-Israel airstrikes on Iran and Houthi counter-escalation closed that window and pushed carriers back toward Cape routing.[1]
How a Regional Security Crisis Became a Shipping System Problem
The first operational break came in November 2023, when Houthi attacks on commercial shipping began and carriers started rerouting vessels away from the Red Sea.[1] The speed of the carrier response was not surprising. Container networks work on fixed rotations, crew schedules, port windows, and equipment repositioning plans. Once a route is judged unsafe, the decision is not made one box at a time; entire service strings have to be redesigned.
Early 2024 showed how quickly the market could reprice that redesign. Asia-Europe spot rates surged 200-300% in the weeks after diversions began.[1] Those rates did not simply reflect fuel and distance. They reflected uncertainty: longer round trips, disrupted vessel rotations, reduced schedule reliability, equipment imbalances, and the premium shippers were willing to pay to secure space while everyone was trying to rebook at once.
By early 2025, container traffic through Suez had fallen 90% versus pre-crisis baselines.[1] That is the point at which the word “disruption” starts to understate the issue. A disruption interrupts a normal system. This became an alternate operating system.
Route-Level Impacts
The impact is uneven by lane. Asia-Europe and Asia-Mediterranean absorb the heaviest blow because the Suez shortcut is central to their normal routing. Asia-U.S. East Coast services can also feel the effect through altered network choices and all-water service changes. Asia-U.S. West Coast lanes are less directly exposed, which is why some shippers have pushed more cargo toward Pacific routing and inland North American transport when service requirements justify the trade-off.
| Lane | Typical Cost Impact | Typical Transit-Time Impact | Planning Meaning |
|---|---|---|---|
| Asia to Europe | +25-40% | +10-14 days | Core exposure; purchase-order calendars and safety stock assumptions need recalibration. |
| Asia to Mediterranean | +30-45% | +10-14 days | Often the hardest-hit container lane because the Red Sea route is the natural approach. |
| Asia to U.S. East Coast | +15-25% | +8-12 days | Spillover lane; affected by longer services, capacity displacement, and routing substitutions. |
| Asia to U.S. West Coast | +5-10% | 0-2 days | Comparison lane; less exposed to Red Sea routing and therefore useful as a diversion option. |
The Asia-Europe numbers are the easiest to quote and the hardest to absorb operationally. A 10-14 day extension means inbound containers may miss distribution center appointment windows, production components arrive after the factory has already reshuffled the build plan, and retailers either pull inventory forward or accept a thinner on-shelf position. The cost increase is visible in the freight invoice; the planning cost shows up in less tidy places.
The Asia-Mediterranean lane deserves separate attention because it is not just “Europe with a different port name.” For many Mediterranean destinations, the Red Sea-Suez route is the natural geography. Routing around the Cape means a vessel first passes southern Africa and then works back toward the Mediterranean, adding time in a way that can be particularly awkward for importers serving Southern Europe, North Africa, and eastern Mediterranean markets.
Asia-U.S. East Coast exposure is more indirect but still real. When carriers commit vessels to longer Cape voyages, they have fewer ships available for other rotations. Network planners then adjust schedules, blank sailings, port calls, and equipment flows across trade lanes that never physically enter the Red Sea. That is why a buyer whose freight moves to Savannah or New York can still feel a crisis centered near Bab el-Mandeb.
Asia-U.S. West Coast routing has become part of the response set because its exposure is lower. That does not make it free capacity or an automatic substitute. It can shift pressure to rail, drayage, transloading, and inland delivery commitments. But as a lane comparison, it clarifies the larger point: the crisis has pushed shippers to think less in terms of one ocean leg and more in terms of end-to-end path design.
The Capacity Crunch Is the Mechanism
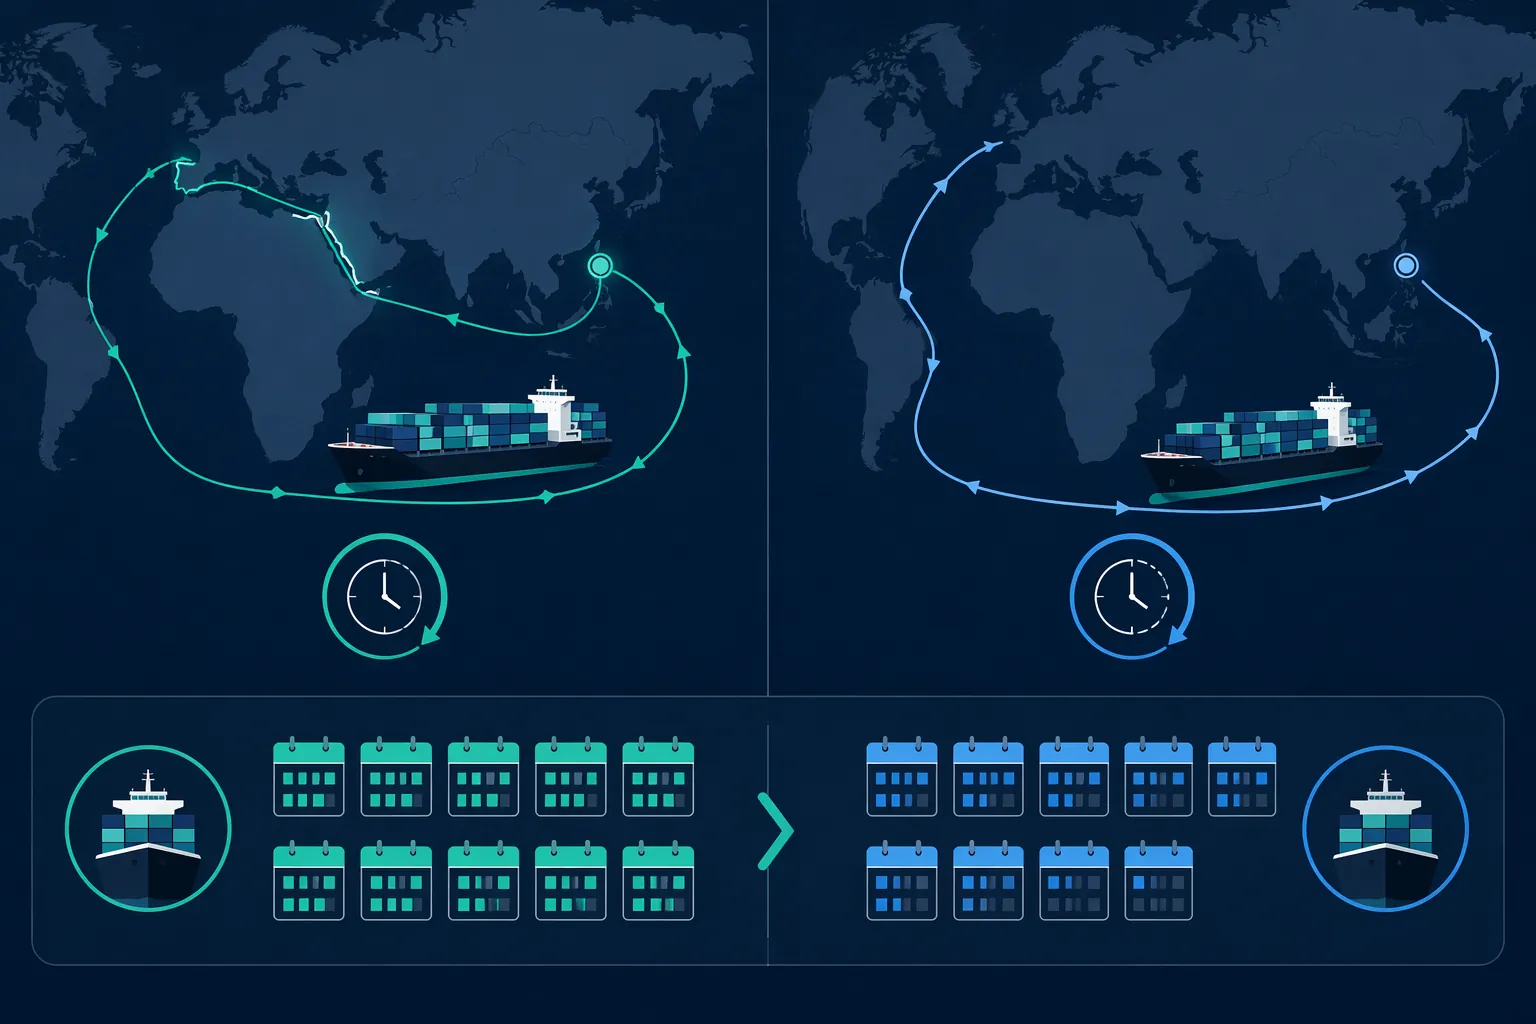
The most important number in the Red Sea crisis may not be a freight rate. It is the estimated 5-7% of global container fleet capacity tied up by longer Cape of Good Hope voyages, roughly 1.3-1.8 million TEU pulled from the available market.[1] The ships still exist. They are still moving cargo. But they are spending more days per round trip, which means each vessel completes fewer annual loops.
This is how a regional security event becomes a global capacity problem. A carrier does not need to cancel a service to reduce effective capacity; it only needs the same ship to take longer to return. The next loading window then has fewer vessels available, or a vessel arrives late enough that the schedule has to be patched. Equipment follows the same logic. Containers that spend more time at sea are not available for the next export booking.
Transit-time data shows the disruption outside carrier commentary. project44 reported that, in December 2024 data, Southeast Asia to U.S. East Coast transit times increased 47%, while China to Europe transit times increased 25%.[3] Those two figures are useful because they measure different types of exposure: one lane shows spillover into a transpacific-to-Atlantic market, while the other captures a core Suez-dependent trade.
The capacity drag also explains why shippers can see higher costs or weaker reliability even when their own cargo is not booked through the Red Sea. Ocean shipping networks share vessels, containers, port calls, feeder connections, and alliance schedules. Stress in one corridor moves through the system as schedule padding, missed connections, rolled cargo, and sudden scarcity of the right box in the right origin market.
Rates Moved First, Contracts Followed
Spot rates reacted fastest because the spot market prices fear and scarcity before procurement teams can renegotiate annual agreements. The early 2024 Asia-Europe jump of 200-300% was a stress signal, not a clean forecast for every contract that followed.[1] It told shippers that route risk had entered the price of capacity, and it told carriers that the market would pay for reliability when space tightened.
By 2026, the contract picture had become more nuanced. Xeneta’s 2026 risk analysis noted softened Asia-Europe contract rates as carriers cautiously considered the possibility of a Suez return.[4] That does not mean the crisis was over. It means procurement teams were negotiating in a market where new vessel supply, demand conditions, and geopolitical uncertainty were pulling in different directions.
For shippers, this is where contract design matters. A low rate that assumes an uncomplicated Suez routing can fail operationally if the carrier keeps routing via the Cape or applies disruption-related surcharges. A more useful agreement spells out routing assumptions, surcharge triggers, space commitments, allocation rules, and what happens if the Red Sea reopens for some carriers but not others.
Some market guidance in 2026 pointed to contract-rate locking opportunities 15-25% below spot on disrupted lanes.[1] That kind of spread is worth attention, but it should not be read as a universal savings guarantee. It depends on lane, season, equipment type, carrier risk appetite, and whether the contracted service level is actually usable under Cape routing.
Inflation Was a Real Concern, but Not the Whole Story
The crisis drew macroeconomic attention early because container freight is embedded in the delivered cost of traded goods. In February 2024, J.P. Morgan estimated that, if the rate spike persisted, it could add 0.7 percentage points to global core goods inflation and 0.3 percentage points to overall core inflation in the first half of 2024.[5]
That estimate belongs in its time period. It was an early-phase upper-range concern, not a mid-2026 measurement of what the crisis is currently adding to inflation. Its value now is that it shows why the disruption quickly moved from logistics departments to executive committees and policy briefings. Freight shocks can fade from consumer prices faster than they fade from planning behavior.
What Changes Inside the Supply Chain
The first adjustment is inventory timing. Safety stock that was calibrated to a Suez transit assumption is no longer calibrated to the operating reality of a Cape default. The relevant question is not simply how many extra days the ocean leg takes. It is how much variability has entered the lane and where that variability hits: supplier release, origin port dwell, ocean transit, transshipment, destination port arrival, inland handoff, or final delivery.
A planner does not need to make every SKU safer. The sensible split is by consequence. Components that stop production, seasonal goods with narrow selling windows, high-margin fast movers, and customer-committed inventory deserve different buffers than slow-moving, substitutable, or low-service-risk items. The Red Sea crisis rewards that level of segmentation because a flat buffer across the network turns uncertainty into working-capital drag.
Carrier management also changes. Procurement teams need to know which carriers are defaulting to the Cape, which will consider Suez under specific security conditions, which ports are being omitted or served by feeder, and how each carrier treats disruption surcharges. The cheapest named lane rate is not enough if the sailing schedule behind it is unstable.
Routing diversification becomes more practical when it is treated as a decision tree rather than a slogan. A shipper can predefine which products may move through U.S. West Coast gateways, which European flows can accept rail or truck extensions from alternate ports, which urgent orders qualify for air, and which orders should simply be released earlier. The operating value is in making those rules before the booking desk is already out of options.
- Recalculate safety stock by lane variability and service consequence, not by a single global buffer.
- Write routing assumptions and disruption clauses into ocean contracts instead of treating them as informal carrier updates.
- Keep Pacific routing available for SKUs that can absorb inland cost and handling complexity.
- Pre-approve modal switching rules for orders that genuinely justify air, rail, or expedited inland moves.
- Separate near-term shipment rescue from longer-term sourcing changes such as nearshoring or China+1.
Rail Helps Some Cargo, Not All Cargo
China-Europe Railway Express is compelling on paper because reported transit is 18-22 days versus 38-46 days for Cape-routed ocean service, with near-parity cost in the cited 2026 market context.[1] That comparison is exactly why rail should be on the routing map for some Asia-Europe flows.
The limitation is cargo fit. The service is not a universal substitute for ocean freight because restrictions exclude reefer, hazardous, and non-TEU-dimension cargo.[1] It is better treated as a selective relief valve for compatible, time-sensitive freight than as a replacement for the container shipping network.
Insurance Is a Cost Signal
War risk insurance is not just a back-office line item. Reported Red Sea transit premiums jumped to 0.5-1.0% of cargo value, making insurance a practical signal of how underwriters price the corridor’s risk.[1][6] If a shipment requires Red Sea passage, that premium affects the cost comparison against Cape routing, alternate ports, rail, or air.
It also disciplines decision-making. A route that appears faster can be less attractive once insurance, crew risk, carrier willingness, surcharge exposure, and potential delay from renewed escalation are included. Logistics teams do not need to become insurance specialists, but they do need insurance costs visible in routing decisions rather than discovered after the fact.
The 2027 Outlook Is a Planning Assumption, Not a Forecast
The industry’s working expectation that diversions continue through at least 2027 should be handled carefully.[1] It is useful for budgeting, contract duration, inventory policy, and network design. It is not a confident prediction of the conflict’s political end state. The lane map can be planned more firmly than the geopolitics can be forecast.
New vessel supply may soften part of the pressure. Research cited 3.2 million TEU of new vessel deliveries on order that could help ease the capacity gap.[1] More ships, however, do not restore the lost shortcut. They can reduce scarcity, improve schedule recovery, or blunt rate pressure, but they do not remove the extra miles from a Cape routing.
That distinction is important for procurement. If new capacity lowers rates while carriers still avoid Suez, shippers may feel financial relief without operational normalization. Transit times can remain longer, inventory can remain tied up, and planning calendars can still need the Cape assumption even if the invoice looks less alarming than it did in early 2024.
The Adjustment Will Outlast the Crisis
If the Red Sea becomes reliably navigable again, some cargo will return to Suez quickly. The route is too efficient for carriers and shippers to ignore when the risk is acceptable. But the operating habits built during this disruption will not simply disappear. Procurement teams have learned to ask different questions about routing clauses. Planners have learned where their buffers were too thin. Executives have seen how a single maritime chokepoint can change working capital, service levels, and customer commitments.
The practical choice is not between predicting the conflict and waiting for it to end. It is between assuming Suez will be available when needed and building supply chains that can still function when it is not.
References
- Red Sea Shipping Crisis 2026: Impact on Your Supply Chain, Suaid Global, 2026.
- Another Hormuz? The Red Sea's Threat to the Global Economy, CFR, June 2026.
- The Red Sea crisis: A year of Houthi attacks, project44, December 2024.
- The Biggest Supply Chain Risks of 2026, Xeneta.
- The Impacts of the Red Sea Shipping Crisis, J.P. Morgan, February 2024.
- Red Sea Shipping Disruption 2026, Cooperative Logistics Network, 2026.
Comments
Join the discussion with an anonymous comment.