
Oil price shocks rarely arrive as a tidy input cell. In the 2026 Hormuz crisis, a seven-day military conflict affecting the Strait of Hormuz pushed Brent crude from about $60 to $107 per barrel before prices fell after a June 18 U.S.-Iran MOU; the EIA’s July 2026 Short-Term Energy Outlook noted that global oil markets adjusted trade flows faster than expected.[1] That is the right starting point for supply chain disruption planning around oil price volatility: the stress is not just fuel. It is fuel plus lane capacity, carrier behavior, supplier economics, inventory drawdown, customer allocation, and finance approvals moving at the same time.
A deterministic what-if run can still be useful for a narrow question: what happens if diesel is up 12% and nothing else changes? The problem is that nothing else holds still during a real oil shock. Ocean routes reprice, trucking capacity tightens around exposed corridors, petrochemical inputs move through supplier quotes, and planners start discovering which “optional” lanes or vendors were never truly available at surge volumes.

The useful promise of AI scenario simulation is not that it predicts the exact next crisis. It is that it gives planners a distribution of plausible damage before the invoice, expediting request, or plant shutdown exposes the weak point. The best version combines three different tools that should not be collapsed into one vague AI label: Monte Carlo simulation to sample many possible outcomes, a digital twin to show how those outcomes propagate through the network, and generative AI to help planners define, vary, and document scenario families quickly.
The Planning Failure Is Usually Concurrent, Not Sequential
In many S&OP rooms, “scenario planning” still means a planner changes one assumption, waits for a recalculation, and then waits longer for someone to decide whether the result is believable. That workflow is slow, but speed is not the only weakness. The larger flaw is sequencing. Fuel first, then freight, then supplier cost, then inventory. The real network experiences them together.
A Hormuz-type shock makes that obvious. A planner does not need a model that only says transportation expense rises when oil rises. They need to know which lanes cross a threshold where a contracted carrier rejects spot exposure, which plants become uneconomic if resin or fuel surcharges move together, which customer commitments consume scarce inventory fastest, and whether a backup supplier creates a new logistics bottleneck rather than removing the old one.
That is where probabilistic simulation earns its place. Instead of asking for one approved future, it asks how often different combinations of shocks produce unacceptable outcomes. A useful model does not merely return an average cost increase. It shows tails: the low-probability, high-consequence cases where transport spend, service failure, and inventory depletion stack in the same planning window.
What Monte Carlo Adds That a Spreadsheet Sensitivity Table Does Not
The strongest quantitative evidence in the current research comes from a 2025 Nature Scientific Reports study by Awan and coauthors. The study used Monte Carlo simulation to model downstream oil supply chain disruptions in Pakistan and tested concurrent scenarios including supply drop, demand surge, transport cost inflation, and pipeline failure. In the modeled network, those combined disruptions increased network transport cost by 45-50%.[2]
That 45-50% result is useful because it puts a number on compounding disruption. It is not useful as a universal benchmark. The study is about a specific downstream oil supply chain in an oil-importing country, with its own network topology, infrastructure constraints, and disruption assumptions. A U.S. retailer, a Gulf Coast chemical producer, and a European industrial manufacturer should not borrow the percentage and paste it into a board deck as expected exposure.
The transferable lesson is methodological. Monte Carlo simulation lets planners assign ranges and probability distributions to uncertain inputs instead of pretending each input has one planning value. Fuel cost can move across a range. Demand can surge in some regions and soften in others. A pipeline, port, or lane can fail for some simulated runs and remain available in others. The model then samples many combinations and returns the spread of outcomes.
| Planning Question | Deterministic Run | Monte Carlo Simulation |
|---|---|---|
| Fuel cost | One assumed increase | A distribution of possible increases |
| Transport capacity | Usually fixed unless manually changed | Can vary by lane, disruption state, or capacity constraint |
| Supplier behavior | Often treated as available or unavailable | Can be sampled across delay, cost, and fulfillment assumptions |
| Output | Single expected cost or service result | Range of outcomes, including tail-risk cases |
| Planner action | Debate whether the single case is realistic | Choose trigger points and response playbooks for high-risk ranges |
The practical question is not whether the simulation looks mathematically impressive. It is whether the output tells a transportation, sourcing, inventory, or commercial owner what changes before the market moves again. A probability distribution that cannot be tied to a lane change, supplier allocation, inventory release, contract clause, or customer promise is analysis theater.
The Digital Twin Shows Where the Shock Travels
Monte Carlo simulation produces distributions. A digital twin gives those distributions somewhere operational to land. In supply chain planning, the twin is a working representation of suppliers, plants, ports, lanes, carriers, warehouses, inventory policies, costs, lead times, and service commitments. It does not need to be a perfect mirror of the enterprise to be useful, but it does need enough fidelity that a simulated fuel shock follows the same routes and constraints the business actually uses.
Without that network representation, oil volatility is too easily reduced to a surcharge. With it, the planner can see propagation. A higher bunker adjustment factor may make one ocean lane more expensive, but the resulting decision to shift volume can overload a different port pair. A backup supplier may reduce material risk while increasing inland freight exposure. A regional warehouse that looks like a buffer may become a trap if replenishment lead time stretches while local demand accelerates.
This distinction matters when people talk about “running hundreds of scenarios.” Hundreds of variations are not valuable if they are variations on the wrong network. The twin is where assumptions meet physical and contractual reality: minimum order quantities, carrier commitments, production calendars, inventory positions, incoterms, port dependencies, and customer priority rules. Bad master data will not become resilient because a model sampled it many times.
Generative AI Belongs at the Scenario-Definition Layer
Generative AI is helpful here, but not because it replaces simulation. Its best role is at the front and back of the workflow: helping planners draft scenario families, vary assumptions in natural language, document why a scenario exists, and translate model output into reviewable playbooks.
A planner might ask for a short conflict scenario, a prolonged chokepoint scenario, and a de-escalation scenario with delayed carrier repricing. That is scenario design, not statistical inference. The March 2026 Logistics Viewpoints analysis of short versus prolonged U.S.-Iran conflict impacts on global manufacturing is a useful example of the kind of scenario framing planners can adapt: duration, geographic exposure, trade flow adjustment, and manufacturing dependency are treated as scenario variables rather than a single geopolitical headline.[3]
The quantitative work still needs the simulation engine and the network model. If generative AI suggests that a prolonged disruption could raise transport cost, the Monte Carlo model must define how that cost varies, how often it appears in simulated runs, and where it combines with demand, supply, or infrastructure stress. If the model cannot make that handoff, the organization has a narrative generator, not a planning capability.
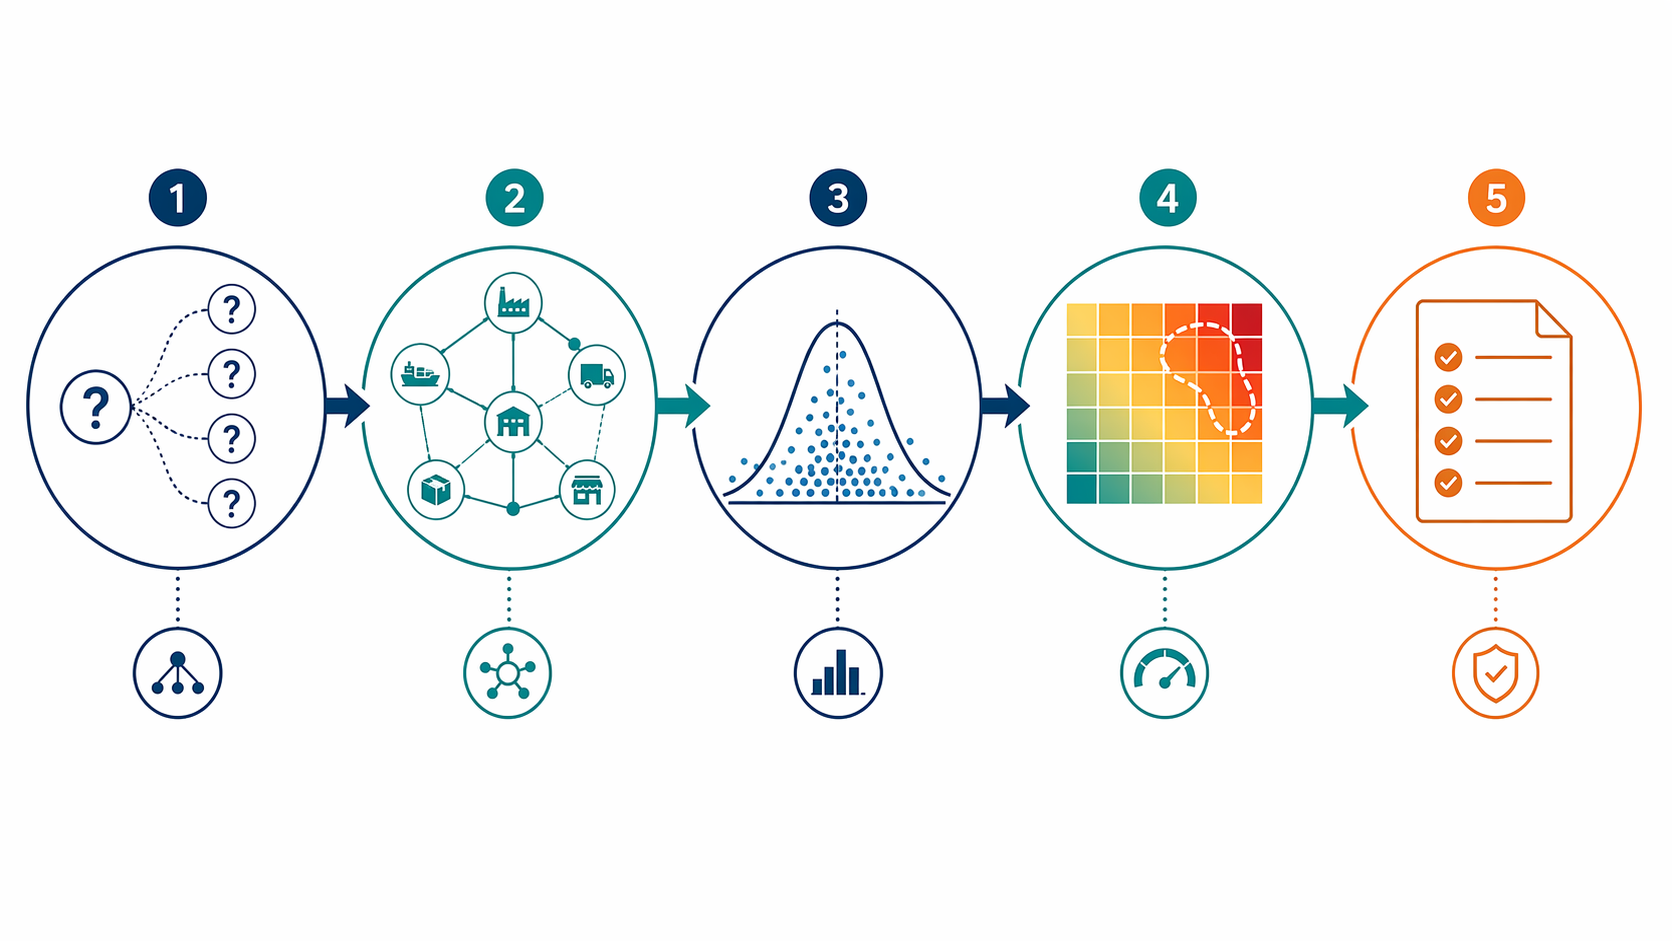
A Workflow That Turns Exposure Into Decisions
The workflow does not need to be theatrical. It needs to be repeatable enough that planners can run it before an oil shock and disciplined enough that decision owners agree what they will do if certain thresholds appear.
- Define scenario families: short shock, prolonged shock, de-escalation with lagging freight rates, regional capacity squeeze, supplier cost pass-through, and infrastructure disruption.
- Map propagation in the digital twin: identify exposed suppliers, plants, lanes, ports, warehouses, customer commitments, inventory buffers, and contract constraints.
- Run probabilistic simulations: sample fuel, freight, demand, supply, and infrastructure variables across plausible ranges instead of one approved value.
- Identify exposure ranges: separate tolerable cost movement from cases that break margin, service, working capital, or production continuity thresholds.
- Pre-commit mitigation playbooks: assign actions, owners, triggers, and constraints before the market forces a rushed decision.
The playbook is where the work becomes defensible. If the 90th-percentile simulated case shows a set of Asia-to-U.S. lanes breaching cost and service thresholds, the transportation owner should already know whether to tender earlier, split volume, activate an alternate port pair, or reserve capacity under a more expensive but capped arrangement. If a resin supplier becomes the cost amplifier, sourcing needs an approved allocation rule or negotiation trigger. If inventory protects service but consumes too much cash, finance should have agreed which SKUs deserve the buffer and which do not.
This is also where leadership discipline shows up. A company that waits to decide whether it is willing to pay for backup capacity after the shock has already repriced the lane is not scenario planning; it is post-event justification. Pre-commitment does not mean every mitigation is executed early. It means the trigger, owner, and trade-off are clear enough that the first meeting after the shock is not spent rediscovering the network.
What the Mitigation Menu Can Look Like
The right actions depend on the network, but the categories are familiar. Transportation teams can test modal shifts, lane splits, port substitutions, tender timing, and capacity reservations. Sourcing teams can test dual-source allocation, supplier cost pass-through limits, and geographic substitution. Inventory teams can test temporary buffers for constrained SKUs, postponement, and customer allocation rules. Commercial and finance teams can test surcharge clauses, margin floors, and approval thresholds.
The important difference is that these actions are not brainstormed after the price spike. They are attached to simulated exposure ranges. For example, if a set of runs shows that a transport-cost increase becomes dangerous only when paired with supplier delay, the playbook should not automatically buy capacity for every fuel-price movement. It should define the combined trigger.
Benchmarks Help, But They Are Not Guarantees
Vendor-partnered benchmarks can be useful as directional evidence, as long as they are not treated as laws of physics. Trax Technologies cites MIT Center for Transportation & Logistics-related material reporting that organizations using AI-enhanced scenario planning achieved 35% faster disruption response times and 23% lower associated costs.[4] Those figures are worth noting, but the publicly accessible material does not provide enough methodological detail to treat them as independently verified averages across all industries, network types, and maturity levels.
The mechanism is more important than the headline percentage. Faster response comes from narrowing the decision set before the disruption: fewer emergency meetings, fewer ad hoc data pulls, fewer arguments over which exposure matters. Lower associated cost comes only if the simulated playbook points to actions that are operationally available and commercially approved. A model cannot save money with an alternate route that procurement never contracted, a supplier that cannot pass qualification, or inventory that was optimized out of the system six months earlier.
Where This Fits Beside Detection and Other Disruption Planning
Scenario simulation is not the same capability as real-time disruption detection. Detection tells the organization that a chokepoint, port, lane, or supplier signal is changing now. Scenario simulation prepares the organization for what it will do if that signal crosses a threshold. For Hormuz-specific monitoring, the related ChainSignal article on how AI predicts oil supply disruptions at the Strait of Hormuz covers the detection side; this planning workflow belongs upstream of that alert.
The same separation applies to other disruption types. Hurricane planning, labor disruption planning, and geopolitical disruption planning can all use scenario simulation, but each needs different variables, trigger points, and response owners. A company deciding which capabilities to fund should distinguish scenario generation, probabilistic exposure modeling, digital twin network mapping, real-time sensing, and execution orchestration. Bundling all of them under “AI resilience” makes vendor decks cleaner and operating plans weaker.
The Practical Boundary
AI scenario simulation is most valuable when the company has enough usable data to make the network representation credible: supplier locations and constraints, transportation lanes and costs, carrier options, inventory positions, lead times, demand priorities, contractual terms, and decision rights. Without that base, the model may still produce elegant distributions, but planners will spend the crisis arguing over whether the twin resembles the business.
It also requires leadership willing to pre-commit response options before prices move. That is the uncomfortable part. The model can show that a high-risk scenario justifies paying for capacity, qualifying a second supplier, carrying selective inventory, or changing customer allocation rules. It cannot make those trade-offs politically painless.
Used well, AI-powered scenario simulation does not promise protection from oil volatility. It gives planners a quantified view of where volatility hurts, how often severe outcomes appear in the modeled range, and which actions are worth approving before the next shock turns a planning assumption into a live cost.
References
- Short-Term Energy Outlook: Global Oil Markets, U.S. Energy Information Administration, July 2026, https://www.eia.gov/outlooks/steo/report/global_oil.php
- Monte Carlo simulation of downstream oil supply chain disruptions, Nature Scientific Reports, 2025, https://www.nature.com/articles/s41598-025-22678-9
- Supply Chain Scenario Analysis: Global Manufacturing Impacts of a Short vs Prolonged U.S.-Iran Conflict, Logistics Viewpoints, March 4, 2026, https://logisticsviewpoints.com/2026/03/04/supply-chain-scenario-analysis-global-manufacturing-impacts-of-a-short-vs-prolonged-u-s-iran-conflict/
- AI in Supply Chain: AI-Powered Scenario Planning, Trax Technologies, https://www.traxtech.com/ai-in-supply-chain/ai-powered-scenario-planning
Comments
Join the discussion with an anonymous comment.