Why the 'Sensing vs. Forecasting' Frame Misleads Practitioners
Most articles framing demand sensing against demand forecasting treat the two as competing choices. That framing produces a wrong answer to the wrong question. Sensing and forecasting are not alternatives — they occupy different positions in the same planning stack, operating on different time horizons with different data inputs and different decision objectives.
The practitioner's actual question is architectural: Is our organization ready to add demand sensing on top of our existing forecast baseline? That question has a concrete answer, and it depends on four prerequisites — none of which involve technology selection.
For full definitions of each term and a detailed explanation of how sensing, forecasting, and planning relate hierarchically, see Demand Sensing vs. Demand Forecasting: Definition and Disambiguation and Demand Sensing vs. Demand Forecasting: Definitions, Differences, and AI Roles. This article does not restate those definitions. It addresses what comes after: readiness assessment, architectural fit, and ROI measurement.
The Four Prerequisites for Demand Sensing Deployment
Gartner research — cited in a ToolsGroup analysis of demand sensing readiness — identifies four organizational prerequisites that must be in place before a demand sensing investment makes sense. These are not vendor selection criteria. They are decision gates. An organization that cannot pass all four should not begin deployment.
Note that the Gartner source underlying these prerequisites dates to 2017. The core logic remains operationally sound and is corroborated by multiple current practitioners, but Gartner's specific maturity model framing may have evolved. Treat the thresholds as directionally reliable, not as current Gartner guidance.
Gate 1: Timely Downstream Data Access
Demand sensing requires near-real-time visibility into downstream demand signals — most critically, point-of-sale data. Gartner's research puts the minimum viable threshold at POS coverage across at least 40% of the retailer network. Below that level, the signal-to-noise ratio makes sensing unreliable.
Organizations that do not yet have POS access at that threshold can pursue a phased approach: start with channel sell-out data, then add POS feeds, then layer in external market signals. The phased path is legitimate, but each phase requires its own data integration work before sensing value is realizable.
Gate 2: Stage 3 Demand Management Maturity
Stage 3 demand management maturity means the organization has: a planning system of record (SOR) in active use; a consensus demand plan with an 18–24 month horizon; and cross-functional roles and accountability structures that govern that plan. This is not a technology requirement — it is a process and organizational requirement.
The implication, corroborated by SR Analytics' review of sensing deployment patterns, is that Stage 3 requires standardized processes, dedicated technology, cross-functional collaboration, and established data governance practices. Organizations that lack any of these elements are not at Stage 3.
Gate 3: Supply Chain Execution Agility in the 0–8 Week Horizon
This prerequisite is frequently overlooked. Demand sensing improves the accuracy and latency of near-term demand signals. But if the supply chain cannot act on those signals within the 0–8 week window — because production schedules are locked, replenishment cycles are too long, or supplier lead times exceed the sensing horizon — the accuracy improvement produces no operational benefit.
There's no point in increasing accuracy and reducing latency in your demand signals if you can't run your supply chain with a 0–8 week planning horizon.
Execution agility is a prerequisite for sensing ROI, not a benefit that sensing delivers. Assess whether your organization can actually adjust replenishment, production, or inventory positioning within the near-term window before investing in sensing capability.
Gate 4: A Quantifiable Business Case
Before deployment, the business case must be anchored to specific, measurable operational outcomes: fill rates, on-time delivery performance, inventory carrying costs, and expediting costs. Without a pre-deployment baseline on these metrics, it is impossible to confirm post-deployment value — or to justify continued investment if results are mixed.
The business case exercise also forces the cross-functional alignment that Stage 3 maturity requires. If supply, finance, and commercial teams cannot agree on which metrics matter before deployment, they will not agree on whether the deployment succeeded.
| Prerequisite | Minimum Threshold | What Failure Looks Like |
|---|---|---|
| Timely downstream data access | POS coverage ≥40% of retailer network | Sensing operates on internal orders only — lagging indicator, no early signal advantage |
| Stage 3 demand management maturity | Active planning SOR, 18–24 month consensus plan, cross-functional accountability | No baseline to correct against; sensing outputs contradict unaligned plans |
| Supply chain execution agility | Operational responsiveness within 0–8 week horizon | Accurate near-term forecasts with no ability to act — zero ROI on accuracy improvement |
| Quantifiable business case | Baseline metrics on fill rate, inventory, expediting costs established pre-deployment | No way to confirm value post-deployment; investment case collapses under scrutiny |
Planning Architecture: How Sensing Layers on the Forecast Baseline
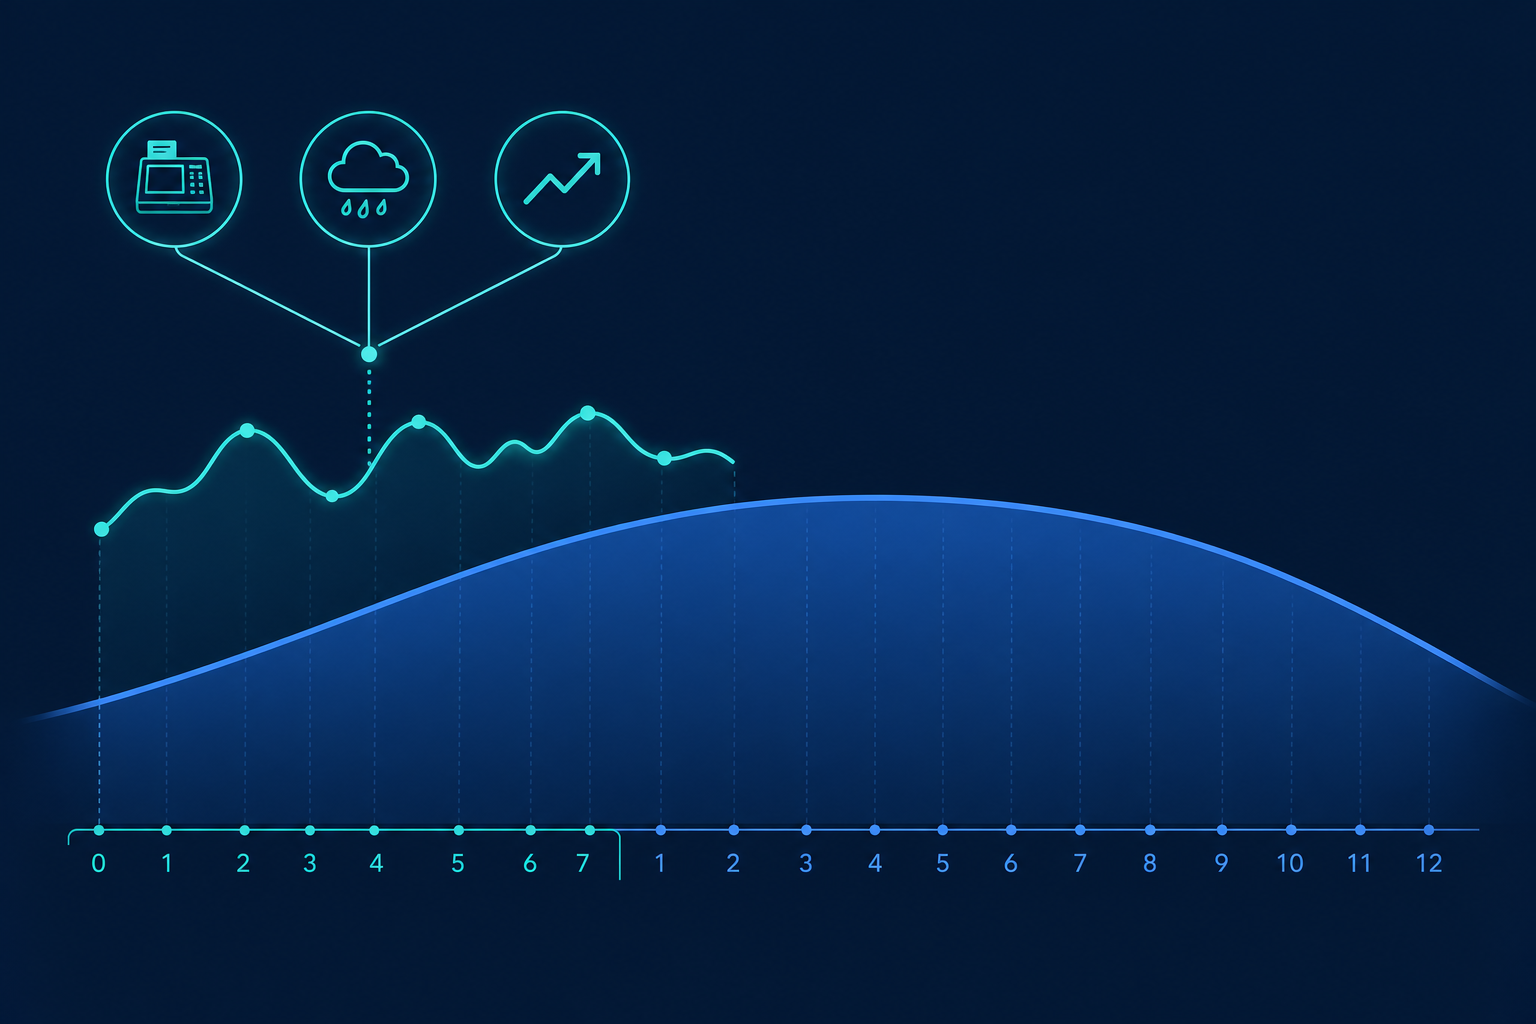
The full planning stack has two distinct layers. The long-range forecast baseline — typically driven by statistical models and enriched with AI — projects demand over an 18–24 month horizon. It informs capacity planning, procurement commitments, and S&OP. The near-term sensing correction layer sits on top of that baseline, adjusting the 0–8 week window as real-time signals shift.
For deeper context on AI forecasting methods that power the long-range baseline, see Demand Forecasting AI: Definition, Methods, and Operational Context. For the full containment hierarchy across sensing, forecasting, and planning, see Demand Sensing, Demand Forecasting, and Demand Planning: Definitions, Hierarchy, and AI Roles.
As Infor's framing of the architectural relationship makes explicit: sensing is not a replacement for demand forecasting — it is an additional layer of agility that keeps plans current as conditions change. The two layers are complementary and dependent on each other.
The Unified ML Architecture Principle
One architectural risk that practitioners underestimate: running the sensing layer on a different ML engine than the long-range baseline. When the two layers use separate models with separate training data and separate feature sets, their outputs can diverge — producing contradictory signals that planners must manually reconcile.
RELEX Solutions' demand sensing architecture guidance makes the case for using the same ML engine across both short-term sensing and medium- to long-term demand planning. A unified engine eliminates the disconnect between horizons and allows the model to learn from the full temporal range of demand behavior.
Native Downstream Integration Is Not Optional
The latency advantage of demand sensing — its ability to detect and respond to demand shifts days or weeks before conventional forecasting cycles would catch them — is only realized if the sensing output flows automatically into downstream supply, inventory, and fulfillment systems.
An accurate near-term forecast sitting in a standalone dashboard, waiting for a planner to manually translate it into a replenishment order, captures none of that advantage. The integration path from sensing output to operational action must be automated. This is a design requirement, not a post-deployment optimization.
Signal Hierarchy: What Feeds the Near-Term Correction Layer
Demand sensing systems ingest signals across three tiers, ordered here from most foundational to most supplementary. The value of each tier depends on data quality, integration latency, and the volatility profile of the products being planned.
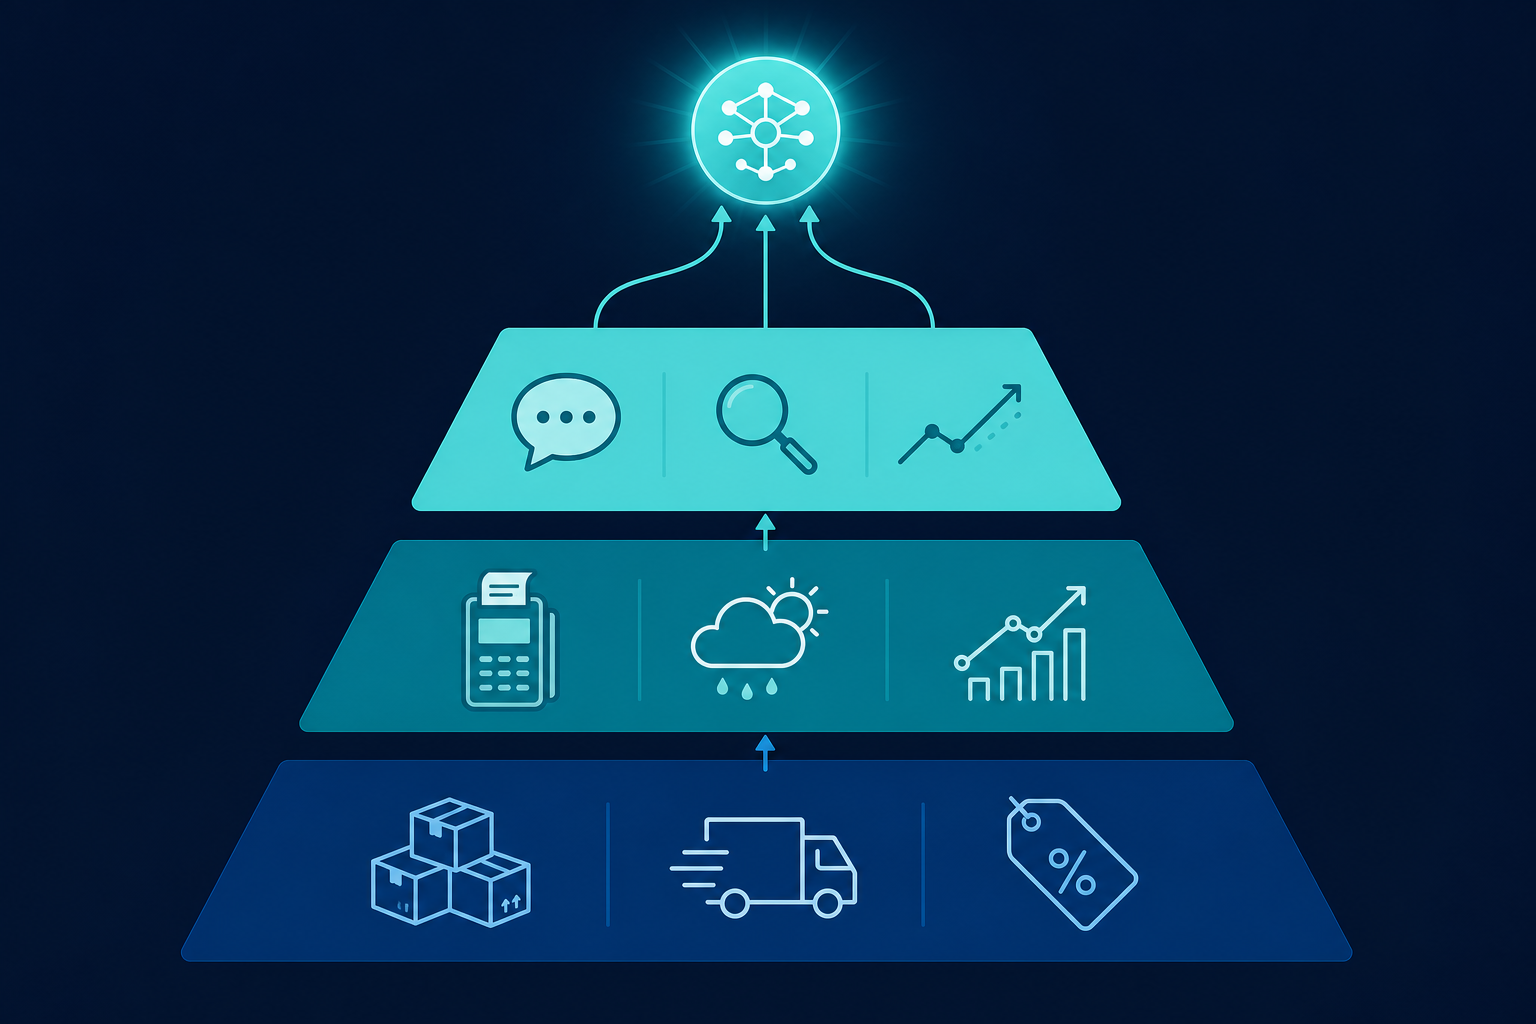
- Internal signals — orders, shipments, inventory positions, and promotional calendars. These are the highest-quality signals because the organization controls and understands them. They form the floor of any sensing model.
- External signals — POS data, weather, macroeconomic indicators, and competitor activity. These extend visibility beyond the organization's own systems and are increasingly critical as AWS and Kearney's analysis notes that 80% or more of today's supply chain data is generated externally — by suppliers, vendors, end users, and third parties.
- Unstructured signals — social media sentiment, search trend data, and influencer-driven demand patterns. These carry the highest noise-to-signal ratio and require the most feature engineering to become usable. They are most valuable for products with strong consumer-trend sensitivity.
Signal processing and feature engineering are the operational work that transforms raw data feeds into usable model inputs. Rule-based logic — filtering out known anomalies, holiday effects, or one-time events — can complement ML models to prevent noise from corrupting the correction layer. More data sources do not automatically produce better sensing output; data quality and integration latency matter more than volume.
ROI and KPI Measurement Framework
Measuring demand sensing ROI requires a pre-deployment baseline and a consistent set of KPIs tracked across a sufficient post-deployment window — typically 6–12 months — to separate signal from seasonal noise. The following framework covers the primary metrics, benchmark ranges, and attribution caveats practitioners need.
Primary KPIs
- MAPE (Mean Absolute Percentage Error) — the primary tracking metric for forecast accuracy. Measure MAPE at the SKU-location level in the 0–8 week horizon, comparing pre- and post-sensing deployment. Models consistently underperforming against actuals should be re-tuned before attributing underperformance to the sensing approach itself.
- Safety stock levels — improved near-term accuracy should reduce the uncertainty buffer embedded in safety stock calculations. Track inventory carrying costs and safety stock days-on-hand separately from cycle stock.
- Fill rate and service level — the operational outcome that sensing is designed to protect. Track case fill rate and line fill rate at the customer and distribution center level.
- Expediting costs — a proxy for supply chain agility failures. Sensing should reduce unplanned expediting if the execution agility prerequisite was genuinely met.
- Manual override rate — the percentage of sensing-generated forecasts that planners manually adjust. A high override rate signals either an algorithm trust problem or a genuine model accuracy problem; both require investigation.
Benchmark Ranges
| Metric | Benchmark Range | Source | Attribution Caveat |
|---|---|---|---|
| Forecast accuracy improvement (MAPE reduction) | 10–20% | Kearney 2023, as cited by Kinaxis and AWS | Original Kearney report not independently verified; cite as 'Kearney, as cited by [Kinaxis/AWS]' |
| Safety stock / inventory reduction | 5–10% | Kearney 2023, as cited by Kinaxis and AWS | Same caveat as above; treat as directional |
| Revenue lift | Up to 2% | Kearney 2023, as cited by AWS | Directional; dependent on fill rate improvement and stockout reduction |
| Forecast error reduction (AI-powered supply chains) | 30–50% | McKinsey, 'Taking the Pulse of Shifting Supply Chains', via SR Analytics | Not independently verified against original McKinsey publication; treat as directional |
| Reduction in lost sales from stockouts | Up to 65% | McKinsey, via SR Analytics | Same caveat as above |
| Weekly forecast accuracy (Atria case, RELEX) | 98.1% | RELEX Solutions / SR Analytics | Single-company case; highly seasonal food products context |
| Reduction in manual forecasting adjustments (Atria) | 13% | RELEX Solutions / SR Analytics | Same case context |
| Annual waste reduction (Atria) | €2M+ | RELEX Solutions / SR Analytics | Vendor-reported; short shelf-life food products context |
Top Failure Modes and How to Mitigate Them
Most demand sensing deployments that fail to deliver measurable value fail for organizational and data reasons, not technology reasons. The following failure modes are the most consistently documented across practitioner sources.
Data Integration Failure Across Silos
The most frequently cited primary failure mode. When demand signals from different systems, regions, or business units cannot be brought together in a consistent, timely data model, the sensing layer operates on incomplete information. InterSystems' survey data on supply chain AI adoption identifies integrated inventory management with ERP and electronic POS systems as a critical failure point, cited by nearly a quarter of survey respondents.
Mitigation: data integration architecture must be resolved before sensing model development begins. The forecast needs to communicate adjustments automatically back to transactional systems — not as a post-deployment enhancement but as a design prerequisite.
Signal Noise and Overfitting
Adding more data sources does not automatically produce better sensing output. Unfiltered external signals — particularly unstructured data like social sentiment — introduce noise that can cause models to overfit to short-term anomalies and produce unstable near-term forecasts.
Mitigation: prioritize signal quality over signal volume. Establish clear inclusion criteria for each data source before adding it to the model. Use rule-based filters to exclude known anomalies, and monitor model stability after each new signal source is introduced.
Algorithm Aversion and the Planner Trust Gap
Planners who cannot understand why a sensing model changed a forecast will override it. High override rates nullify the model's value and create a feedback loop where training data is contaminated by human corrections rather than actual demand.
As Kinaxis notes in its demand sensing guidance, transparent and explainable forecasts not only reduce overrides but build the trust essential for broad adoption. Planners need visibility into which demand drivers caused a forecast change, the confidence range around that change, and the history of previous changes and their outcomes.
Mitigation: explainability is a functional requirement, not a nice-to-have. Evaluate sensing platforms on their ability to surface driver attribution before deployment, not after.
Misaligned Planning Cadence
Demand sensing compresses planning decision windows. Organizations accustomed to weekly planning reviews may need to move to daily or continuous monitoring to capture the value of near-term signal updates. SPS Commerce's analysis of sensing adoption patterns notes that this cadence compression creates organizational friction if teams are not prepared for it.
Mitigation: redesign planning meeting cadences and decision authority structures before go-live. If the organization cannot act on daily signals, sensing's latency advantage is theoretical.
Cross-Functional Misalignment
Supply, IT, sales, and commercial functions must be aligned on sensing's role, its outputs, and their respective responsibilities before deployment. Misalignment at go-live produces conflicting manual adjustments, competing planning systems, and accountability gaps when results disappoint.
Vendor Landscape: Platforms Supporting Demand Sensing
For organizations that have passed the four readiness gates and are beginning platform evaluation, the following vendors have documented demand sensing capabilities as of mid-2026. This is an orientation list, not a ranked comparison — vendor selection requires evaluation against your specific data environment, ERP integration requirements, and planning architecture.
- Kinaxis Maestro — concurrent planning platform with integrated demand sensing and native downstream supply chain connectivity.
- RELEX Solutions — unified ML architecture across sensing and long-range planning; documented deployments in food retail and short shelf-life categories.
- Infor — adaptive model selection with automated recalibration; positions sensing as an agility layer on top of existing demand forecasting.
- ToolsGroup — probabilistic forecasting platform with documented sensing capabilities and the organizational readiness framework referenced in this article.
- o9 Solutions — integrated business planning platform with demand sensing as part of a broader IBP architecture.
- e2open — supply chain network platform with demand sensing capabilities oriented toward multi-tier visibility.
- Blue Yonder — demand planning platform with ML-driven sensing capabilities integrated into its broader supply chain planning suite.
- AWS / Kearney platform — cloud-native demand sensing architecture ingesting 200+ data sources; benchmarked at 10–20% forecast accuracy improvement in documented deployments.
CPG and FMCG practitioners looking for a use-case-level reference on sensing in seasonal product environments should see AI Demand Sensing for Seasonal CPG: Use-Case Reference for deployment patterns and outcome benchmarks specific to that context.